
gnuplot is a command-line and GUI program that can generate two- and three-dimensional plots of functions, data, and data fits. The program runs on all major computers and operating systems . It is a program with a fairly long history, dating back to 1986. Despite its name, this software is not part of the GNU Project.

R is a programming language and free software environment for statistical computing and graphics. It is supported by the R Core Team and the R Foundation for Statistical Computing. It is widely used among statisticians and data miners for developing statistical software and data analysis. Polls, data mining surveys, and studies of scholarly literature databases show that R is highly popular; since August 2021, R ranks 14th in the TIOBE index, a measure of programming language popularity.

Scientific visualization is an interdisciplinary branch of science concerned with the visualization of scientific phenomena. It is also considered a subset of computer graphics, a branch of computer science. The purpose of scientific visualization is to graphically illustrate scientific data to enable scientists to understand, illustrate, and glean insight from their data. Research into how people read and misread various types of visualizations is helping to determine what types and features of visualizations are most understandable and effective in conveying information.

Hierarchical Data Format (HDF) is a set of file formats designed to store and organize large amounts of data. Originally developed at the National Center for Supercomputing Applications, it is supported by The HDF Group, a non-profit corporation whose mission is to ensure continued development of HDF5 technologies and the continued accessibility of data stored in HDF.
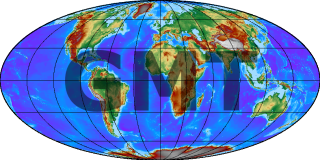
Generic Mapping Tools (GMT) are an open-source collection of computer software tools for processing and displaying xy and xyz datasets, including rasterisation, filtering and other image processing operations, and various kinds of map projections. The software stores 2-D grids as COARDS-compliant netCDF files and comes with a comprehensive collection of free GIS data, such as coast lines, rivers, political borders and coordinates of other geographic objects. Users convert further data from other sources and import them. GMT stores the resulting maps and diagrams in PostScript (PS) or Encapsulated PostScript (EPS) format.
GRIB is a concise data format commonly used in meteorology to store historical and forecast weather data. It is standardized by the World Meteorological Organization's Commission for Basic Systems, known under number GRIB FM 92-IX, described in WMO Manual on Codes No.306. Currently there are three versions of GRIB. Version 0 was used to a limited extent by projects such as TOGA, and is no longer in operational use. The first edition is used operationally worldwide by most meteorological centers, for Numerical Weather Prediction output (NWP). A newer generation has been introduced, known as GRIB second edition, and data is slowly changing over to this format. Some of the second-generation GRIB are used for derived product distributed in Eumetcast of Meteosat Second Generation. Another example is the NAM model.
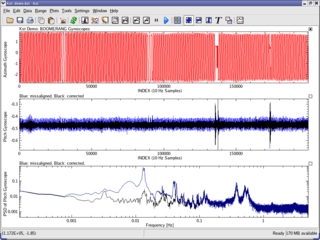
Kst is a plotting and data viewing program. It is a general purpose plotting software program that evolved out of a need to visualize and analyze astronomical data, but has also found subsequent use in the real time display of graphical information. Kst is a KDE application and is freely available for anyone to download and use under the terms of the GPL. It is noted for being able to graph real-time data acquisition.

3D computer graphics, sometimes called CGI, 3DCG or three-dimensional computer graphics, are graphics that use a three-dimensional representation of geometric data that is stored in the computer for the purposes of performing calculations and rendering 2D images. The resulting images may be stored for viewing later or displayed in real time. Unlike 3D film and similar techniques, the result is two-dimensional, without the illusion of being solid.
The Climate Data Analysis Tool (CDAT) is plotting software used in atmospheric sciences and climatology.
Statistical graphics, also known as statistical graphical techniques, are graphics used in the field of statistics for data visualization.
Dap is a statistics and graphics program based on the C programming language that performs data management, analysis, and C-style graphical visualization tasks without requiring complex syntax.
The Grid Analysis and Display System (GrADS) is an interactive desktop tool that is used for easy access, manipulation, and visualization of earth science data. The format of the data may be either binary, GRIB, NetCDF, or HDF-SDS. GrADS has been implemented worldwide on a variety of commonly used operating systems and is freely distributed over the Internet.
NetCDF is a set of software libraries and self-describing, machine-independent data formats that support the creation, access, and sharing of array-oriented scientific data. The project homepage is hosted by the Unidata program at the University Corporation for Atmospheric Research (UCAR). They are also the chief source of netCDF software, standards development, updates, etc. The format is an open standard. NetCDF Classic and 64-bit Offset Format are an international standard of the Open Geospatial Consortium.

A plot is a graphical technique for representing a data set, usually as a graph showing the relationship between two or more variables. The plot can be drawn by hand or by a computer. In the past, sometimes mechanical or electronic plotters were used. Graphs are a visual representation of the relationship between variables, which are very useful for humans who can then quickly derive an understanding which may not have come from lists of values. Given a scale or ruler, graphs can also be used to read off the value of an unknown variable plotted as a function of a known one, but this can also be done with data presented in tabular form. Graphs of functions are used in mathematics, sciences, engineering, technology, finance, and other areas.
Common modeling infrastructure refers to software libraries that can be shared across multiple institutions in order to increase software reuse and interoperability in complex modeling systems. Early initiatives were in the climate and weather domain, where software components representing distinct physical domains tended to be developed by domain specialists, often at different organizations. In order to create complete applications, these needed to be combined, using for instance a general circulation model, that transfers data between different components. An additional challenge is that these models generally require supercomputers to run, to account for the collected data and for data analyses. Thus, it was important to provide an efficient massively parallel computer system, and the processing hardware and software, to account for all the different workloads and communication channels.
The Climate and Forecast (CF) metadata conventions are conventions for the description of Earth sciences data, intended to promote the processing and sharing of data files. The metadata defined by the CF conventions are generally included in the same file as the data, thus making the file "self-describing". The conventions provide a definitive description of what the data values found in each netCDF variable represent, and of the spatial and temporal properties of the data, including information about grids, such as grid cell bounds and cell averaging methods. This enables users of files from different sources to decide which variables are comparable, and is a basis for building software applications with powerful data extraction, grid remapping, data analysis, and data visualization capabilities.

ggplot2 is an open-source data visualization package for the statistical programming language R. Created by Hadley Wickham in 2005, ggplot2 is an implementation of Leland Wilkinson's Grammar of Graphics—a general scheme for data visualization which breaks up graphs into semantic components such as scales and layers. ggplot2 can serve as a replacement for the base graphics in R and contains a number of defaults for web and print display of common scales. Since 2005, ggplot2 has grown in use to become one of the most popular R packages.

Metview is a meteorological workstation and batch system developed at the European Centre for Medium-Range Weather Forecasts.