List of U.S. communities with Native-American majority populations

Last updated

The following is a partial list of United States of America (U.S.) communities with Native-American majority populations. It includes United States cities and towns in which a majority (over half) of the population is Native American (American Indian or Alaska Native), according to data from the 2020 Census.

Contents

This list does not include locations in which the 2020 Census shows a plurality of the residents are Native American.

The list is organized by state and, within each state, by population size. It includes 23 states and 656 communities.

This is one of the lists of U.S. cities with non-white majority populations.

Alaska

PlaceTypeTotal PopulationNative PopulationPercent Native
Bethel city7013471067.16%
Utqiaġvik city5584312756.00%
Nome city4435248956.12%
Kotzebue city3476241169.36%
Dillingham city2619151457.81%
Metlakatla CDP1664127576.62%
Hooper Bay city1388133796.33%
Hoonah city109958052.78%
Chevak city99092793.64%
Emmonak city87179491.16%
Klawock city86645452.42%
Point Hope city86476588.54%
Togiak city85677290.19%
Savoonga city84181396.67%
Kwethluk city83279295.19%
Selawik city81679397.18%
Quinhagak city80776194.30%
Unalakleet city77564382.97%
Alakanuk city76772494.39%
Kipnuk CDP70968596.61%
Noorvik city70467996.45%
Akiachak CDP68664894.46%
Toksook Bay city66263896.37%
Kotlik city65865499.39%
Stebbins city65859790.73%
Sand Point city65137757.91%
Gambell city64261896.26%
Wainwright city63260295.25%
Pilot Station city63160195.25%
Kasigluk CDP62860095.54%
Mountain Village city62859194.11%
St. Mary's city61756992.22%
Kake city60346977.78%
Scammon Bay city60359698.84%
Nunapitchuk city59458197.81%
Noatak CDP58454292.81%
Shishmaref city58155795.87%
Buckland city56853994.89%
Aniak city55840772.94%
New Stuyahok city53848489.96%
Chefornak city53548891.21%
Napaskiak city51549495.92%
Manokotak city51446790.86%
Nuiqsut city51447692.61%
Marshall city51048094.12%
Kongiganak CDP50047895.60%
Galena city49734769.82%
St. Michael city47442689.87%
Kiana city47342289.22%
Tuntutuliak CDP47245997.25%
Anaktuvuk Pass city46635175.32%
Akiak city46444495.69%
Fort Yukon city46039185.00%
Tuluksak CDP45843093.89%
Kivalina city44743697.54%
Saxman city44731670.69%
Brevig Mission city44439388.51%
Russian Mission city43741394.51%
St. Paul city43237486.57%
Eek city43139792.11%
Tununak CDP42240094.79%
Hydaburg city40233583.33%
Angoon city39631880.30%
Atmautluak CDP39037596.15%
Elim city38734087.86%
Kwigillingok CDP38737596.90%
Copper Center CDP38420753.91%
Napakiak city37434191.18%
Point Lay CDP33731091.99%
Koyuk city32929689.97%
McGrath city32118657.94%
Huslia city31929090.91%
Nightmute city31029795.81%
Nanwalek CDP30423075.66%
Ambler city29625084.46%
Nulato city29121573.88%
Atqasuk city29025387.24%
Lower Kalskag city28827294.44%
Kaktovik city28527195.09%
Shungnak city28226393.26%
Goodnews Bay city27024390.00%
Teller city26323488.97%
Tanana city25420279.53%
Aleknagik city24816867.74%
Northway CDP23721189.03%
Old Harbor city23418579.06%
Grayling city22820589.91%
Nunam Iqua city22721293.39%
Upper Kalskag city22719585.90%
Newtok CDP22020593.18%
Shaktoolik city21418787.38%
Mekoryuk city20919693.78%
Venetie CDP20719192.27%
Holy Cross city20316983.25%
Kobuk city20216682.18%
Koliganek CDP19617790.31%
Newhalen city19115179.06%
Deering city18917391.53%
White Mountain city18717392.51%
Allakaket city18415584.24%
Golovin city18116490.61%
Port Graham CDP18115183.43%
Port Lions city17911162.01%
Tyonek CDP17913977.65%
Manley Hot Springs CDP17811464.04%
Kaltag city17314784.97%
Wales city17315187.28%
Kokhanok CDP17013981.76%
Tanacross CDP15912578.62%
Minto CDP15714189.81%
Arctic Village CDP15614592.95%
Nondalton city14811980.41%
Ruby city14512988.97%
Mentasta Lake CDP14210171.13%
Tetlin CDP13411485.07%
Iliamna CDP1258064.00%
Pitkas Point CDP12212098.36%
Twin Hills CDP1209881.67%
Ouzinkie city1188471.19%
Ekwok city1169884.48%
Gulkana CDP1156859.13%
Chignik city1146960.53%
Chuathbaluk city1129988.39%
Sleetmute CDP1128071.43%
Port Heiden city1088679.63%
Shageluk city1049490.38%
Mertarvik CDP1019796.04%
Koyukuk city9898100.00%
Tatitlek CDP977779.38%
Klukwan CDP967578.13%
Nikolai city967679.17%
Crooked Creek CDP948893.62%
Perryville CDP938187.10%
Circle CDP918492.31%
Diomede city907987.78%
Hughes city897988.76%
Chignik Lagoon CDP886169.32%
South Naknek CDP864552.33%
Pilot Point city805973.75%
Levelock CDP766788.16%
Anvik city756688.00%
Igiugig CDP745472.97%
St. George city726387.50%
Chistochina CDP714867.61%
Chenega CDP704057.14%
Oscarville CDP706795.71%
Clark's Point city686392.65%
Akhiok city665684.85%
Rampart CDP645179.69%
Chignik Lake CDP635790.48%
Platinum city625385.48%
Eagle Village CDP603253.33%
Chalkyitsik CDP595491.53%
Stony River CDP575087.72%
Atka city555294.55%
Beaver CDP494693.88%
Nikolski CDP432865.12%
Egegik city412458.54%
Nelson Lagoon CDP413892.68%
Larsen Bay city372875.68%
Stevens Village CDP3737100.00%
Birch Creek CDP363288.89%
Karluk CDP332678.79%
Healy Lake CDP272177.78%
Red Devil CDP262076.92%
Alatna CDP151493.33%
Lime Village CDP131292.31%
Ugashik CDP4375.00%

Arizona

PlaceTypeTotal PopulationNative PopulationPercent Native
Tuba City CDP8264764392.49%
Kayenta CDP4771454295.20%
Chinle CDP4668419589.87%
Whiteriver CDP4569447597.94%
San Carlos CDP4035391997.13%
Fort Defiance CDP3645331791.00%
Sacaton CDP3323311493.71%
Window Rock CDP2561245595.86%
Sells CDP2155207996.47%
Cibecue CDP1832177396.78%
Bylas CDP1789176998.88%
Casa Blanca CDP1753167795.66%
Kaibito CDP1566153497.96%
North Fork CDP1504140393.28%
Tsaile CDP1446100569.50%
Lukachukai CDP1432141999.09%
St. Michaels CDP1430131792.10%
First Mesa CDP1355133698.60%
Peridot CDP1314129698.63%
LeChee CDP1303122193.71%
Many Farms CDP1259120095.31%
Blackwater CDP1234113391.82%
Dilkon CDP1233117895.54%
Canyon Day CDP1218116595.65%
Peach Springs CDP1121106895.27%
Pinon CDP1113103993.35%
Komatke CDP103296993.90%
Hotevilla-Bacavi CDP101198897.73%
Rainbow City CDP100699498.81%
Leupp CDP95892496.45%
Ak-Chin Village CDP95381185.10%
Houck CDP89587197.32%
Ganado CDP89382992.83%
Maricopa Colony CDP89079789.55%
Second Mesa CDP84783398.35%
Hondah CDP82977092.88%
Moenkopi CDP78876296.70%
Whitecone CDP78376497.57%
Chilchinbito CDP77376398.71%
Cameron CDP74772096.39%
Seven Mile CDP74673698.66%
Kykotsmovi Village CDP74472297.04%
Shongopovi CDP71470799.02%
St. Johns CDP70666694.33%
East Fork CDP68067098.53%
Upper Santan Village CDP67465196.59%
Round Rock CDP66463195.03%
Low Mountain CDP65262996.47%
Gila Crossing CDP65060492.92%
Stotonic Village CDP64456788.04%
Sanders CDP60547478.35%
Sacaton Flats Village CDP59355393.25%
Dennehotso CDP59058498.98%
Sawmill CDP56756098.77%
Rock Point CDP56153495.19%
Nazlini CDP51850597.49%
Teec Nos Pos CDP51549796.50%
Burnside CDP50047695.20%
McNary CDP50046793.40%
Shonto CDP49948897.80%
Winslow West CDP48926253.58%
Goodyear Village CDP48042287.92%
Santa Rosa CDP47747298.95%
Tonalea CDP45444497.80%
Lower Santan Village CDP44041794.77%
Rough Rock CDP43142197.68%
Tees Toh CDP42541898.35%
Greasewood CDP37836897.35%
Turkey Creek CDP377377100.00%
Cedar Creek CDP37636396.54%
Bitter Springs CDP36435096.15%
Red Mesa CDP36032289.44%
Pisinemo CDP359359100.00%
Jeddito CDP35333895.75%
Wet Camp Village CDP30729094.46%
East Globe CDP26924791.82%
Keams Canyon CDP26723286.89%
Sacate Village CDP26525295.09%
Del Muerto CDP258258100.00%
Indian Wells CDP24522692.24%
Chuichu CDP24123396.68%
Steamboat CDP23823498.32%
Topawa CDP23423299.15%
Tolani Lake CDP22822397.81%
Cornfields CDP22122099.55%
San Miguel CDP20520399.02%
Poston CDP20316882.76%
Klagetoh CDP18418198.37%
South Komelik CDP17617398.30%
Cottonwood CDP16816799.40%
Sehili CDP16015295.00%
Anegam CDP15014999.33%
Kaibab CDP14612082.19%
Red Rock (Apache County) CDP136136100.00%
Maish Vaya CDP13312996.99%
Gu Oidak CDP13112494.66%
Seba Dalkai CDP12712497.64%
Sweet Water Village CDP12711792.13%
Ali Chuk CDP12611994.44%
Fort Apache CDP11810891.53%
Ali Chukson CDP11511297.39%
Oljato-Monument Valley CDP11511499.13%
Cowlic CDP10710598.13%
Vaiva Vo CDP989192.86%
Carrizo CDP938591.40%
Cutter CDP917885.71%
Wahak Hotrontk CDP898797.75%
Kaka CDP848196.43%
Haivana Nakya CDP727198.61%
Ali Molina CDP6161100.00%
Mojave Ranch Estates CDP583560.34%
Oak Springs CDP545398.15%
Ak Chin CDP525096.15%
Ventana CDP5252100.00%
Chiawuli Tak CDP514792.16%
Comobabi CDP4444100.00%
Ko Vaya CDP434297.67%
Valentine CDP423480.95%
Santa Cruz CDP3939100.00%
Hard Rock CDP3838100.00%
Kohatk CDP383797.37%
Charco CDP282796.43%
Wide Ruins CDP221986.36%
Lupton CDP201785.00%
Tat Momoli CDP191789.47%
Nolic CDP12975.00%
Toyei CDP3266.67%

California

PlaceTypeTotal PopulationNative PopulationPercent Native
Hoopa CDP3404285383.81%
Pala CDP163995358.15%
Weitchpec CDP1329068.18%
Kep'el CDP856677.65%
Wautec CDP493265.31%

Colorado

PlaceTypeTotal PopulationNative PopulationPercent Native
Towaoc CDP1152109895.31%

Connecticut

PlaceTypeTotal PopulationNative PopulationPercent Native
Mashantucket CDP58136763.17%

Idaho

PlaceTypeTotal PopulationNative PopulationPercent Native
Fort Hall CDP3351232469.35%
Lapwai city1259101280.38%
De Smet CDP15213186.18%

Kansas

PlaceTypeTotal PopulationNative PopulationPercent Native
Kickapoo Tribal Center CDP18316187.98%
Kickapoo Site 1 CDP12310282.93%
Kickapoo Site 7 CDP11010090.91%
Kickapoo Site 5 CDP605185.00%
Kickapoo Site 2 CDP292689.66%

Minnesota

PlaceTypeTotal PopulationNative PopulationPercent Native
Red Lake CDP1822176496.82%
Mahnomen city142673151.26%
Redby CDP1328129397.36%
Little Rock CDP1038101097.30%
Vineland CDP92380487.11%
Cass Lake city73853672.63%
Ponemah CDP60259699.00%
White Earth CDP55550891.53%
Naytahwaush CDP54147988.54%
Waubun city48626354.12%
Ball Club CDP38231381.94%
Riverland CDP32828185.67%
Pine Point CDP28327496.82%
Rice Lake CDP28324586.57%
Mahnomen CDP25219978.97%
Nett Lake CDP24122492.95%
Ogema city22111853.39%
Inger CDP20419093.14%
Twin Lakes CDP20014572.50%
Bena city16012175.63%
Elbow Lake CDP1388561.59%
Beaulieu CDP1267861.90%
Squaw Lake city1005656.00%
West Roy Lake CDP635282.54%
Ebro CDP593559.32%
Pine Bend CDP412458.54%
South End CDP393179.49%
Midway CDP261557.69%
The Ranch CDP171376.47%
Pearl River CDP3977328982.70%
Conehatta CDP1452112777.62%

Mississippi

PlaceTypeTotal PopulationNative PopulationPercent Native
Bogue Chitto CDP91577384.48%
Redwater CDP70449570.31%
Tucker CDP67058887.76%
Standing Pine CDP54344481.77%

Montana

PlaceTypeTotal PopulationNative PopulationPercent Native
Hardin city4129211251.15%
Wolf Point city2807152154.19%
North Browning CDP2727258794.87%
Pablo CDP2362137658.26%
South Browning CDP2022193095.45%
Lame Deer CDP1959182893.31%
Crow Agency CDP1691161295.33%
Fort Belknap Agency CDP1593151995.35%
Rocky Boy West CDP1065102796.43%
Browning town104896992.46%
Hays CDP102395192.96%
Poplar city83461173.26%
Harlem city82651762.59%
Ashland CDP81854466.50%
Busby CDP74668191.29%
Muddy CDP66262794.71%
Pryor CDP64856487.04%
Heart Butte CDP62758993.94%
Lodge Grass town45641390.57%
Rocky Boy's Agency CDP42338791.49%
Parker School CDP38938398.46%
East Glacier Park Village CDP38624262.69%
Boneau CDP37235695.70%
St. Pierre CDP37135595.69%
Brockton CDP36633892.35%
Frazer CDP36633792.08%
Azure CDP32331396.90%
Sangrey CDP32030695.63%
Lodge Pole CDP30328694.39%
Turtle Lake CDP28921875.43%
Starr School CDP27326697.44%
Elmo CDP25318573.12%
Big Arm CDP23513155.74%
Little Browning CDP22321495.96%
Wyola CDP19917085.43%
Babb CDP13311687.22%
Dodson town1339772.93%
Blackfoot CDP12410181.45%
Birney CDP999494.95%
Old Agency CDP846880.95%
St. Xavier CDP804455.00%
Laredo CDP372464.86%

Nebraska

PlaceTypeTotal PopulationNative PopulationPercent Native
Macy CDP1058103297.54%
Winnebago village94386892.05%
Walthill village69555579.86%
Santee village45340689.62%

Nevada

PlaceTypeTotal PopulationNative PopulationPercent Native
Wadsworth CDP109269563.64%
Owyhee CDP106694088.18%
Schurz CDP72159482.39%
Nixon CDP47344493.87%
Sutcliffe CDP31119061.09%
Fort McDermitt CDP27326095.24%

New Mexico

PlaceTypeTotal PopulationNative PopulationPercent Native
Shiprock CDP7861745594.84%
Zuni Pueblo CDP6261608497.17%
Dulce CDP2979255985.90%
Crownpoint CDP2965266189.75%
San Felipe Pueblo CDP2563251998.28%
Santo Domingo Pueblo CDP2539230690.82%
Thoreau CDP2458207684.46%
Jemez Pueblo CDP1988195398.24%
Navajo CDP1981189395.56%
Upper Fruitland CDP1655160496.92%
Waterflow CDP165192656.09%
Skyline-Ganipa CDP1637159397.31%
Church Rock CDP1569152397.07%
Ohkay Owingeh CDP1532127483.16%
Mescalero CDP1513139492.13%
Laguna CDP1303122794.17%
Taos Pueblo CDP1275109585.88%
Black Rock CDP1218106287.19%
Iyanbito CDP1198118198.58%
Alamo CDP1177110393.71%
Twin Lakes CDP101899697.84%
Santa Clara Pueblo CDP99180481.13%
Prewitt CDP87681092.47%
Isleta CDP82076092.68%
Rock Springs CDP81479797.91%
Mesita CDP81170086.31%
Fruitland CDP80846657.67%
Tohatchi CDP80270788.15%
Napi Headquarters CDP80075193.88%
Sundance CDP79674793.84%
Yah-ta-hey CDP79365182.09%
Zia Pueblo CDP76975598.18%
Paraje CDP72068595.14%
Ojo Amarillo CDP71168996.91%
San Ildefonso Pueblo CDP68347669.69%
Santa Ana Pueblo CDP67666297.93%
Pinehill CDP61556792.20%
Nenahnezad CDP59057096.61%
Williams Acres CDP51731560.93%
Newcomb CDP50544888.71%
Pinedale CDP50348095.43%
Cochiti CDP49546694.14%
Seama CDP48546395.46%
Paguate CDP48345694.41%
Pueblo of Sandia Village CDP44239589.37%
Tse Bonito CDP39230778.32%
White Cliffs CDP39128372.38%
North Acomita Village CDP38328574.41%
McCartys Village CDP36535597.26%
Nakaibito CDP35834997.49%
Acomita Lake CDP35033294.86%
Fort Wingate CDP33930790.56%
Sanostee CDP32532198.77%
Pueblo Pintado CDP32130695.33%
Tesuque Pueblo CDP31628690.51%
Crystal CDP30729696.42%
Becenti CDP29529499.66%
Torreon CDP29226289.73%
Brimhall Nizhoni CDP28728398.61%
Nageezi CDP27927698.92%
Naschitti CDP27326295.97%
Sheep Springs CDP27026297.04%
Beclabito CDP26726097.38%
Haystack CDP23423098.29%
Ojo Encino CDP23020790.00%
Encinal CDP21220295.28%
Continental Divide CDP19410252.58%
Purty Rock CDP18411562.50%
Chical CDP13511484.44%
South Acomita Village CDP13212796.21%
Borrego Pass CDP12011595.83%
Pueblito CDP1007272.00%
Picuris Pueblo CDP967578.13%
Lake Valley CDP785266.67%
Manuelito CDP725880.56%
Anzac Village CDP686798.53%
Mountain View CDP595491.53%
Red Rock Ranch CDP392358.97%
Black Hat CDP121191.67%

New York

PlaceTypeTotal PopulationNative PopulationPercent Native
Akwesasne CDP4695393283.75%

North Carolina

PlaceTypeTotal PopulationNative PopulationPercent Native
Pembroke town3038198765.40%
Cherokee CDP2389185277.52%
Prospect CDP90581890.39%
Hollister CDP67338557.21%
Elrod CDP40030075.00%
Raemon CDP21514567.44%
Wakulla CDP1189782.20%

North Dakota

PlaceTypeTotal PopulationNative PopulationPercent Native
New Town city3022203167.21%
Belcourt CDP1547137388.75%
Fort Totten CDP1184113896.11%
Shell Valley CDP1176112095.24%
Parshall city104061358.94%
Cannon Ball CDP90482991.70%
Mandaree CDP72665590.22%
Dunseith city65855584.35%
Green Acres CDP62559394.88%
Four Bears Village CDP53046587.74%
East Dunseith CDP51048795.49%
White Shield CDP38933485.86%
St. John city34124672.14%
Porcupine CDP20419093.14%
Fort Yates city18216791.76%
Selfridge city1309573.08%
Oberon city1266450.79%
Solen city744256.76%
Warwick city613150.82%

Oklahoma

PlaceTypeTotal PopulationNative PopulationPercent Native
Anadarko city6685337450.47%
Stilwell city4161236456.81%
Briggs CDP116360652.11%
Kenwood CDP97757759.06%
Moodys CDP96148350.26%
Kansas town80145256.43%
Cherry Tree CDP78359575.99%
Fairfield CDP72741757.36%
Lyons Switch CDP59333255.99%
White Eagle CDP53541677.76%
Rocky Mountain CDP51729757.45%
Eldon CDP41320750.12%
Barber CDP36818851.09%
Twin Oaks CDP36620255.19%
Tonkawa Tribal Housing CDP35427377.12%
Wauhillau CDP34020359.71%
Rocky Ford CDP31718558.36%
Nicut CDP30917155.34%
Oaks town30020167.00%
Titanic CDP28516256.84%
Greasy CDP28116659.07%
Red Rock town27620574.28%
Proctor CDP21211252.83%
Bell CDP21115975.36%
Marble City town21111956.40%
Oak Hill-Piney CDP20912157.89%
Pumpkin Hollow CDP1949951.03%
Honey Hill CDP1919750.79%
Pinhook Corner CDP1648350.61%
Mulberry CDP1096862.39%
Johnson Prairie CDP1065450.94%
Marietta CDP985051.02%
Flute Springs CDP976263.92%
Etta CDP955456.84%
Cave Spring CDP844857.14%
Bull Hollow CDP625283.87%
Connerville CDP613455.74%
Zion CDP362261.11%
Old Eucha CDP291862.07%
Bryant CDP191052.63%
Brush Creek CDP171058.82%

Oregon

PlaceTypeTotal PopulationNative PopulationPercent Native
Warm Springs CDP2578235891.47%
Mission CDP104479776.34%
Chiloquin city83946255.07%
Kirkpatrick CDP1739554.91%
Cayuse CDP754458.67%
Beatty CDP633250.79%

South Dakota

PlaceTypeTotal PopulationNative PopulationPercent Native
Pine Ridge CDP3198303895.00%
Sisseton city2680149655.82%
North Eagle Butte CDP1927182794.81%
Rosebud CDP1481139894.40%
Eagle Butte city1324115387.08%
Oglala CDP1319124294.16%
Fort Thompson CDP1263117693.11%
Mission city1205101784.40%
Martin city108257152.77%
Kyle CDP96390393.77%
Porcupine CDP93291698.28%
Antelope CDP84982396.94%
Agency Village CDP81874991.56%
Lake Andes city78139951.09%
Lower Brule CDP72668694.49%
Wanblee CDP68864794.04%
Marty CDP68065796.62%
Parmelee CDP60760299.18%
McLaughlin city60342870.98%
White River city59632153.86%
Manderson-White Horse Creek CDP56354897.34%
Timber Lake city56132858.47%
West Brule CDP54553798.53%
Dupree city50642283.40%
St. Francis town48345293.58%
Allen CDP46145598.70%
Little Eagle CDP37236197.04%
Wounded Knee CDP36436399.73%
Enemy Swim CDP31526283.17%
Bullhead CDP31330396.81%
Cherry Creek CDP29324984.98%
Long Hollow CDP28823581.60%
Sicangu Village CDP28827394.79%
Two Strike CDP28627997.55%
Wakpala CDP27726294.58%
White Horse CDP24223095.04%
Spring Creek CDP24023597.92%
Soldier Creek CDP21020497.14%
Horse Creek CDP19318595.85%
Peever town19313067.36%
Okreek CDP19117189.53%
La Plant CDP17416192.53%
Norris CDP15314594.77%
Kenel CDP13212796.21%
Peever Flats CDP13112696.18%
Corn Creek CDP12210787.70%
Swift Bird CDP11911697.48%
Whitehorse CDP10910192.66%
Batesland town1079588.79%
Ideal CDP928592.39%
Stephan CDP765977.63%
Ravinia town744358.11%
Bridger CDP524688.46%
Lantry CDP352777.14%
Green Grass CDP221881.82%

Utah

PlaceTypeTotal PopulationNative PopulationPercent Native
Oljato-Monument Valley CDP71563789.09%
Fort Duchesne CDP58450285.96%
Navajo Mountain CDP45935677.56%
Aneth CDP43841895.43%
Montezuma Creek CDP29728094.28%
Halchita CDP27527098.18%
Whiterocks CDP22420390.63%
Randlett CDP19716081.22%
White Mesa CDP18016893.33%
Tselakai Dezza CDP989596.94%

Washington

PlaceTypeTotal PopulationNative PopulationPercent Native
Coulee Dam town131666750.68%
Port Gamble Tribal Community CDP109766160.26%
Neah Bay CDP105681777.37%
White Swan CDP86067378.26%
Taholah CDP79672691.21%
Nisqually Indian Community CDP74146162.21%
North Omak CDP73048566.44%
Skokomish CDP68249873.02%
Inchelium CDP44637183.18%
Qui-nai-elt Village CDP33329287.69%
Nespelem Community CDP30726586.32%
Elmer City town25514255.69%
Keller CDP25319075.10%
Nespelem town19717488.32%
Queets CDP15612982.69%
Santiago CDP573866.67%
Disautel CDP483777.08%

Wisconsin

PlaceTypeTotal PopulationNative PopulationPercent Native
Lac du Flambeau CDP1931162083.89%
Legend Lake CDP1740123871.15%
Little Round Lake CDP1332112784.61%
Keshena CDP1274121895.60%
Neopit CDP62560396.48%
Chief Lake CDP61844872.49%
Mole Lake CDP58443875.00%
New Odanah CDP47344894.71%
Reserve CDP36629680.87%
New Post CDP32518958.15%
Mission CDP32027585.94%
Birch Hill CDP30827990.58%
Middle Village CDP30527590.16%
Sand Pillow CDP28323884.10%
Franks Field CDP17414885.06%
Zoar CDP10910192.66%
Paac Ciinak CDP997171.72%
Ceex Haci CDP938086.02%
Diaperville CDP676698.51%
Odanah CDP494489.80%

Wyoming

PlaceTypeTotal PopulationNative PopulationPercent Native
Fort Washakie CDP1714154490.08%
Arapahoe CDP1698133778.74%
Ethete CDP1461132290.49%
Boulder Flats CDP49334569.98%

See also

Related Research Articles

<span class="mw-page-title-main">Sacramento County, California</span> County in California, United States

Sacramento County is a county located in the U.S. state of California. As of the 2020 census, the population was 1,585,055. Its county seat is Sacramento, which has been the state capital of California since 1854.

<span class="mw-page-title-main">Demographics of the United States</span>

The United States had an official estimated resident population of 334,914,895 on July 1, 2023, according to the U.S. Census Bureau. This figure includes the 50 states and the District of Columbia but excludes the population of five unincorporated U.S. territories as well as several minor island possessions. The United States is the third most populous country in the world. The Census Bureau showed a population increase of 0.4% for the twelve-month period ending in July 2022, below the world average annual rate of 0.9%. The total fertility rate in the United States estimated for 2022 is 1.665 children per woman, which is below the replacement fertility rate of approximately 2.1.

<span class="mw-page-title-main">Yolo County, California</span> County in California, United States

Yolo County, officially the County of Yolo, is a county located in the northern portion of the U.S. state of California. Yolo County was one of the original counties of California, created in 1850 at the time of statehood. As of the 2020 census, the population was 216,403. Its county seat is Woodland.

<span class="mw-page-title-main">Del Norte County, California</span> County in California, United States

Del Norte County is a county at the far northwest corner of the U.S. state of California, along the Pacific Ocean adjacent to the Oregon border. Its population is 27,743 as of the 2020 census, down from 28,610 from the 2010 census. The county seat and only incorporated city is Crescent City. Del Norte was pioneered and populated by Azorean Portuguese settlers and dairy farmers, which may account for the local pronunciation of the county name. Locals pronounce the county name as Del Nort, not Del Nor-teh as would be expected in Spanish.

<span class="mw-page-title-main">Madera County, California</span> County in California, United States

Madera County, officially the County of Madera, is a county at the geographic center of the U.S. state of California. As of the 2020 census, the population was 156,255. The county seat is Madera.

<span class="mw-page-title-main">Merced County, California</span> County in California, United States

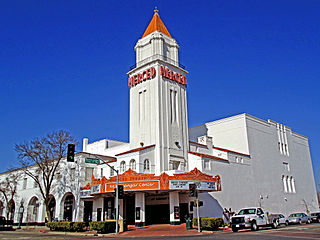
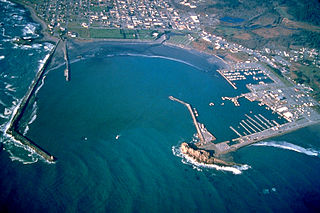
Merced County, is a county located in the northern San Joaquin Valley section of the Central Valley, in the U.S. state of California.

<span class="mw-page-title-main">San Luis Obispo County, California</span> County in California, United States

San Luis Obispo County, officially the County of San Luis Obispo, is a county on the Central Coast of California. As of the 2020 census, the population was 282,424. The county seat is San Luis Obispo.

<span class="mw-page-title-main">Stanislaus County, California</span> County in California, United States

Stanislaus County is a county located in the San Joaquin Valley of the U.S. state of California. As of 2023, its estimated population is 564,404. The county seat is Modesto.

<span class="mw-page-title-main">Sutter County, California</span> County in California, United States

Sutter County is a county located in the U.S. state of California. As of the 2020 census, the population was 99,633. The county seat is Yuba City. Sutter County is included in the Yuba City, CA Metropolitan Statistical Area as well as the Sacramento-Roseville, CA Combined Statistical Area. The county is located along the Sacramento River in the Sacramento Valley.

<span class="mw-page-title-main">Tehama County, California</span> County in California, United States

Tehama County is a county located in the northern part of the U.S. state of California. As of the 2020 census, the population was 65,829. The county seat and largest city is Red Bluff.

<span class="mw-page-title-main">Yuba County, California</span> County in California, United States

Yuba County is located in north-central Central Valley, California, United States. As of the 2020 U.S. Census, its population was 81,575. Yuba County is included in the Yuba City metropolitan statistical area, which is also included in the Sacramento–Roseville combined statistical area. The county is in the Central Valley region along the Feather River; the county seat is Marysville.

<span class="mw-page-title-main">Aleutians West Census Area, Alaska</span> Census area in Alaska, United States

Aleutians West Census Area is a census area located in the U.S. state of Alaska. As of the 2020 census, the population was 5,232, down from 5,561 in 2010.

<span class="mw-page-title-main">Glacier County, Montana</span> County in Montana, United States

Glacier County is located in the U.S. state of Montana. As of the 2020 census, the population was 13,778. The county is located in northwestern Montana between the Great Plains and the Rocky Mountains, known to the Blackfeet as the "Backbone of the World". The county is geographically and culturally diverse and includes the Blackfeet Indian Reservation, Glacier National Park, and Lewis and Clark National Forest. The county is bordered by 75 miles of international boundary with two ports of entry open year-round and one seasonal international border crossing into Alberta, Canada.

The following are links to lists of United States cities in which a majority of the population is not white organized by majority racial group. The US census officially recognizes six racial categories: White American, Black or African American, Native American and Alaska Native, Asian American, Native Hawaiian and Other Pacific Islander, and people of two or more races. It should not, however, be inferred that every city not on one of the lists below has a white majority.

<span class="mw-page-title-main">Race and ethnicity in the United States</span>

The United States has a racially and ethnically diverse population. At the federal level, race and ethnicity have been categorized separately. The most recent United States census recognized five racial categories, as well as people who belong to two or more of the racial categories. The United States also recognizes the broader notion of ethnicity. The 2000 census and 2010 American Community Survey inquired about the "ancestry" of residents, while the 2020 census allowed people to enter their "origins". The Census Bureau also classified respondents as either Hispanic or Latino, identifying as an ethnicity, which comprises the minority group in the nation.

Pacific Islander Americans are Americans who are of Pacific Islander ancestry. For its purposes, the United States census also counts Aboriginal Australians as part of this group.

<span class="mw-page-title-main">Demographics of California</span>

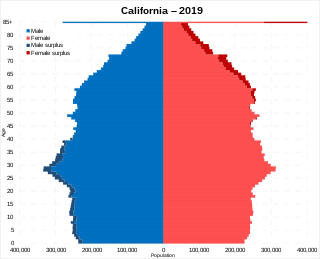
California is the most populated U.S. state, with an estimated population of 38.9 million as of 2023. It has people from a wide variety of ethnic, racial, national, and religious backgrounds.

According to the U.S. Census Bureau, as of 2023, Texas was the second largest state in population after California, with a population of 30,503,301, an increase of more than 1.3 million people, or 4.7%, since the 29,145,505 of the 2020 census. Its apportioned population in 2020 was 29,183,290. Since the beginning of the 21st century, the state of Texas has experienced strong population growth. Texas has many major cities and metropolitan areas, along with many towns and rural areas. Much of the population is concentrated in the major cities of Dallas–Fort Worth, Austin, San Antonio, Houston, McAllen, and El Paso and their corresponding metropolitan areas. The first four aforementioned main urban centers are also referred to as the Texas Triangle megaregion.

References