Stock option return calculations provide investors with an easy metric for comparing stock option positions. For example, for two stock option positions which appear identical, the potential stock option return may be useful for determining which position has the highest relative potential return.
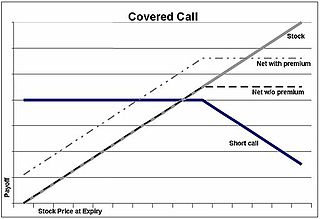
A covered call position is a neutral-to-bullish investment strategy and consists of purchasing a stock and selling a call option against the stock. Two useful return calculations for covered calls are the %If Unchanged Return and the %If Assigned Return. The %If Unchanged Return calculation determines the potential return assuming a covered call position's stock price at option expiration is the same as at initial purchase. The %If Assigned Return calculation assumes the price of the stock is equal to or greater than the strike price of the sold call option. For in-the-money (see moneyness) covered calls, the calculations for %If Unchanged Return and the %If Assigned Return will be equal. Example calculations for %If Unchanged potential return and %If Assigned Return for covered calls are shown below:
Covered Call Cash Flow In-The-Money
Activity
Cash Flow
Purchase XYZ Stock
$(51.00)
Sell call option XYZOPT strike price $50
$ 3.00
Assuming stock price is greater than $50 at expiration and stock is called away
The Bull Put Credit Spread (see bull spread) is a bullish strategy and consists of selling a put option and purchasing a put option for the same stock or index at differing strike prices for the same expiration. The purchased put option is entered at a strike price lower than the strike price of the sold put option. The return calculation for the Bull-Put Credit Spread position assuming price of the stock or index at expiration is greater than the sold put is shown below:
Bull Put Credit Spread Potential Return = (sold put price - purchased put price)/(sold put strike price - purchased put strike price - initial credit)
For example, suppose a put option with a strike price of $100 for ABC stock is sold at $1.00 and a put option for ABC with a strike price of $90 is purchased for $0.50, and at the option's expiration the price of the stock or index is greater than the short put strike price of $100, then the return generated for this position is:
The Bear Call Credit Spread (see bear spread) is a bearish strategy and consists of selling a call option and purchasing a call option for the same stock or index at differing strike prices for the same expiration. The purchased call option is entered at a strike price higher than the strike price of the sold call option. The return calculation for the Bear Call Credit Spread position assuming price of the stock or index at expiration is less than the sold call is shown below:
For example, suppose a call option with a strike price of $100 for DEF stock is sold at $1.00 and a call option for DEF with a strike price of $110 is purchased for $0.50, and at the option's expiration the price of the stock or index is less than the short call strike price of $100, then the return generated for this position is:
The iron condor is a neutral strategy and consists of a combination of a bull put credit spread and a bear call credit spread (see above). Ideally, the margin for the Iron Condor is the maximum of the bull put and bear call spreads, but some brokers require a cumulative margin for the bull put and the bear call. The return calculation for the Iron Condor position using the maximum margin of the bull put credit spread and the bear call credit spread and assuming price of the stock or index at expiration is greater than the sold put option and less than the sold call option is shown below:
Iron Condor Potential Return = (bull put net credit + bear call net credit)/{max[(purchased call strike price - sold call strike price), (sold put strike price - purchased put strike price)] - initial credits}
For example, for the bear put portion of the iron condor a put option with a strike price of $90 for GHI stock is sold at $1.00 and a put option for GHI with a strike price of $80 is purchased for $0.50. And, suppose for the bear call portion of the iron condor a call option with a strike price of $100 for GHI stock is sold at $1.00 and a call option for GHI with a strike price of $110 is purchased for $0.50, and at the option's expiration the price of the stock or index is greater than the short put strike price of $90 and less than the short call strike price of $100. The return generated for this position is:
The collar (finance) is a neutral-to-bullish strategy and consists of a combination of a covered call (see above) and a long put option for protection. The protective put provides insurance to guarantee a floor on the potential loss, but the protective put option also reduces the amount of potential return. The collar is useful for reducing or delaying taxes for large stock positions which otherwise would need to be sold in order to diversify, reduce risk, etc. The following calculation assumes the sold call option and the purchased put option are both out-of-the-money and the price of the stock at expiration is the same as at entry:
For example, for stock JKH purchased at $52.5, a call option sold for $2.00 with a strike price of $55 and a put option purchased for $0.50 with a strike price of $50, the %If Unchanged Return for the collar would be:
The break-even point is the stock purchase price minus the net of the call option price and the put option price.
Break-even = $52.5 - ($2.00 - $0.50) = $51.00
As long as the price of the JKH stock is greater than $51 at stock option expiration, the position will be profitable.
The percent maximum loss is the difference between the break-even price and the strike price of the purchased put option divided by the net investment, for example for JKH:
%Max loss = (51 - 50)/[52.5-(2-0.5)] = 2%
Naked put return
The naked put is a neutral-to-bullish strategy and consists of selling a put option against a stock. The naked put profit/loss profile is similar to the covered call (see above) profit/loss profile. The naked put generally requires less in brokerage fees and commissions than the covered call. The following return calculation assumes the sold put option is out-of-the-money and the price of the stock at expiration is greater than the put strike price at option expiration:
Naked Put Potential Return = (put option price) / (stock strike price - put option price)
For example, for a put option sold for $2 with a strike price of $50 against stock LMN the potential return for the naked put would be:
Naked Put Potential Return = 2/(50.0-2)= 4.2%
The break-even point is the stock strike price minus the put option price.
Break-even = $50 – $2.00 = $48.00
As long as the price of the LMN stock is greater than $48 at stock option expiration, the position will be profitable. Below a LMN stock price of $48, the position is unprofitable.
Calendar call return
The calendar call spread (see calendar spread) is a bullish strategy and consists of selling a call option with a shorter expiration against a purchased call option with an expiration further out in time. The calendar call spread is basically a leveraged version of the covered call (see above), but purchasing long call options instead of purchasing stock.
% Assigned Return = (long call value - net debit) / (net debit)
% Unchanged Return = [long call value (at short-term exp. w/ current stock price) - net debit] / (net debit)
For example, consider stock OPQ at $49.31 per share. Buy JAN 1 Year Out 40 strike call for $13.70 and write (Sell) the Near Month 55 strike call for $0.80
The long straddle (see straddle) is a bullish and a bearish strategy and consists of purchasing a put option and a call option with the same strike prices and expiration. The long straddle is profitable if the underlying stock or index makes a movement upward or downward offsetting the initial combined purchase price of the options. A long straddle becomes profitable if the stock or index moves more than the combined purchase prices of the options away from the strike price of the options.
% Return = ( |stock price @ expiration - strike price| - (long call price + long put price)] / (long call price + long put price)
For example, for stock RST and a long straddle consisting of a purchased call option with a price of $1.50 and a purchased put option with a price of $2.00 with a strike price of $50. Assume the initial price of RST is $50, and at option expiration, the price of RST is $55.
The iron butterfly is a neutral strategy and consists of a combination of a bull put credit spread and a bear call credit spread (see above). The iron butterfly is a special case of an iron condor (see above) where the strike price for the bull put credit spread and the bear call credit spread are the same. Ideally, the margin for the iron butterfly is the maximum of the bull put and bear call spreads, but some brokers require a cumulative margin for the bull put and the bear call. The maximum return generated for the iron butterfly is when the stock price is the same as when the position was entered. The return calculation for the iron butterfly position using the maximum margin of the bull put credit spread and the bear call credit spread and assuming price of the stock or index at expiration is the same as when the position was entered is shown below:
Iron Butterfly Potential Return = (bull put net credit + bear call net credit)/{max[(purchased call strike price - sold call strike price), (sold put strike price - purchased put strike price)] - initial credits}
For example, for UVW stock with a stock price of $100, and for the bear put portion of the iron butterfly a put option with a strike price of $100 is sold at $3.00 and a put option for UVW with a strike price of $90 is purchased for $1.00. And, suppose for the bear call portion of the iron butterfly a call option with a strike price of $100 for GHI stock is sold at $3.00 and a call option for UVW with a strike price of $110 is purchased for $1.00, and at the option's expiration the price of the stock or index is the same as when entered. The return generated for this position is:
Iron Butterflies have higher returns than iron condors, but the stock price range where the iron butterfly position is profitable is much less than for the iron condor.
Married put return
The married put (also known as a protective put) is a bullish strategy and consists of the purchase of a long stock and a long put option. The married put has limited downside risk provided by the purchased put option and a potential return which is infinite.
Calculations for the Married Put Strategy are:
Net Debit = Stock Price + Put Ask Price Break Even = Net Debit Maximum Risk = Net Debit - Put Strike Price % Max Risk = Maximum Risk / Net Debit Maximum Profit = Unlimited
Example 1: Stock XYZ at $49.90 per share Buy 100 shares stock XYZ at $49.90 Buy 1 contract 55 strike Put (ITM) for $6.10
Net Debit = $49.90 + $6.10 = $56.00 Break Even = $56.00 Maximum Risk = $56.00 - $55.00 = $1.00 % Max Risk = $1.00 / $56.00 = 1.8%
Related Research Articles
In finance, a put or put option is a financial market derivative instrument that gives the holder the right to sell an asset, at a specified price, by a specified date to the writer of the put. The purchase of a put option is interpreted as a negative sentiment about the future value of the underlying stock. The term "put" comes from the fact that the owner has the right to "put up for sale" the stock or index.
In finance, a straddle strategy refers to two transactions that share the same security, with positions that offset one another. One holds long risk, the other short. As a result, it involves the purchase or sale of particular option derivatives that allow the holder to profit based on how much the price of the underlying security moves, regardless of the direction of price movement.
In finance, a butterfly is a limited risk, non-directional options strategy that is designed to have a high probability of earning a limited profit when the future volatility of the underlying asset is expected to be lower or higher than that asset's current implied volatility.
A covered call is a financial market transaction in which the seller of call options owns the corresponding amount of the underlying instrument, such as shares of a stock or other securities. If a trader buys the underlying instrument at the same time the trader sells the call, the strategy is often called a "buy-write" strategy. In equilibrium, the strategy has the same payoffs as buying a put option.
In options trading, a box spread is a combination of positions that has a certain payoff, considered to be simply "delta neutral interest rate position". For example, a bull spread constructed from calls combined with a bear spread constructed from puts has a constant payoff of the difference in exercise prices assuming that the underlying stock does not go ex-dividend before the expiration of the options. If the underlying asset has a dividend of X, then the settled value of the box will be 10 + x. Under the no-arbitrage assumption, the net premium paid out to acquire this position should be equal to the present value of the payoff.
In finance, a calendar spread is a spread trade involving the simultaneous purchase of futures or options expiring on a particular date and the sale of the same instrument expiring on another date. These individual purchases, known as the legs of the spread, vary only in expiration date; they are based on the same underlying market and strike price.
The iron condor is an option trading strategy utilizing two vertical spreads – a put spread and a call spread with the same expiration and four different strikes. A long iron condor is essentially selling both sides of the underlying instrument by simultaneously shorting the same number of calls and puts, then covering each position with the purchase of further out of the money call(s) and put(s) respectively. The converse produces a short iron condor.
In finance, a debit spread, a.k.a. net debit spread, results when an investor simultaneously buys an option with a higher premium and sells an option with a lower premium. The investor is said to be a net buyer and expects the premiums of the two options to widen.
In options trading, a bull spread is a bullish, vertical spread options strategy that is designed to profit from a moderate rise in the price of the underlying security.
In options trading, a bear spread is a bearish, vertical spread options strategy that can be used when the options trader is moderately bearish on the underlying security.
In options trading, a vertical spread is an options strategy involving buying and selling of multiple options of the same underlying security, same expiration date, but at different strike prices. They can be created with either all calls or all puts. The term originates from the trading sheets that were used in the open outcry pits on which option prices were listed out by expiry date & strike price, thus looking down the sheet (vertical) the trader would see all options of the same maturity. Vertical spreads can sometimes approximate binary options, and can be produced using vanilla options.
In finance an iron butterfly, also known as the ironfly, is the name of an advanced, neutral-outlook, options trading strategy that involves buying and holding four different options at three different strike prices. It is a limited-risk, limited-profit trading strategy that is structured for a larger probability of earning smaller limited profit when the underlying stock is perceived to have a low volatility.
Option strategies are the simultaneous, and often mixed, buying or selling of one or more options that differ in one or more of the options' variables. Call options, simply known as Calls, give the buyer a right to buy a particular stock at that option's strike price. Opposite to that are Put options, simply known as Puts, which give the buyer the right to sell a particular stock at the option's strike price. This is often done to gain exposure to a specific type of opportunity or risk while eliminating other risks as part of a trading strategy. A very straightforward strategy might simply be the buying or selling of a single option; however, option strategies often refer to a combination of simultaneous buying and or selling of options.
Options spreads are the basic building blocks of many options trading strategies. A spread position is entered by buying and selling equal number of options of the same class on the same underlying security but with different strike prices or expiration dates. An option spread shouldn't be confused with a spread option. The three main classes of spreads are the horizontal spread, the vertical spread and the diagonal spread. They are grouped by the relationships between the strike price and expiration dates of the options involved -
The backspread is the converse strategy to the ratio spread and is also known as reverse ratio spread. Using calls, a bullish strategy known as the call backspread can be constructed and with puts, a strategy known as the put backspread can be constructed.
Pin risk occurs when the market price of the underlier of an option contract at the time of the contract's expiration is close to the option's strike price. In this situation, the underlier is said to have pinned. The risk to the writer (seller) of the option is that they cannot predict with certainty whether the option will be exercised or not. So the writer cannot hedge his position precisely and may end up with a loss or gain. There is a chance that the price of the underlier may move adversely, resulting in an unanticipated loss to the writer. In other words, an option position may result in a large, undesired risky position in the underlier immediately after expiration, regardless of the actions of the writer.
In finance, an option is a contract which conveys its owner, the holder, the right, but not the obligation, to buy or sell an underlying asset or instrument at a specified strike price prior to or on a specified date, depending on the style of the option. Options are typically acquired by purchase, as a form of compensation, or as part of a complex financial transaction. Thus, they are also a form of asset and have a valuation that may depend on a complex relationship between underlying asset value, time until expiration, market volatility, and other factors. Options may be traded between private parties in over-the-counter (OTC) transactions, or they may be exchange-traded in live, orderly markets in the form of standardized contracts.
In finance, a credit spread, or net credit spread is an options strategy that involves a purchase of one option and a sale of another option in the same class and expiration but different strike prices. It is designed to make a profit when the spreads between the two options narrows.
In finance, a strangle is a trading strategy involving the purchase or sale of particular option derivatives that allows the holder to profit based on how much the price of the underlying security moves, with relatively minimal exposure to the direction of price movement. A purchase of particular options is known as a long strangle, while a sale of the same options is known as a short strangle. As an options position strangle is a variation of a more generic straddle position. Strangle's key difference from a straddle is in giving investor choice of balancing cost of opening a strangle versus a probability of profit. For example, given the same underlying security, strangle positions can be constructed with low cost and low probability of profit. Low cost is relative and comparable to a cost of straddle on the same underlying. Strangles can be used with equity options, index options or options on futures.
In options trading, a jade lizard is a custom option strategy which consists of a bear vertical spread created using call options, with the addition of a put option sold at a strike price lower than the strike prices of the call spread. For one underlying security, same expiration date, this strategy consists of buying a call option at one strike price, selling another call option at a lower strike price, then selling an OTM put option at a strike price lower than that of both call options. The addition of the sale of a put option is consistent with the expected move of the underlying and results in additional premium collected. The jade lizard strategy takes advantage of the volatility skew inherently priced into options with naked puts trading richer in premium than naked calls and short call spreads trading richer in premium than short put spreads. This volatility skew effect allows the trader to collect more premium for the overall position and thus, increasing the position's probability of profit. The term "jade lizard" was first used by former CBOE floor traders, Liz Dierking and Jenny Andrews, on the Liz & Jny Show on the Tastytrade Network.
References
Zerenner, Ernie and Greg Zerenner, Covered Calls - Aggressive Strategy for the Conservative Investor, 1st edition, Power Financial Group, 2005, pp.107–108. ISBN978-0-9759093-0-0
This page is based on this Wikipedia article Text is available under the CC BY-SA 4.0 license; additional terms may apply. Images, videos and audio are available under their respective licenses.