| Member | Party | Dates | Cong
ress(es) | Electoral history | Counties |
|---|
| District created March 4, 1865 |
Donald C. McRuer
(San Francisco) | Republican | March 4, 1865 –
March 3, 1867 | 39th | Elected in 1864.
Retired. | 1865–1873
Fresno, Inyo, Kern, Los Angeles, Mariposa, Merced, Monterey, San Diego, San Francisco, San Luis Obispo, San Mateo, Santa Barbara, Santa Clara, Santa Cruz, Stanislaus, Tulare |

Samuel Beach Axtell
(San Francisco) | Democratic | March 4, 1867 –
March 3, 1871 | 40th
41st | Elected in 1867.
Re-elected in 1868.
Retired. |

Sherman Otis Houghton
(San Jose) | Republican | March 4, 1871 –
March 3, 1873 | 42nd | Elected in 1871.
Redistricted to the 4th district . |

Charles Clayton
(San Francisco) | Republican | March 4, 1873 –
March 3, 1875 | 43rd | Elected in 1872.
Retired. | 1873–1885
San Francisco |

William Adam Piper
(San Francisco) | Democratic | March 4, 1875 –
March 3, 1877 | 44th | Elected in 1875.
Lost re-election. |

Horace Davis
(San Francisco) | Republican | March 4, 1877 –
March 3, 1881 | 45th
46th | Elected in 1876.
Re-elected in 1879.
Lost re-election. |
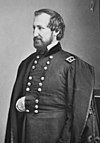
William Rosecrans
(San Francisco) | Democratic | March 4, 1881 –
March 3, 1885 | 47th
48th | Elected in 1880.
Re-elected in 1882.
Retired. |

Barclay Henley
(Santa Rosa) | Democratic | March 4, 1885 –
March 3, 1887 | 49th | Redistricted from the 3rd district and re-elected in 1884.
Retired. | 1885–1895
Colusa, Del Norte, Humboldt, Lake, Lassen, Mendocino, Modoc, Napa, Plumas, Shasta, Sierra, Siskiyou, Sonoma, Tehama, Trinity |

Thomas L. Thompson
(Santa Rosa) | Democratic | March 4, 1887 –
March 3, 1889 | 50th | Elected in 1886.
Lost re-election. |
John J. De Haven
(Eureka) | Republican | March 4, 1889 –
October 1, 1890 | 51st | Elected in 1888.
Resigned to become associate justice of the California Supreme Court. |
| Vacant | October 1, 1890 –
December 9, 1890 |

Thomas J. Geary
(Santa Rosa) | Democratic | December 9, 1890 –
March 3, 1895 | 51st
52nd
53rd | Elected to finish De Haven's term.
Re-elected in 1890.
Re-elected in 1892.
Redistricted to the 2nd district . |
John All Barham
(Santa Rosa) | Republican | March 4, 1895 –
March 3, 1901 | 54th
55th
56th | Elected in 1894.
Re-elected in 1896.
Re-elected in 1898.
Retired. | 1895–1903
Del Norte, Humboldt, Lassen, Marin, Mendocino, Modoc, Napa, Plumas, Shasta, Sierra, Siskiyou, Sonoma, Tehama, Trinity |
Frank Coombs
(Napa) | Republican | March 4, 1901 –
March 3, 1903 | 57th | Elected in 1900.
Lost re-election. |

James Gillett
(Eureka) | Republican | March 4, 1903 –
November 4, 1906 | 58th
59th | Elected in 1902.
Re-elected in 1904.
Resigned when elected Governor. | 1903–1913
Alpine, Amador, Calaveras, Del Norte, El Dorado, Humboldt, Lassen, Mariposa, Modoc, Mono, Nevada, Placer, Plumas, Shasta, Sierra, Siskiyou, Tehama, Trinity, Tuolumne |
| Vacant | November 4, 1906 –
November 6, 1906 | 59th |

William F. Englebright
(Nevada City) | Republican | November 6, 1906 –
March 3, 1911 | 59th
60th
61st | Elected to finish Gillett's term.
Also elected the same day in 1906 to the next term.
Re-elected in 1908.
Lost re-election. |
John E. Raker
(Alturas) | Democratic | March 4, 1911 –
March 3, 1913 | 62nd | Elected in 1910.
Redistricted to the 2nd district . |
William Kent
(Kentfield) | Independent | March 4, 1913 –
March 3, 1917 | 63rd
64th | Redistricted from the 2nd district and re-elected in 1912.
Re-elected in 1914.
Retired. | 1943–1953
Butte, Colusa, Del Norte, Glenn, Humboldt, Lake, Marin, Mendocino, Sonoma, Sutter, Yuba |

Clarence F. Lea
(Santa Rosa) | Democratic | March 4, 1917 –
January 3, 1949 | 65th
66th
67th
68th
69th
70th
71st
72nd
73rd
74th
75th
76th
77th
78th
79th
80th | Elected in 1916.
Re-elected in 1918.
Re-elected in 1920.
Re-elected in 1922.
Re-elected in 1924.
Re-elected in 1926.
Re-elected in 1928.
Re-elected in 1930.
Re-elected in 1932.
Re-elected in 1934.
Re-elected in 1936.
Re-elected in 1938.
Re-elected in 1940.
Re-elected in 1942.
Re-elected in 1944.
Re-elected in 1946.
Retired. |

Hubert B. Scudder
(Sebastopol) | Republican | January 3, 1949 –
January 3, 1959 | 81st
82nd
83rd
84th
85th | Elected in 1948.
Re-elected in 1950.
Re-elected in 1952.
Re-elected in 1954.
Re-elected in 1956.
Retired. |
1953–1963
Del Norte, Humboldt, Lake, Marin, Mendocino, Napa, Sonoma |

Clement Woodnutt Miller
(Corte Madera) | Democratic | January 3, 1959 –
October 7, 1962 | 86th
87th | Elected in 1958.
Re-elected in 1960.
Died.
Re-elected posthumously in 1962. |
| Vacant | October 7, 1962 –
January 22, 1963 | 87th
88th | |
1963–1967
Del Norte, Humboldt, Marin, Mendocino, Napa, Sonoma |

Donald H. Clausen
(Crescent City) | Republican | January 22, 1963 –
January 3, 1975 | 88th
89th
90th
91st
92nd
93rd | Elected to finish Miller's term.
Re-elected in 1964.
Re-elected in 1966.
Re-elected in 1968.
Re-elected in 1970.
Re-elected in 1972.
Redistricted to the 2nd district . |
1967–1973
Del Norte, Humboldt, most of Marin, Mendocino, Napa, Sonoma |
1973–1983
Butte, Glenn, Lassen, Modoc, Nevada, Placer, Plumas, Shasta, Sierra, Siskiyou, Tehama, Trinity, Yuba |

Harold T. Johnson
(Roseville) | Democratic | January 3, 1975 –
January 3, 1981 | 94th
95th
96th | Redistricted from the 2nd district and re-elected in 1974.
Re-elected in 1976.
Re-elected in 1978.
Lost re-election. |
Eugene A. Chappie
(Roseville) | Republican | January 3, 1981 –
January 3, 1983 | 97th | Elected in 1980.
Redistricted to the 2nd district . |
Douglas H. Bosco
(Occidental) | Democratic | January 3, 1983 –
January 3, 1991 | 98th
99th
100th
101st | Elected in 1982.
Re-elected in 1984.
Re-elected in 1986.
Re-elected in 1988.
Lost re-election. | 1983–1993
Del Norte, Humboldt, western Lake, Mendocino, southern Napa, northern Sonoma |

Frank Riggs
(Santa Rosa) | Republican | January 3, 1991 –
January 3, 1993 | 102nd | Elected in 1990.
Lost re-election. |

Daniel Hamburg
(Ukiah) | Democratic | January 3, 1993 –
January 3, 1995 | 103rd | Elected in 1992.
Lost re-election. | 1993–2003
Del Norte, Humboldt, western Lake, Mendocino, Napa, northwestern Solano, northeastern Sonoma |

Frank Riggs
(Windsor) | Republican | January 3, 1995 –
January 3, 1999 | 104th
105th | Elected in 1994.
Re-elected in 1996.
Retired to run for U.S. Senator. |

Mike Thompson
(St. Helena) | Democratic | January 3, 1999 –
January 3, 2013 | 106th
107th
108th
109th
110th
111th
112th | Elected in 1998.
Re-elected in 2000.
Re-elected in 2002.
Re-elected in 2004.
Re-elected in 2006.
Re-elected in 2008.
Re-elected in 2010.
Redistricted to the 5th district . |
2003–2013
Del Norte, Humboldt, Lake, Mendocino, Napa, eastern Sonoma, southern Yolo |
Doug LaMalfa
(Oroville) | Republican | January 3, 2013 –
present | 113th
114th
115th
116th
117th
118th | Elected in 2012.
Re-elected in 2014.
Re-elected in 2016.
Re-elected in 2018.
Re-elected in 2020.
Re-elected in 2022. | 2013–2023

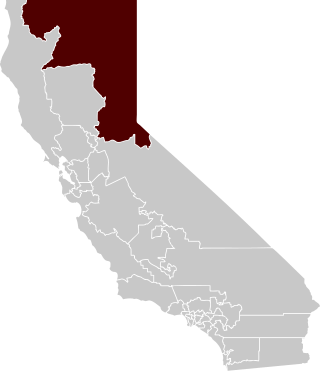
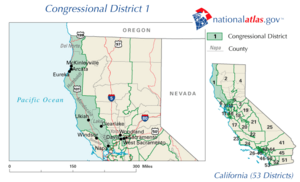
Inland Northern California including Butte, Lassen, Modoc, Plumas, Shasta, Sierra, Siskiyou, and Tehama counties plus portions of Glenn, Nevada, and Placer counties. [4] And including the main hubs of Chico and Redding, in Butte and Shasta Counties respectively. |
2023–present
 |