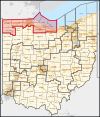
| Year | Democratic | Republican | Other |
|---|
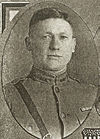
| 1920 | Isaac R. Sherwood: 38,292 |  Y William W. Chalmers (Incumbent): 49,732 Y William W. Chalmers (Incumbent): 49,732 | Karl E. Pauli: 47 |
| 1922 | Y Isaac R. Sherwood : 45,059 | William W. Chalmers (Incumbent): 42,712 | (none) |
| 1924 | Isaac R. Sherwood (Incumbent): 48,482 | Y William W. Chalmers : 54,792 | Millard Price (Prohibition): 2,159
John Kocinski: 747 |
| 1926 | C. W. Davis: 23,947 | Y William W. Chalmers (Incumbent): 47,331 | George F. Parrish (TRI): 1,110
Millard Price (Socialist): 1,018 |
| 1928 | William P. Clarke: 50,601 | Y William W. Chalmers (Incumbent): 82,560 | Charles V. Stephenson (Workers): 190 |
| 1930 | Scott Stahl: 36,375 | Y Wilbur M. White : 49,498 | (none) |
| 1932 | Y Warren J. Duffey : 56,755 | Wilbur M. White (Incumbent): 54,078 | Silas E. Hurin: 4,200
Clyde E. Kiker: 2,135
Karl Pauli (Socialist): 1,314
Eugene Stoll (Communist): 620 |
| 1934 | Y Warren J. Duffey (Incumbent): 61,037 | Frank L. Mulholland: 35,732 | Kenneth Eggert (Communist): 684
Karl Pauli (Socialist): 510 |
| 1936 | Y John F. Hunter : 75,737 | Raymond E. Hildebrand: 55,043 | Earl O. Lehman: 3,739 |
| 1938 | Y John F. Hunter (Incumbent): 56,306 | Homer A. Ramey: 55,441 | (none) |
| 1940 | Y John F. Hunter (Incumbent): 86,956 | Wilbur M. White: 71,927 | (none) |
| 1942 | John F. Hunter (Incumbent): 44,027 | Y Homer A. Ramey : 47,377 | (none) |
| 1944 | John F. Hunter: 77,693 | Y Homer A. Ramey (Incumbent): 82,735 | (none) |
| 1946 | Michael DiSalle: 59,057 | Y Homer A. Ramey (Incumbent): 59,394 | (none) |
| 1948 | Y Thomas H. Burke : 85,409 | Homer A. Ramey (Incumbent): 73,394 | (none) |
| 1950 | Thomas H. Burke (Incumbent): 45,268 | Homer A. Ramey: 43,301 | Y Frazier Reams (Independent): 51,024 |
| 1952 | Thomas H. Burke: 61,047 | Gilmore Flues: 46,989 | Y Frazier Reams (Independent, Incumbent): 74,821 |
| 1954 | Y Thomas L. Ashley : 48,471 | Irving C. Reynolds: 39,933 | Frazier Reams (Independent, Incumbent): 44,656 |
| 1956 | Y Thomas L. Ashley (Incumbent): | Harvey G. Straub: 81,562 | (none) |
| 1958 | Y Thomas L. Ashley (Incumbent): 102,115 | William K. Gernheuser: 63,660 | (none) |
| 1960 | Y Thomas L. Ashley (Incumbent): 108,688 | Howard C. Cook: 82,433 | (none) |
| 1962 | Y Thomas L. Ashley (Incumbent): 86,443 | Martin A. Janis: 64,279 | (none) |
| 1964 | Y Thomas L. Ashley (Incumbent): 109,167 | John O. Celusta: 64,401 | (none) |
| 1966 | Y Thomas L. Ashley (Incumbent): 83,261 | Jane M. Kuebbeler: 53,777 | (none) |
| 1968 | Y Thomas L. Ashley (Incumbent): 85,280 | Ben Marsh: 63,290 | (none) |
| 1970 | Y Thomas L. Ashley (Incumbent): 82,777 | Allen H. Shapiro: 33,947 | (none) |
| 1972 | Y Thomas L. Ashley (Incumbent): 110,450 | Joseph C. Richards: 49,388 | (none) |
| 1974 | Y Thomas L. Ashley (Incumbent): 64,831 | Carty Finkbeiner: 57,892 | (none) |
| 1976 | Y Thomas L. Ashley (Incumbent): 91,040 | Carty Finkbeiner: 73,919 | Edward S. Emery: 1,533
Lynn Galonsky: 1,477 |
| 1978 | Y Thomas L. Ashley (Incumbent): 71,709 | John C. Hoyt: 34,326 | Edward S. Emery: 2,563
Michael James Lewinski: 4,530 |
| 1980 | Thomas L. Ashley (Incumbent): 68,728 | Y Ed Weber : 96,927 | Edward S. Emery: 4,357
Toby Elizabeth Emmerich: 2,411 |
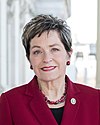
| 1982 | Y Marcy Kaptur : 95,162 | Ed Weber (Incumbent): 64,459 | David Muir (Libertarian): 1,217
Susan A. Skinner: 1,785
James J. Somers: 1,594 |
| 1984 | Y Marcy Kaptur (Incumbent): 117,985 | Frank Venner: 93,210 | Other: 3,714 |
| 1986 | Y Marcy Kaptur (Incumbent): 105,646 | Mike Shufeldt: 30,643 | (none) |
| 1988 | Y Marcy Kaptur (Incumbent): 157,557 | Al Hawkins: 36,183 | (none) |
| 1990 | Y Marcy Kaptur (Incumbent): 117,681 | Jerry D. Lammers: 33,791 | (none) |
| 1992 | Y Marcy Kaptur (Incumbent): 178,879 | Ken D. Brown: 53,011 | Edward Howard: 11,162 |
| 1994 | Y Marcy Kaptur (Incumbent): 118,120 | R. Randy Whitman: 38,665 | (none) |
| 1996 | Y Marcy Kaptur (Incumbent): 170,617 | R. Randy Whitman: 46,040 | Elizabeth A. Slotnick (Natural Law): 4,677 |
| 1998 | Y Marcy Kaptur (Incumbent): 130,793 | Edward S. Emery: 30,312 | (none) |
| 2000 | Y Marcy Kaptur (Incumbent): 168,547 | Dwight E. Bryan: 49,446 | Galen Fries (Libertarian): 4,239
Dennis Slotnick (Natural Law): 3,096 |
| 2002 | Y Marcy Kaptur (Incumbent): 132,236 | Edward S. Emery: 46,481 | (none) |
| 2004 | Y Marcy Kaptur (Incumbent): 199,528 | Larry A. Kaczala: 93,930 | (none) |
| 2006 | Y Marcy Kaptur (Incumbent): 153,880 | Brad Leavitt: 55,119 | (none) |
| 2008 | Y Marcy Kaptur (Incumbent): 210,822 | Brad Leavitt: 73,610 | (none) |
| 2010 | Y Marcy Kaptur (Incumbent): 121,819 | Rich Iott: 83,423 | (none) |
| 2012 | Y Marcy Kaptur (Incumbent): 217,775 | Joe Wurzelbacher: 68,666 | Sean Stipe (Libertarian): 11,725 |
| 2014 [10] | Y Marcy Kaptur (Incumbent): 106,338 | Richard May: 50,792 | Cory Hoffman (Write-in): 112
George A. Skalsky (Write-in): 29 |
| 2016 | Y Marcy Kaptur (Incumbent): 193,966 | Donald P. Larson: 88,427 | George Skalsky (Write-in): 5 |
| 2018 | Y Marcy Kaptur (Incumbent): 157,219 | Steve Kraus: 74,670 | McKenzie Levindofske (Write-in): 48 |
| 2020 | Y Marcy Kaptur (Incumbent): 190,328 | Rob Weber: 111,385 | Other: 39 |
| 2022 | Y Marcy Kaptur (Incumbent): 150,655 | J.R. Majewski: 115,362 | (none) |