Utah's 1st congressional district

Last updated

Utah's 1st congressional district
Utah's 1st congressional district (since 2023).svg
Utah's 1st congressional district
Interactive map of district boundaries since January 3, 2023
Representative
  Blake Moore
RSalt Lake City
Population (2022)850,432
Median household
income
$86,951 [1]
Ethnicity
Cook PVI R+12 [2]

Utah's 1st congressional district serves the northern area of Utah, including the cities of Ogden, Logan, Park City, Layton, Clearfield, Salt Lake City, and the northern half of the Great Salt Lake.

Contents

The current member of the United States House of Representatives from the district is Republican Blake Moore.

President George W. Bush received 73% of the vote in this district in 2004. Scoring a Cook Partisan Voting Index (CPVI) of R+26 in 2004, the 1st Congressional District narrowly beat three other Congressional Districts which scored R+25 to become the most Republican district in the nation. [3]

Recent statewide election results

Results under current lines (since 2023)
YearOfficeResult
2016 President Trump 43.7% - 28.5%
2020 President Trump 57.0% - 37.6%
Results under old lines (2013-2023) [4] [5]
Results under old lines (2003-2013) [6]

List of members representing the district

Until 1913, the district was the only district, elected statewide At-large.

District borders are periodically redrawn and some district residences may no longer be in this district.

MemberPartyYearsCong
ress
Electoral historyLocation
District established March 4, 1913
JosephHowell (cropped).jpg
Joseph Howell
(Logan)
Republican March 4, 1913 –
March 3, 1917
63rd
64th
Redistricted from the at-large district and re-elected in 1912.
Re-elected in 1914.
Retired.
MiltonHWelling (cropped).jpg
Milton H. Welling
(Fielding)
Democratic March 4, 1917 –
March 3, 1921
65th
66th
Elected in 1916.
Re-elected in 1918.
Retired to run for U.S. Senator.
DonBColton.jpg
Don B. Colton
(Vernal)
Republican March 4, 1921 –
March 3, 1933
67th
68th
69th
70th
71st
72nd
Elected in 1920.
Re-elected in 1922.
Re-elected in 1924.
Re-elected in 1926.
Re-elected in 1928.
Re-elected in 1930.
Lost re-election.
Abe Murdock, 1939.jpg
Abe Murdock
(Beaver)
Democratic March 4, 1933 –
January 3, 1941
73rd
74th
75th
76th
Elected in 1932.
Re-elected in 1934.
Re-elected in 1936.
Re-elected in 1938.
Retired to run for U.S. Senator.
WalterKGranger.jpg
Walter K. Granger
(Cedar City)
Democratic January 3, 1941 –
January 3, 1953
77th
78th
79th
80th
81st
82nd
Elected in 1940.
Re-elected in 1942.
Re-elected in 1944.
Re-elected in 1946.
Re-elected in 1948.
Re-elected in 1950.
Retired to run for U.S. Senator.
Douglas R. Stringfellow, 83rd Congress.jpg
Douglas R. Stringfellow
(Ogden)
Republican January 3, 1953 –
January 3, 1955
83rd Elected in 1952.
Renominated, but replaced on ballot
due to personal scandal.
HAldousDixon.jpg
Henry Aldous Dixon
(Ogden)
Republican January 3, 1955 –
January 3, 1961
84th
85th
86th
Elected in 1954.
Re-elected in 1956.
Re-elected in 1958.
Retired.
M. Blaine Peterson.png
M. Blaine Peterson
(Ogden)
Democratic January 3, 1961 –
January 3, 1963
87th Elected in 1960.
Lost re-election.
LaurenceJBurton.jpg
Laurence J. Burton
(Ogden)
Republican January 3, 1963 –
January 3, 1971
88th
89th
90th
91st
Elected in 1962.
Re-elected in 1964.
Re-elected in 1966.
Re-elected in 1968.
Retired to run for U.S. Senator.
Gunn McKay.png
K. Gunn McKay
(Huntsville)
Democratic January 3, 1971 –
January 3, 1981
92nd
93rd
94th
95th
96th
Elected in 1970.
Re-elected in 1972.
Re-elected in 1974.
Re-elected in 1976.
Re-elected in 1978.
Lost re-election.
Jameshansen.jpg
Jim Hansen
(Farmington)
Republican January 3, 1981 –
January 3, 2003
97th
98th
99th
100th
101st
102nd
103rd
104th
105th
106th
107th
Elected in 1980.
Re-elected in 1982.
Re-elected in 1984.
Re-elected in 1986.
Re-elected in 1988.
Re-elected in 1990.
Re-elected in 1992.
Re-elected in 1994.
Re-elected in 1996.
Re-elected in 1998.
Re-elected in 2000.
Retired.
Rob Bishop Official (Utah politician).jpg
Rob Bishop
(Brigham City)
Republican January 3, 2003 –
January 3, 2021
108th
109th
110th
111th
112th
113th
114th
115th
116th
Elected in 2002.
Re-elected in 2004.
Re-elected in 2006.
Re-elected in 2008.
Re-elected in 2010.
Re-elected in 2012.
Re-elected in 2014.
Re-elected in 2016.
Re-elected in 2018.
Retired to join Thomas Wright's gubernatorial ticket.
2003–2013:
UT01 109.gif
2013–2023:
Utah US Congressional District 1 (since 2013).tif
Blake Moore 117th U.S Congress.jpg
Blake Moore
(Ogden)
Republican January 3, 2021 –
present
117th
118th
Elected in 2020.
Re-elected in 2022.
2023–present:
Utah's 1st congressional district with inset (since 2023).svg

Election results

1912

Note: The 1912 election consisted of an all-party election for the two at-large seats. Howell was elected to the first at-large seat, while Johnson was elected to the second at-large seat.

1912 United States House of Representatives elections [7]
PartyCandidateVotes%
Republican Joseph Howell 43,133 19.45
Republican Jacob Johnson 42,047 18.96
Democratic Mathonihah Thomas37,19216.77
Democratic Tollman D. Johnson36,64016.52
Progressive S.H. Love22,35810.08
Progressive Lewis Larson21,9349.89
Socialist Murray E. King8,9714.05
Socialist William M. Knerr8,9534.04
Socialist Labor Elias Anderson5050.23
Total votes221,733 100.0
Republican win (new seat)

1914

1914 United States House of Representatives elections [8]
PartyCandidateVotes%
Republican Joseph Howell (Incumbent) 29,481 49.36
Democratic Lewis Larson27,44045.94
Socialist Ben Jansen2,8124.70
Total votes59,733 100.0
Republican hold

1916

1916 United States House of Representatives elections [9]
PartyCandidateVotes%
Democratic Milton H. Welling 40,035 55.55
Republican Timothy C. Hoyt29,90241.49
Socialist Daniel Konald2,1342.96
Total votes72,071 100.0
Democratic gain from Republican

1918

1918 United States House of Representatives elections [10]
PartyCandidateVotes%
Democratic Milton H. Welling (Incumbent) 25,327 54.64
Republican William Henry Wattis 20,47844.18
Socialist Daniel N. Keef5481.18
Total votes46,353 100.0
Democratic hold

1920

1920 United States House of Representatives elections [11]
PartyCandidateVotes%
Republican Don B. Colton 42,249 57.49
Democratic James W. Funk28,16038.32
Farmer–Labor John O. Watters3,0834.19
Total votes73,492 100.0
Republican gain from Democratic

1922

1922 United States House of Representatives elections [12]
PartyCandidateVotes%
Republican Don B. Colton (Incumbent) 33,188 52.73
Democratic Milton H. Welling 27,80144.17
Farmer–Labor John O. Watters1,9493.10
Total votes62,938 100.0
Republican hold

1924

1924 United States House of Representatives elections [13]
PartyCandidateVotes%
Republican Don B. Colton (Incumbent) 40,883 54.86
Democratic Frank Francis33,64445.14
Total votes74,527 100.0
Republican hold

1926

1926 United States House of Representatives elections [14]
PartyCandidateVotes%
Republican Don B. Colton (Incumbent) 44,007 61.44
Democratic Ephraim Bergeson27,19837.97
Socialist John O. Watters4260.59
Total votes71,631 100.0
Republican hold

1928

1928 United States House of Representatives elections [15]
PartyCandidateVotes%
Republican Don B. Colton (Incumbent) 50,274 60.89
Democratic Knox Patterson31,88938.62
Socialist John O. Watters4080.49
Total votes82,571 100.0
Republican hold

1930

1930 United States House of Representatives elections [16]
PartyCandidateVotes%
Republican Don B. Colton (Incumbent) 45,875 60.77
Democratic Joseph Ririe29,21038.70
Socialist A. W. Clemons4020.53
Total votes75,487 100.0
Republican hold

1932

1932 United States House of Representatives elections [17]
PartyCandidateVotes%
Democratic Abe Murdock 47,774 51.59
Republican Don B. Colton (Incumbent)44,82748.41
Total votes92,601 100.0
Democratic gain from Republican

1934

1934 United States House of Representatives elections [18]
PartyCandidateVotes%
Democratic Abe Murdock (Incumbent) 55,800 64.43
Republican Arthur Woolley29,87834.51
Socialist William J. McConnell6440.74
Communist Lawrence Mower2790.32
Total votes86,601 100.0
Democratic hold

1936

1936 United States House of Representatives elections [19]
PartyCandidateVotes%
Democratic Abe Murdock (Incumbent) 68,877 69.23
Republican Charles W. Dunn30,41530.57
Socialist William J. McConnell2020.20
Total votes99,494 100.0
Democratic hold

1938

1938 United States House of Representatives elections [20]
PartyCandidateVotes%
Democratic Abe Murdock (Incumbent) 52,927 59.66
Republican LeRoy B. Young35,79040.34
Total votes88,717 100.0
Democratic hold

1940

1940 United States House of Representatives elections [21]
PartyCandidateVotes%
Democratic Walter K. Granger 62,654 57.13
Republican LeRoy B. Young47,02142.87
Total votes109,675 100.0
Democratic hold

1942

1942 United States House of Representatives elections [22]
PartyCandidateVotes%
Democratic Walter K. Granger (Incumbent) 36,297 50.19
Republican J. Bracken Lee 36,02849.81
Total votes72,325 100.0
Democratic hold

1944

1944 United States House of Representatives elections [23]
PartyCandidateVotes%
Democratic Walter K. Granger (Incumbent) 59,755 57.79
Republican B. H. Stringham43,64242.21
Total votes103,397 100.0
Democratic hold

1946

1946 United States House of Representatives elections [24]
PartyCandidateVotes%
Democratic Walter K. Granger (Incumbent) 44,888 50.06
Republican David J. Wilson44,78449.94
Total votes89,672 100.0
Democratic hold

1948

1948 United States House of Representatives elections [25]
PartyCandidateVotes%
Democratic Walter K. Granger (Incumbent) 66,641 59.04
Republican David J. Wilson46,22940.96
Total votes112,870 100.0
Democratic hold

1950

1950 United States House of Representatives elections [26]
PartyCandidateVotes%
Democratic Walter K. Granger (Incumbent) 54,161 51.08
Republican Preston L. Jones51,86848.92
Total votes106,029 100.0
Democratic hold

1952

1952 United States House of Representatives elections [27]
PartyCandidateVotes%
Republican Douglas R. Stringfellow 76,545 60.54
Democratic Ernest R. McKay49,89839.46
Total votes126,443 100.0
Republican gain from Democratic

1954

1954 United States House of Representatives elections [28]
PartyCandidateVotes%
Republican Henry Aldous Dixon 55,542 53.37
Democratic Walter K. Granger 48,53546.63
Total votes104,077 100.0
Republican hold

1956

1956 United States House of Representatives elections [29]
PartyCandidateVotes%
Republican Henry Aldous Dixon (Incumbent) 74,107 60.92
Democratic Carlyle F. Gronning47,53339.08
Total votes121,640 100.0
Republican hold

1958

1958 United States House of Representatives elections [30]
PartyCandidateVotes%
Republican Henry Aldous Dixon (Incumbent) 58,141 53.90
Democratic M. Blaine Peterson 49,73546.10
Total votes107,876 100.0
Republican hold

1960

1960 United States House of Representatives elections [31]
PartyCandidateVotes%
Democratic M. Blaine Peterson 65,939 50.03
Republican A. Walter Stevenson65,87149.97
Total votes131,810 100.0
Democratic gain from Republican

1962

1962 United States House of Representatives elections [32]
PartyCandidateVotes%
Republican Laurence J. Burton 59,032 50.88
Democratic M. Blaine Peterson (Incumbent)56,98949.12
Total votes116,021 100.0
Republican gain from Democratic

1964

1964 United States House of Representatives elections [33]
PartyCandidateVotes%
Republican Laurence J. Burton (Incumbent) 75,986 55.97
Democratic William G. Bruhn59,76844.03
Total votes135,754 100.0
Republican hold

1966

1966 United States House of Representatives elections [34]
PartyCandidateVotes%
Republican Laurence J. Burton (Incumbent) 99,750 66.50
Democratic J. Keith Melville 50,26033.50
Total votes150,010 100.0
Republican hold

1968

1968 United States House of Representatives elections [35]
PartyCandidateVotes%
Republican Laurence J. Burton (Incumbent) 139,456 68.12
Democratic Richard J. Maughan 65,26531.88
Total votes204,721 100.0
Republican hold

1970

1970 United States House of Representatives elections [36]
PartyCandidateVotes%
Democratic K. Gunn McKay 95,499 51.27
Republican Richard Richards 89,26947.93
American Independent Daniel L. Worthington1,4890.80
Total votes186,257 100.0
Democratic gain from Republican

1972

1972 United States House of Representatives elections [37]
PartyCandidateVotes%
Democratic K. Gunn McKay (Incumbent) 127,027 55.40
Republican Robert K. Wolthuis96,29642.00
American L. S. Brown5,9782.60
Total votes229,301 100.0
Democratic hold

1974

1974 United States House of Representatives elections [38]
PartyCandidateVotes%
Democratic K. Gunn McKay (Incumbent) 124,793 62.63
Republican Ronald W. Inkley62,80731.52
American L. S. Brown11,6645.85
Total votes199,264 100.0
Democratic hold

1976

1976 United States House of Representatives elections [39]
PartyCandidateVotes%
Democratic K. Gunn McKay (Incumbent) 155,631 58.17
Republican Joe H. Ferguson106,54239.83
American Harry B. Gerlach5,3582.00
Total votes267,531 100.0
Democratic hold

1978

1978 United States House of Representatives elections [40]
PartyCandidateVotes%
Democratic K. Gunn McKay (Incumbent) 93,892 51.03
Republican Jed J. Richardson85,02846.21
American Independent Robert Terrance Owens4,1802.27
Independent Dennis A. De Boer8940.49
Total votes183,994 100.0
Democratic hold

1980

1980 United States House of Representatives elections [41]
PartyCandidateVotes%
Republican James V. Hansen 157,111 52.10
Democratic K. Gunn McKay (Incumbent)144,45947.90
Total votes301,570 100.0
Republican gain from Democratic

1982

1982 United States House of Representatives elections [42]
PartyCandidateVotes%
Republican James V. Hansen (Incumbent) 111,416 62.80
Democratic A. Stephen Dirks66,00637.20
Total votes177,422 100.0
Republican hold

1984

1984 United States House of Representatives elections [43]
PartyCandidateVotes%
Republican James V. Hansen (Incumbent) 142,952 71.22
Democratic Milton C. Abrams56,61928.21
Libertarian Willy Marshall 1,1460.57
Total votes200,717 100.0
Republican hold

1986

1986 United States House of Representatives elections [44]
PartyCandidateVotes%
Republican James V. Hansen (Incumbent) 82,151 51.56
Democratic K. Gunn McKay 77,18048.44
Total votes159,331 100.0
Republican hold

1988

1988 United States House of Representatives elections [45]
PartyCandidateVotes%
Republican James V. Hansen (Incumbent) 130,893 59.80
Democratic K. Gunn McKay 87,97640.20
Total votes218,869 100.0
Republican hold

1990

1990 United States House of Representatives elections [46]
PartyCandidateVotes%
Republican James V. Hansen (Incumbent) 82,746 52.15
Democratic Kenley Brunsdale69,49143.80
American Reva Marx Wadsworth6,4294.05
Total votes158,666 100.0
Republican hold

1992

1992 United States House of Representatives elections [47]
PartyCandidateVotes%
Republican James V. Hansen (Incumbent) 160,037 65.25
Democratic Ron Holt68,71228.02
Independent William J. "Dub" Lawrence16,5056.73
Total votes245,254 100.0
Republican hold

1994

1994 United States House of Representatives elections [48]
PartyCandidateVotes%
Republican James V. Hansen (Incumbent) 104,954 64.54
Democratic Bobbie Coray57,66435.46
Total votes162,618 100.0
Republican hold

1996

1996 United States House of Representatives elections [49]
PartyCandidateVotes%
Republican James V. Hansen (Incumbent) 150,126 68.31
Democratic Gregory J. Sanders65,86629.97
Natural Law Randall Tolpinrud3,7871.72
Total votes219,779 100.0
Republican hold

1998

1998 United States House of Representatives elections [50]
PartyCandidateVotes%
Republican James V. Hansen (Incumbent) 109,708 67.69
Democratic Steve Beierlein49,30730.42
Libertarian Gerald A. Arthus3,0701.89
Total votes162,085 100.0
Republican hold

2000

2000 United States House of Representatives elections [51]
PartyCandidateVotes%
Republican James V. Hansen (Incumbent) 180,591 68.98
Democratic Kathleen McConkie Collinwood71,22927.21
Independent American Hartley D. Anderson5,1311.96
Libertarian Dave Starr Seely3,1511.20
Natural Law Matthew D. Frandsen1,7030.65
Total votes261,805 100.0
Republican hold

2002

2002 United States House of Representatives elections [52]
PartyCandidateVotes%
Republican Rob Bishop 109,265 60.90
Democratic Dave Thomas66,10436.84
Green Craig Axford4,0272.24
Write-ins160.01
Total votes179,412 100.0
Republican hold

2004

2004 United States House of Representatives elections [53]
PartyCandidateVotes%
Republican Rob Bishop (Incumbent) 199,615 67.91
Democratic Steven Thompson85,63029.13
Constitution Charles Johnston4,5101.53
Personal Choice Richard W. Soderberg4,2061.43
Total votes293,961 100.0
Republican hold

2006

2006 United States House of Representatives elections [54]
PartyCandidateVotes%
Republican Rob Bishop (Incumbent) 112,546 63.06
Democratic Steven Olsen57,92232.45
Constitution Mark Hudson5,5393.10
Libertarian Lynn Badler2,4671.38
Total votes178,474 100.0
Republican hold

2008

2008 United States House of Representatives elections [55]
PartyCandidateVotes%
Republican Rob Bishop (Incumbent) 196,799 64.85
Democratic Morgan E. Bowen92,46930.47
Constitution Kirk D. Pearson7,3972.44
Libertarian Joseph Geddes Buchman6,7802.23
Total votes303,445 100.0
Republican hold

2010

2010 United States House of Representatives elections [56]
PartyCandidateVotes%
Republican Rob Bishop (Incumbent) 135,247 69.19
Democratic Morgan E. Bowen46,76523.93
Constitution Kirk D. Pearson9,1434.68
Libertarian Jared Paul Stratton4,3072.20
Total votes195,462 100.0
Republican hold

2012

2012 United States House of Representatives elections [57]
PartyCandidateVotes%
Republican Rob Bishop (Incumbent) 161,546 71.50
Democratic Donna McAleer 55,74024.70
Constitution Sherry Phipps8,6033.80
Total votes225,889 100.0
Republican hold

2014

2014 United States House of Representatives elections [58]
PartyCandidateVotes%
Republican Rob Bishop (Incumbent) 84,231 64.78
Democratic Donna McAleer36,42228.01
Libertarian Craig Bowden4,8473.73
Independent American Dwayne A Vance4,5343.49
Total votes130,034 100.0
Republican hold

2016

2016 United States House of Representatives elections [59]
PartyCandidateVotes%
Republican Rob Bishop (Incumbent) 182,928 65.9
Democratic Peter C. Clemens73,38126.4
Libertarian Craig Bowden16,2965.9
UnaffiliatedChadwick H. Fairbanks III4,8501.7
Total votes277,455 100.0
Republican hold

2018

2018 United States House of Representatives elections [60]
PartyCandidateVotes%
Republican Rob Bishop (Incumbent) 156,692 61.6
Democratic Lee Castillo63,30824.9
United Utah Eric Eliason29,54711.6
Green Adam Davis4,7861.9
Total votes254,333 100.0
Republican hold

2020

2020 United States House of Representatives elections [61]
PartyCandidateVotes%
Republican Blake Moore 237,988 69.52
Democratic Darren Parry104,19430.43
Write-in 1690.05
Total votes342,351 100.00
Republican hold

2022

2022 United States House of Representatives elections [62]
PartyCandidateVotes%
Republican Blake Moore (incumbent) 178,434 66.97
Democratic Rick Jones87,98633.03
Total votes266,420 100
Republican hold

See also

Related Research Articles

The 1910 United States House of Representatives elections were held for the most part on November 8, 1910, while Maine and Vermont held theirs early in September, in the middle of President William Howard Taft's term. Elections were held for all 391 seats of the United States House of Representatives, representing 46 states, to the 62nd United States Congress.

The 1908 United States House of Representatives elections were held for the most part on November 3, 1908, with Oregon, Maine, and Vermont holding theirs early in either June or September. They coincided with the 1908 United States presidential election, which William Howard Taft won. Elections were held for all 391 seats of the United States House of Representatives, representing 46 states, to serve in the 61st United States Congress.

The 1906 United States House of Representatives elections were held for the most part on November 6, 1906, with Oregon, Maine, and Vermont holding theirs early in either June or September. They occurred in the middle of President Theodore Roosevelt's second term. Elections were held for 386 seats of the United States House of Representatives, representing 45 states, to serve in the 60th United States Congress.

<span class="mw-page-title-main">1904 United States House of Representatives elections</span> House elections for the 59th U.S. Congress

The 1904 United States House of Representatives elections were held for the most part on November 8, 1904, with Oregon, Maine, and Vermont holding theirs early in either June or September. They coincided with the election to a full term of President Theodore Roosevelt. Elections were held for 386 seats of the United States House of Representatives, representing 45 states, to serve in the 59th United States Congress.

<span class="mw-page-title-main">1900 United States House of Representatives elections</span> House elections for the 57th U.S. Congress

The 1900 United States House of Representatives elections were held for the most part on November 6, 1900, with Oregon, Maine, and Vermont holding theirs early in either June or September. They coincided with the re-election of President William McKinley. Elections were held for 357 seats of the United States House of Representatives, representing 45 states, to serve in the 57th United States Congress. Special elections were also held throughout the year.

The 1898 United States House of Representatives elections were held for the most part on November 8, 1898, with Oregon, Maine, and Vermont holding theirs early in either June or September. They were held during the middle of President William McKinley's first term. Elections were held for 357 seats of the United States House of Representatives, representing 45 states, to serve in the 56th United States Congress. Special elections were also held throughout the year.

<span class="mw-page-title-main">1896 United States House of Representatives elections</span> House elections for the 55th U.S. Congress

The 1896 United States House of Representatives elections were held for the most part on November 3, 1896, with Oregon, Maine, and Vermont holding theirs early in either June or September. They coincided with the election of President William McKinley. Elections were held for 357 seats of the United States House of Representatives, representing 45 states, to serve in the 55th United States Congress. The size of the House increased by one seat after Utah gained statehood on January 4, 1896. Special elections were also held throughout the year.

<span class="mw-page-title-main">1894 United States House of Representatives elections</span> House elections for the 54th U.S. Congress

The 1894 United States House of Representatives elections were held from June 4, 1894, to November 6, 1894, with special elections throughout the year. Elections were held to elect representatives from all 356 congressional districts across each of the 44 U.S. states at the time, as well as non-voting delegates from the inhabited U.S. territories. The winners of this election served in the 54th Congress, with seats apportioned among the states based on the 1890 United States census.

<span class="mw-page-title-main">1884 United States House of Representatives elections</span> House elections for the 49th U.S. Congress

The 1884 United States House of Representatives elections were held for the most part on November 4, 1884, with four states holding theirs early between June and October. They coincided with the election of President Grover Cleveland. Elections were held for 325 seats of the United States House of Representatives, representing 38 states, to serve in the 49th United States Congress. Special elections were also held throughout the year.

<span class="mw-page-title-main">1882 United States House of Representatives elections</span> House elections for the 48th U.S. Congress

The 1882 United States House of Representatives elections were held for the most part on November 7, 1882, with five states holding theirs early between June and October. They occurred during President Chester A. Arthur's term. Elections were held for 325 seats of the United States House of Representatives, representing 38 states, to serve in the 48th United States Congress. They were the first elections after reapportionment following the 1880 United States census, increasing the size of the House. Special elections were also held throughout the year.

<span class="mw-page-title-main">1876–77 United States House of Representatives elections</span> House elections for the 45th U.S. Congress

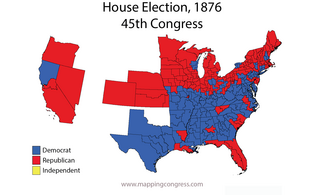
The 1876–77 United States House of Representatives elections were held on various dates in various states between June 5, 1876, and March 13, 1877. Each state set its own date for its elections to the House of Representatives before the first session of the 45th United States Congress convened on October 15, 1877. The size of the House increased to 293 seats with the addition of the new state of Colorado.

<span class="mw-page-title-main">1868–69 United States House of Representatives elections</span> House elections for the 41st U.S. Congress

The 1868–69 United States House of Representatives elections were held on various dates in various states between June 1, 1868, and August 2, 1869. Each state set its own date for its elections to the House of Representatives before or after the first session of the 41st United States Congress convened on March 4, 1869. They coincided with the 1868 United States presidential election, which was won by Ulysses S. Grant. Elections were held for all 243 seats, representing 37 states. All of the former Confederate states were represented in Congress for the first time since they seceded from the Union.

<span class="mw-page-title-main">1854–55 United States House of Representatives elections</span> House elections for the 34th U.S. Congress

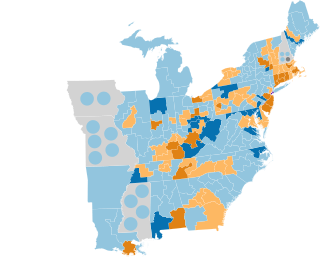
The 1854–55 United States House of Representatives elections were held in 31 states for all 234 seats between August 4, 1854, and November 6, 1855, during President Franklin Pierce's term. Each state legislature separately set a date to elect representatives to the House of Representatives before the 34th Congress convened its first session on December 3, 1855.

<span class="mw-page-title-main">1844–45 United States House of Representatives elections</span> House elections for the 29th U.S. Congress

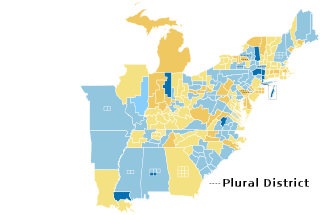
The 1844–45 United States House of Representatives elections were held on various dates in various states between July 1, 1844, and November 4, 1845. Each state set its own date for its elections to the House of Representatives. 224 elected members representing 27 states took their seats when the first session of the 29th United States Congress convened on December 1, 1845. The new state of Florida elected its first representative during this election cycle, while one vacancy in New Hampshire's delegation remained unfilled for the duration of the 29th Congress.

<span class="mw-page-title-main">1840–41 United States House of Representatives elections</span> House elections for the 27th U.S. Congress

The 1840–41 United States House of Representatives elections were held on various dates in various states between July 6, 1840, and November 2, 1841. Each state set its own date for its elections to the House of Representatives, before or after the first session of the 27th United States Congress convened on May 31, 1841. Elections were held for all 242 seats, representing 26 states.

<span class="mw-page-title-main">1832–33 United States House of Representatives elections</span> House elections for the 23rd U.S. Congress

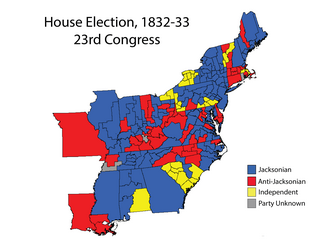
The 1832–33 United States House of Representatives elections were held on various dates in various states between July 2, 1832, and October 7, 1833. Each state set its own date for its elections to the House of Representatives before the first session of the 23rd United States Congress convened on December 2, 1833. They were held concurrently with the 1832 presidential election, in which Democrat Andrew Jackson was re-elected. The congressional reapportionment based on the 1830 United States census increased the size of the House to 240 seats.

Colorado's 3rd congressional district is a congressional district in the U.S. state of Colorado. It takes in most of the rural Western Slope in the state's western third portion, with a wing in the south taking in some of the southern portions of the Eastern Plains. It includes the cities of Grand Junction, Durango, Aspen, Glenwood Springs, Ignacio, and Pueblo. The district has been represented by Republican Lauren Boebert since 2021.

Colorado's 4th congressional district is a congressional district in the U.S. state of Colorado. Located in the eastern part of the state, the district encompasses most of the rural Eastern Plains as well as portions of the Colorado Front Range including Loveland, Highlands Ranch, Castle Rock, and Parker.

Utah's 2nd congressional district currently serves Salt Lake City and the largely rural western and southern portions of Utah, including Saint George and Tooele. The district is currently represented by Republican Celeste Maloy, who was elected to the seat after she defeated Democrat Kathleen Riebe in the November 21, 2023 special election, caused by the resignation of incumbent Chris Stewart (R) on September 15, 2023. With a Cook Partisan Voting Index rating of R+11, it is the least Republican district in Utah, a state with an all-Republican congressional delegation.

Utah's 3rd congressional district is a congressional district in the United States House of Representatives. It is located in southern and eastern Utah and includes the cities of Orem and Provo.

References

  1. "My Congressional District".
  2. "2022 Cook PVI: District Map and List". Cook Political Report. Retrieved January 10, 2023.
  3. "About the Cook Report. What is the Cook Political Report?". Archived from the original on April 12, 2008. Retrieved March 18, 2008.
  4. "Daily Kos Elections 2008, 2012 & 2016 presidential election results for congressional districts used in 2018 elections - Google Drive". docs.google.com.
  5. "Presidential Election Results, by district" via Daily Kos.
  6. "Presidential Election Results, by district". December 15, 2008 via swingstateproject.com.
  7. "Our Campaigns - UT At-Large Race - Nov 05, 1912". www.ourcampaigns.com.
  8. "Our Campaigns - UT - District 01 Race - Nov 03, 1914". www.ourcampaigns.com.
  9. "Our Campaigns - UT District 01 Race - Nov 07, 1916". www.ourcampaigns.com.
  10. "Our Campaigns - UT District 01 Race - Nov 05, 1918". www.ourcampaigns.com.
  11. "1920 Election Results" (PDF).
  12. "1922 Election Results" (PDF).
  13. "1924 Election Results" (PDF).
  14. 1926 Election Results
  15. "1928 Election Results" (PDF).
  16. "1930 Election Results" (PDF).
  17. "1932 Election Results" (PDF).
  18. "1934 Election Results" (PDF).
  19. "1936 Election Results" (PDF).
  20. "1938 Election Results" (PDF).
  21. "1940 Election Results" (PDF).
  22. "1942 Election Results" (PDF).
  23. "1944 Election Results" (PDF).
  24. "1946 Election Results" (PDF).
  25. "1948 Election Results" (PDF).
  26. "1950 Election Results" (PDF).
  27. "1952 Election Results" (PDF).
  28. "1954 Election Results" (PDF).
  29. "1956 Election Results" (PDF).
  30. "1958 Election Results" (PDF).
  31. "1960 Election Results" (PDF).
  32. "1962 Election Results" (PDF).
  33. "1964 Election Results" (PDF).
  34. "1966 Election Results" (PDF).
  35. "1968 Election Results" (PDF).
  36. "1970 Election Results" (PDF).
  37. "1972 Election Results" (PDF).
  38. "1974 Election Results" (PDF).
  39. "1976 Election Results" (PDF).
  40. "1978 Election Results" (PDF).
  41. "1980 Election Results" (PDF).
  42. "1982 Election Results" (PDF).
  43. "1984 Election Results" (PDF).
  44. "1986 Election Results" (PDF).
  45. "1988 Election Results" (PDF).
  46. "1990 Election Results" (PDF).
  47. "1992 Election Results" (PDF).
  48. "1994 Election Results" (PDF).
  49. "1996 Election Results" (PDF).
  50. "1998 Election Results" (PDF).
  51. "2000 Election Results" (PDF).
  52. "2002 Election Results" (PDF).
  53. "2004 Election Results" (PDF).
  54. "2006 Election Results" (PDF).
  55. "2008 Election Results" (PDF).
  56. "2010 Election Results". Archived from the original on July 16, 2011. Retrieved July 11, 2011.
  57. "2012 Utah House Results". Politico .
  58. 2014 election general canvass report utah.gov
  59. 2016 election canvass utah.gov
  60. 2018 election canvass utah.gov
  61. "Election results".
  62. "US Congressional District 1". Utah Election Preliminary Results. Retrieved December 14, 2022.

41°00′N111°30′W / 41.0°N 111.5°W / 41.0; -111.5