2009 Atlantic hurricane season

Last updated

2009 Atlantic hurricane season
2009 Atlantic hurricane season summary map.png
Season summary map
Seasonal boundaries
First system formedMay 28, 2009
Last system dissipatedNovember 10, 2009
Strongest storm
Name Bill
  Maximum winds130 mph (215 km/h)
(1-minute sustained)
  Lowest pressure943 mbar (hPa; 27.85 inHg)
Seasonal statistics
Total depressions11
Total storms9
Hurricanes3
Major hurricanes
(Cat. 3+)
2
Total fatalities9 direct
Total damage~ $57.99 million (2009 USD)
Related articles
Atlantic hurricane seasons
2007, 2008, 2009, 2010, 2011

The 2009 Atlantic hurricane season was a near-average Atlantic hurricane season that produced eleven tropical cyclones, nine named storms, three hurricanes, and two major hurricanes. [1] [nb 1] It officially began on June 1 and ended on November 30, dates that conventionally delimit the period of each year when most tropical cyclones develop in the Atlantic basin. [3] The season's first tropical cyclone, Tropical Depression One, developed on May 28, [4] while the final storm, Hurricane Ida, dissipated on November 10. [5] The most intense hurricane, Bill, was a powerful Cape Verde-type hurricane that affected areas from the Leeward Islands to Newfoundland. [6] The season featured the lowest number of tropical cyclones since the 1997 season, and only one system, Claudette, made landfall in the United States. Forming from the interaction of a tropical wave and an upper-level low, Claudette made landfall on the Florida Panhandle with maximum sustained winds of 45 mph (70 km/h) before quickly dissipating over Alabama. The storm killed two people and caused $228,000 (2009 USD) in damage.

Contents

Pre-season forecasts issued by Colorado State University (CSU) called for fourteen named storms and seven hurricanes, of which three were expected to attain major hurricane status. [nb 2] The National Oceanic and Atmospheric Administration (NOAA) later issued its initial forecast, which predicted nine to fourteen named storms, four to seven hurricanes, and one to three major hurricanes. After several revisions in the projected number of named storms, both agencies lowered their forecasts by the middle of the season.

Several storms made landfall or directly affected land outside of the United States. Tropical Storm Ana brought substantial rainfall totals to many of the Caribbean islands, including Puerto Rico, which led to minor street flooding. Hurricane Bill delivered gusty winds and rain to the island of Newfoundland, while Tropical Storm Danny affected the U.S. state of North Carolina, and Erika affected the Lesser Antilles as a poorly organized tropical system. Hurricane Fred affected the Cape Verde Islands as a developing tropical cyclone and Tropical Storm Grace briefly impacted the Azores, becoming the farthest northeast forming storm on record. The season's final storm, Ida, affected portions of Central America before bringing significant rainfall to the Southeast United States as an extratropical cyclone.

Seasonal forecasts

Predictions of tropical activity in the 2009 season
SourceDateNamed
storms
HurricanesMajor
hurricanes
Average (1950–2000)9.65.92.3
Record high activity [7] 30 15 7
Record low activity [7] 1 0 0

CSU December 10, 20081473
CSU April 7, 20091262
NOAA May 21, 20099–144–71–3
CSU June 2, 20091152
FSU COAPS June 2, 200984N/A
UKMO June 18, 20096*N/AN/A
CSU August 4, 20091042
NOAA August 6, 20097–113–61–2

Actual activity932
* July–November only.
† Most recent of several such occurrences. (See all)

Forecasts of hurricane activity are issued before each hurricane season by noted hurricane experts Philip J. Klotzbach, William M. Gray, and their associates at Colorado State University; and separately by NOAA forecasters.

Klotzbach's team (formerly led by Gray) defined the average number of storms per season (1950 to 2000) as 9.6 tropical storms, 5.9 hurricanes, 2.3 major hurricanes (storms reaching at least Category 3 strength in the Saffir–Simpson hurricane scale) and an accumulated cyclone energy (ACE) Index of 96.1. [8] ACE is, broadly speaking, a measure of the power of the hurricane multiplied by the length of time it existed, so storms that last a long time, as well as particularly strong hurricanes, have high ACE numbers. ACE is only calculated for full advisories on tropical systems at or exceeding 39 mph (63 km/h), which is the threshold for tropical storm intensity. [9] NOAA defines a season as above-normal, near-normal or below-normal by a combination of the number of named storms, the number reaching hurricane strength, the number reaching major hurricane strength and ACE Index. [10]

Pre-season forecasts

On December 10, 2008, Klotzbach's team issued its first extended-range forecast for the 2009 season, predicting above-average activity (14 named storms, 7 hurricanes, 3 of Category 3 or higher and ACE Index of 125). On April 7, 2009, Klotzbach's team issued an updated forecast for the 2009 season, predicting near-average activity (12 named storms, 6 hurricanes, 2 of Category 3 or higher and ACE Index of 100), citing the possible cause as the high probability of a weak El Niño forming during the season. [11] On May 21, 2009, NOAA issued their forecast for the season, predicting near or slightly above average activity, (9 to 14 named storms, 4 to 7 hurricanes, and 1 to 3 of Category 3 or higher). [12]

Midseason outlooks

On June 2, 2009, Klotzbach's team issued another updated forecast for the 2009 season, predicting slightly below average activity (11 named storms, 5 hurricanes, 2 of Category 3 or higher and ACE Index of 85). Also on June 2, 2009, the Florida State University Center for Ocean-Atmospheric Prediction Studies (FSU COAPS) issued its first ever Atlantic hurricane season forecast. The FSU COAPS forecast predicted 8 named storms, including 4 hurricanes, and an ACE Index of 65. [13] On June 18, 2009, the UK Met Office (UKMO) issued a forecast of 6 tropical storms in the July to November period with a 70% chance that the number would be in the range 3 to 9. They also predicted an ACE Index of 60 with a 70% chance that the index would be in the range 40 to 80. [14] On August 4, 2009, Klotzbach's team updated their forecast for the 2009 season, again predicting slightly below average activity (10 named storms, 4 hurricanes, and 2 major hurricanes). On August 6, 2009, the NOAA also updated their forecast for the 2009 season, predicting below average activity (7–11 named storms, 3–6 hurricanes, and 1–2 major hurricanes). [15]

Seasonal summary

Hurricane Ida (2009)Tropical Storm Grace (2009)Hurricane Fred (2009)Tropical Storm Erika (2009)Tropical Storm Danny (2009)Tropical Storm Claudette (2009)Hurricane Bill (2009)Tropical Storm Ana (2009)Saffir–Simpson scale2009 Atlantic hurricane season
Satellite image of Tropical Storms Ana (center), Bill (right) and Claudette (left) on August 16 3ATL Storms August 16 2009.JPG
Satellite image of Tropical Storms Ana (center), Bill (right) and Claudette (left) on August 16

During the 2009 season, nine of the eleven tropical cyclones affected land, of which five actually made landfall. The United States experienced one of its quietest years, with no hurricanes making landfall in the country. Throughout the basin, six people were killed in tropical cyclone-related incidents and total losses reached roughly $77 million. Most of the damage resulted from Hurricane Bill, which caused severe beach erosion throughout the east coast of the United States. In the United States, tropical cyclones killed six people and caused roughly $46 million in damage. In the Lesser Antilles, Tropical Storms Ana and Erika brought moderate rainfall to several islands but resulted in little damage. Elsewhere in the Atlantic, the Azores Islands, Atlantic Canada, Bermuda, Cape Verde Islands and Wales were affected by tropical cyclones or their remnants. [1] In Canada, Hurricane Bill produced widespread moderate rainfall in Nova Scotia and Newfoundland, leaving roughly $10 million in losses. [16] The hurricane also produced tropical storm-force winds in Bermuda. [6] Hurricane Fred briefly impacted the southern Cape Verde Islands as it bypassed the islands early in its existence. [17] The Azores and Wales were also affected by Tropical Storm Grace; however, both areas recorded only minor effects. [18]

The ACE index for the 2009 Atlantic hurricane season as calculated by Colorado State University using data from the National Hurricane Center was 52.6 units. [19] Due to the low number of storms in the season, many of which were short-lived, the overall ACE value was ranked as below-average. [20] Hurricane Bill was responsible for the ACE value for August being 30% above average. [21]

Systems

Tropical Depression One

Tropical depression (SSHWS)
01L 2009-05-28 1525Z.jpg   01-L 2009 track.png
DurationMay 28 – May 29
Peak intensity35 mph (55 km/h) (1-min);
1006  mbar  (hPa)

During late-May, a frontal boundary stalled near The Bahamas and slowly degenerated. On May 25, 2009, an area of low pressure developed along the tail-end of a decaying cold front near the northern Bahamas. Tracking northward, this low gradually developed as it moved within 85 mi (135 km) of North Carolina's Outer Banks. By May 28, deep convection developed across a small area over the low-pressure system, leading to the National Hurricane Center classifying the system as Tropical Depression One. It was the northernmost forming May tropical cyclone in Atlantic history, though subtropical cyclones formed equally far north in 1972 and 2007. It also marked the third consecutive year with pre-season tropical or subtropical cyclones in the basin. The depression moved over the warm waters of the Gulf Stream for the following 24 hours, allowing it to maintain its convection, before moving into a hostile environment characterized by strong wind shear and cooler waters. Late on May 29, the system degenerated into a remnant low. Several hours later, on May 30, about 345 mi (555 km) south-southeast of Halifax, Nova Scotia, Tropical Depression One was absorbed by a warm front. [4] [22]

As a tropical cyclone, the depression had no impact on land. However, the precursor to the system brought scattered rainfall and increased winds to parts of the North Carolina coastline, but no damage. [4] Rainfall in Hatteras amounted to 0.1 in (2.5 mm) on May 27; sustained wind reached 15 mph (24 km/h) and gusts were measured up to 23 mph (37 km/h). The lowest sea level pressure recorded in relation to the system was 1009 mbar (hPa; 29.80  inHg). [23] Increased winds along coastal areas of the state was possible in relation to the outer edges of the depression. [24]

Tropical Storm Ana

Tropical storm (SSHWS)
Ana aug 12 2009 1540Z.jpg   Ana 2009 track.png
DurationAugust 11 – August 16
Peak intensity40 mph (65 km/h) (1-min);
1003  mbar  (hPa)

Ana formed out of an area of low pressure associated with a tropical wave on August 11, Ana briefly attained tropical storm intensity on August 12 before weakening back to a depression. The following day, the system degenerated into a non-convective remnant low as it tracked westward. On August 14, the depression regenerated roughly 1,075 mi (1,735 km) east of the Leeward Islands. Around 06:00UTC on August 15, the storm re-attained tropical storm status, at which time it was named Ana. After reaching a peak intensity with winds of 40 mph (65 km/h) and a barometric pressure of 1003 mbar (hPa; 29.62 inHg), the storm began to weaken again due to increasing wind shear and the unusually fast movement of Ana. In post-storm analysis, it was discovered that Ana had degenerated into a tropical wave once more on August 16, before reaching any landmasses. [25]

Numerous tropical storm watches were issued for the Lesser Antilles, Puerto Rico and the Dominican Republic between August 15 and 17. [25] Several islands took minor precautions for the storm, including St. Croix which evacuated 40 residents from flood-prone areas ahead of the storm. [26] In the Dominican Republic, officials took preparations by setting up relief agencies and setting up shelters. [27] Impact from Ana was minimal, mainly consisting of light to moderate rainfall. [25] In Puerto Rico, up to 2.76 in (70 mm), [28] causing street flooding and forcing the evacuation of three schools. High winds associated with the storm also downed trees and power lines, leaving roughly 6,000 residents without power. [29]

Hurricane Bill

Category 4 hurricane (SSHWS)
Bill 2009-08-19 1725Z.jpg   Bill 2009 track.png
DurationAugust 15 – August 24
Peak intensity130 mph (215 km/h) (1-min);
943  mbar  (hPa)

As Ana regenerated into a tropical depression, [25] a new tropical depression developed early on August 15 southwest of the Cape Verde Islands. Light wind shear and warm waters allowed the depression to steadily intensify, becoming Tropical Storm Bill later that day. By August 17, Bill attained hurricane-status about midway between the Cape Verde Islands and the Lesser Antilles. Eventually the hurricane attained its peak intensity as a Category 4 storm roughly 345 mi (555 km) east-northeast of the Leeward Islands. The storm attained maximum winds of 130 mph (210 km/h), the highest of any storm during the season, before weakening slightly as it turned north. The large storm passed roughly 175 mi (280 km) west of Bermuda as a Category 2 hurricane. Further weakening took place as Bill brushed the southern coast of Nova Scotia the following day. Shortly before making landfall in Newfoundland, Bill weakened to a tropical storm and accelerated. The storm eventually transitioned into an extratropical cyclone after moving over the north Atlantic before being absorbed by a larger non-tropical low on August 24. [6]

Two people were killed by the storm's large swells—one in Maine and another in Florida. The hurricane came close enough to warrant tropical cyclone watches and warnings in both the US and Canada. Bill was one of three tropical storms active on August 16. [6] Large, life-threatening swells produced by the storm impacted north-facing coastlines of Puerto Rico and Hispaniola as Hurricane Bill approached Bermuda. [30] Along the coasts of North Carolina, waves averaging 10 ft (3.0 m) in height impacted beaches. On Long Island, beach damage was severe; in some areas the damage was worse than Hurricane Gloria in 1985. [31] In New York, severe beach erosion caused by the storm resulted in over $35.5 million in losses. [32]

Tropical Storm Claudette

Tropical storm (SSHWS)
Claudette Aug 16 2009 1830Z.jpg   Claudette 2009 track.png
DurationAugust 16 – August 18
Peak intensity60 mph (95 km/h) (1-min);
1005  mbar  (hPa)

Just one day after the formation of Hurricane Bill, the season's third named storm developed on August 16. Forming out of a tropical wave and an upper-level low-pressure system, Claudette quickly intensified into a tropical storm offshore south of Tallahassee, Florida. By the afternoon, the storm had attained winds of 60 mph (95 km/h) and steadily tracked towards the Florida Panhandle. Early on August 17, the center of Claudette made landfall on Santa Rosa Island. Several hours after landfall, the storm weakened to a tropical depression and the Hydrometeorological Prediction Center took over primary responsibility of the storm. The system quickly dissipated and was last noted over Alabama on August 18. [33]

The National Hurricane Center issued tropical storm warnings for the Florida coastline and residents in some counties were advised to evacuate storm-surge-prone areas. [33] [34] Tropical Storm Claudette, produced moderate rainfall across portions of Florida, Georgia, and Alabama between August 16 and 18. Two people were killed offshore amidst rough seas from the storm. [35] An EF-0 tornado spawned by the storm in Cape Coral damaged 11 homes, leaving $103,000 in damages. Additional damages to coastal property and beaches amounted to $125,000 as a result of Claudette. [36]

Tropical Storm Danny

Tropical storm (SSHWS)
Danny A2009238 1730 1km.jpg   Danny 2009 track.png
DurationAugust 26 – August 29
Peak intensity60 mph (95 km/h) (1-min);
1006  mbar  (hPa)

Around the same time the remnants of Hurricane Bill dissipated over the northern Atlantic, [6] a new tropical storm developed near the Bahamas on August 26. The system, immediately declared Tropical Storm Danny on its first advisory, erratically moved in a general northwestward direction. Danny attained peak winds of 60 mph (95 km/h) before succumbing to high wind shear. After turning northward, the storm weakened and was eventually absorbed by another low-pressure system off the east coast of the United States early on August 29. [37] High waves from Danny killed a boy in the Outer Banks. [38]

Tropical Storm Erika

Tropical storm (SSHWS)
Erika 2009-09-01 1700Z.jpg   Erika 2009 track.png
DurationSeptember 1 – September 3
Peak intensity50 mph (85 km/h) (1-min);
1004  mbar  (hPa)

On September 1, the season's fifth named storm, Tropical Storm Erika, formed east of the Lesser Antilles. Upon forming, the storm had attained its peak intensity with winds of 50 mph (80 km/h). Persistent wind shear prevented the system from intensifying and resulted in the storm's convection being completely displaced from the center of circulation by the time it passed over Guadeloupe on September 2. After entering the Caribbean Sea, Erika briefly regained strength before fully succumbing to strong shear. The system eventually dissipated on September 4, to the south of Puerto Rico. [39] Damages were minor, though one island received several inches of rain.[ citation needed ]

Hurricane Fred

Category 3 hurricane (SSHWS)
Hurricane Fred 2009-09-09 1250Z.jpg   Fred 2009 track.png
DurationSeptember 7 – September 12
Peak intensity120 mph (195 km/h) (1-min);
958  mbar  (hPa)

Several days after Erika dissipated, [39] a new tropical depression formed southeast of the Cape Verde Islands on September 7. This depression rapidly intensified within an environment of low wind shear and high sea surface temperatures. Receiving the name Fred on September 8, the storm quickly developed an eye feature and was upgraded to a hurricane roughly 24 hours after being named. Within a 12‑hour span, the storm's winds increased by 40 mph (65 km/h) to its peak of 120 mph (195 km/h). Upon reaching this intensity, Fred became the strongest storm on record south of 30°N and east of 35°W in the Atlantic basin. Not long after the intensification ceased, it began to weaken as dry air became entrained within the system. By September 11, the storm nearly stalled northwest of the Cape Verde Islands and weakened to a tropical storm. The following day, Fred degenerated into a remnant low before taking a westward track across the Atlantic. The remnants of Fred persisted for nearly a week, nearly regenerating into a tropical depression several times. The low eventually dissipated on September 19, to the south of Bermuda. [17]

Tropical Depression Eight

Tropical depression (SSHWS)
Pre-Tropical Depression Eight 2009-09-25 1250Z.jpg   08-L 2009 track.png
DurationSeptember 25 – September 26
Peak intensity35 mph (55 km/h) (1-min);
1008  mbar  (hPa)

In late September, a new, well-defined tropical wave moved off the west coast of Africa into the Atlantic Ocean. By September 25, the system had developed sufficient deep convection for the NHC to classify it as Tropical Depression Eight. At this time, the depression attained its peak intensity with winds of 35 mph (55 km/h) and a minimum pressure of 1008 mbar (hPa). Shortly thereafter, wind shear and decreasing sea surface temperatures caused the depression to weaken. The system degenerated into a remnant low on September 26 before degenerating into a trough of low pressure. [40]

Tropical Storm Grace

Tropical storm (SSHWS)
Tropical Storm Grace 2009 at peak intensity.jpg   Grace 2009 track.png
DurationOctober 4 – October 6
Peak intensity65 mph (100 km/h) (1-min);
986  mbar  (hPa)

Originating from an extratropical cyclone east of Newfoundland on September 27, the precursor to Tropical Storm Grace tracked southeastward towards the Azores, gaining subtropical characteristics. After executing a counterclockwise loop between October 1 and 3, deep convection wrapped around a small circulation center that had developed within the larger cyclone. On October 4, this smaller low developed into a tropical storm while situated near the Azores Islands, becoming the northeasternmost forming Atlantic tropical cyclone on record. The storm quickly turned northeastward and intensified, developing an eye-like feature as it attained peak winds of 65 mph (105 km/h) and a minimum pressure of 986 mbar (hPa; 29.12 inHg). It weakened over increasingly colder waters and began merging with an approaching frontal boundary. Early on October 6, Grace transitioned into an extratropical cyclone before dissipating later that day near Wales. [18]

Although Grace passed through the Azores Islands, the storm had little known effects there. [18] In Europe, the system and its remnants brought rain to several countries, including Portugal, [41] the United Kingdom [42] and Belgium. [43] No fatalities were linked to Grace and overall damage was minimal. [18]

Tropical Storm Henri

Tropical storm (SSHWS)
Henri 2009-10-06 1410Z.jpg   Henri 2009 track.png
DurationOctober 6 – October 8
Peak intensity50 mph (85 km/h) (1-min);
1005  mbar  (hPa)

A tropical wave left the coast of Africa on October 1, moving westward with intermittent showers and thunderstorms. [44] On October 5, the system became better organized, [45] and a low-pressure area formed. [46] Although the thunderstorms were displaced east of the center of circulation and the probability for development was never high, the disturbance became a tropical depression around 0000 UTC on October 6 about 775 mi (1,245 km) east of the Lesser Antilles. [44] Operationally, the storm was not designated a tropical cyclone until later on October 6, when it was immediately declared a tropical storm. [47]

Affected by strong wind shear, Henri remained disorganized with its center located on the western edge of the convection. Moving northwestward, Henri intensified slightly to peak winds of 50 mph (80 km/h) on October 7 after the convection increased. Shortly thereafter, the wind shear grew stronger, and on October 8 the storm weakened to a tropical depression. [44] The structure became further disorganized with several low-level vortices. [48] Just twelve hours after weakening into a depression, Henri degenerated into a remnant area of low pressure. The remnants continued northwestward before turning to the west-southwest due to a ridge. On October 11, the storm's circulation dissipated near Hispaniola, having never impacted land. [44]

Hurricane Ida

Category 2 hurricane (SSHWS)
Hurricane Ida 2009-11-08 16-30 UTC.jpg   Ida 2009 track.png
DurationNovember 4 – November 10
Peak intensity105 mph (165 km/h) (1-min);
975  mbar  (hPa)

The final storm of the 2009 season formed over the southern Caribbean Sea on November 4. The slow moving system quickly developed into Tropical Storm Ida within a favorable environment as it neared the coastline of Nicaragua. Several hours before moving over land, Ida attained hurricane-status, with winds reaching 80 mph (130 km/h). Hours after moving inland, Ida weakened to a tropical storm and further to a tropical depression as it turned northward. On November 7, the depression re-entered the Caribbean Sea and quickly intensified. Early on November 8, the system re-attained hurricane intensity as it rapidly intensified over warm waters. Ida attained its peak intensity as a Category 2 hurricane early the next day with winds of 105 mph (170 km/h) as it moved over the Yucatán Channel. Not long after reaching this intensity, Ida quickly weakened to a tropical storm as it entered the Gulf of Mexico. Despite strong wind shear, the storm briefly re-attained hurricane status for a third time near the southeastern Louisiana coastline before quickly weakening to a tropical storm. Shortly before moving inland over the southern United States, Ida transitioned into an extratropical cyclone. The remnants of Ida persisted until November 11, at which time the low dissipated. Remnant energy from Ida provided energy for another system which became a powerful nor'easter, causing significant damage in the Mid-Atlantic States. The resulting storm came to be known as Nor'Ida. [5]

In the southern Caribbean, Hurricane Ida caused roughly $2.1 million in damage in Nicaragua after destroying numerous homes and leaving an estimated 40,000 people homeless. [49] [50] Ida also produced significant rainfall across portions of western Cuba, with some areas recording up to 12.5 in (320 mm) of rain during the storm's passage. [5] In the United States, the hurricane and the subsequent nor'easter caused substantial damage, mainly in the Mid-Atlantic States. [5] One person was killed by Ida after drowning in rough seas while six others were killed in various incidents related to the nor'easter. Overall, the two systems caused nearly $300 million in damage throughout the country. [36]

Storm names

The following list of names was used for named storms that formed in the North Atlantic in 2009. [51] This was the same list used in the 2003 season, [52] with the exceptions of Fred, Ida, and Joaquin, which replaced Fabian, Isabel, and Juan, respectively. [53] Storms were named Fred and Ida for the first time in 2009. No names were retired following the season, [54] so the same list was used again for the 2015 season. [55]

  • Henri
  • Ida
  • Joaquin (unused)
  • Kate (unused)
  • Larry (unused)
  • Mindy (unused)
  • Nicholas (unused)
  • Odette (unused)
  • Peter (unused)
  • Rose (unused)
  • Sam (unused)
  • Teresa (unused)
  • Victor (unused)
  • Wanda (unused)

Season effects

This is a table of all of the storms that formed in the 2009 Atlantic hurricane season. It includes their name, duration, peak classification and intensities, areas affected, damage, and death totals. Deaths in parentheses are additional and indirect (an example of an indirect death would be a traffic accident), but were still related to that storm. Damage and deaths include totals while the storm was extratropical, a wave, or a low, and all of the damage figures are in 2009 USD.

Saffir–Simpson scale
TDTSC1C2C3C4C5
2009 North Atlantic tropical cyclone season statistics
Storm
name
Dates activeStorm category
at peak intensity
Max 1-min
wind
mph (km/h)
Min.
press.
(mbar)
Areas affectedDamage
(USD)
DeathsRef(s)
OneMay 28–29Tropical depression35 (55)1006 North Carolina NoneNone
Ana August 11–16Tropical storm40 (65)1003 Lesser Antilles, Puerto Rico, Hispaniola, Cuba, The Bahamas MinimalNone
Bill August 15–24Category 4 hurricane130 (215)943 Leeward Islands, Puerto Rico, Hispaniola, United States East Coast, Bermuda, Atlantic Canada, British Isles $46.2 million2
Claudette August 16–18Tropical storm60 (95)1005 Southeastern United States $350,0002
Danny August 26–29Tropical storm60 (95)1006 North Carolina, Northeastern United States, Atlantic Canada Minimal1
Erika September 1–3Tropical storm50 (85)1004 Lesser Antilles, Puerto Rico, Dominican Republic $35,000None
Fred September 7–12Category 3 hurricane120 (195)958 Cape Verde NoneNone
EightSeptember 25–26Tropical depression35 (55)1008NoneNoneNone
Grace October 4–6Tropical storm65 (100)986 Azores, Portugal, British Isles MinimalNone
HenriOctober 6–8Tropical storm50 (85)1005Lesser Antilles, Greater Antilles NoneNone
Ida November 4–10Category 2 hurricane105 (165)975Central America, Cayman Islands, Yucatán Peninsula, Cuba, Southeastern United States $11.4 million4
Season aggregates
11 systemsMay 28 – November 10 130 (215)943~$57.99 million9 

See also

Related Research Articles

<span class="mw-page-title-main">2004 Atlantic hurricane season</span>

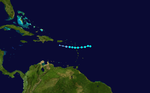
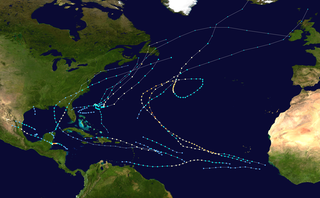
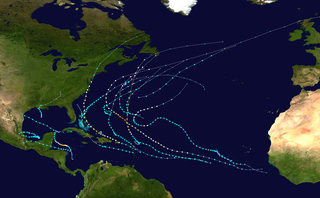
The 2004 Atlantic hurricane season was a very deadly, destructive, and active Atlantic hurricane season, with over 3,200 deaths and more than $61 billion in damage. More than half of the 16 tropical cyclones brushed or struck the United States. Due to the development of a Modoki El Niño – a rare type of El Niño in which unfavorable conditions are produced over the eastern Pacific instead of the Atlantic basin due to warmer sea surface temperatures farther west along the equatorial Pacific – activity was above average. The season officially began on June 1 and ended on November 30, though the season's last storm, Otto, dissipated on December 3, extending the season beyond its traditional boundaries. The first storm, Alex, developed offshore of the Southeastern United States on July 31, one of the latest dates on record to see the formation of the first system in an Atlantic hurricane season. It brushed the Carolinas and the Mid-Atlantic, causing one death and $7.5 million (2004 USD) in damage. Several storms caused only minor damage, including tropical storms Bonnie, Earl, Hermine, and Matthew. In addition, hurricanes Danielle, Karl, and Lisa, Tropical Depression Ten, Subtropical Storm Nicole and Tropical Storm Otto had no effect on land while tropical cyclones. The season was the first to exceed 200 units in accumulated cyclone energy (ACE) since 1995, mostly from Hurricane Ivan, the storm produced the highest ACE. Ivan generated the second-highest ACE in the Atlantic, only behind 1899 San Ciriaco Hurricane.

<span class="mw-page-title-main">2003 Atlantic hurricane season</span>

The 2003 Atlantic hurricane season was a very active season with tropical cyclogenesis occurring before and after the official bounds of the season—the first such occurrence since the 1970 season. The season produced 21 tropical cyclones, of which 16 developed into named storms; seven of those attained hurricane status, of which three reached major hurricane status. The strongest hurricane of the season was Hurricane Isabel, which reached Category 5 status on the Saffir–Simpson hurricane scale northeast of the Lesser Antilles; Isabel later struck North Carolina as a Category 2 hurricane, causing $3.6 billion in damage and a total of 51 deaths across the Mid-Atlantic region of the United States.

<span class="mw-page-title-main">2002 Atlantic hurricane season</span>

The 2002 Atlantic hurricane season was a near-average Atlantic hurricane season. It officially started on June 1, 2002, and ended on November 30, dates which conventionally limit the period of each year when most tropical cyclones develop in the Atlantic Ocean. The season produced fourteen tropical cyclones, of which twelve developed into named storms; four became hurricanes, and two attained major hurricane status. While the season's first cyclone did not develop until July 14, activity quickly picked up: eight storms developed in the month of September. It ended early however, with no tropical storms forming after October 6—a rare occurrence caused partly by El Niño conditions. The most intense hurricane of the season was Hurricane Isidore with a minimum central pressure of 934 mbar, although Hurricane Lili attained higher winds and peaked at Category 4 whereas Isidore only reached Category 3. However, Lili had a minimum central pressure of 938 mbar.

<span class="mw-page-title-main">2001 Atlantic hurricane season</span>

The 2001 Atlantic hurricane season was a fairly active Atlantic hurricane season that produced 17 tropical cyclones, 15 named storms, nine hurricanes, and four major hurricanes. The season officially lasted from June 1, 2001, to November 30, 2001, dates which by convention limit the period of each year when tropical cyclones tend to form in the Atlantic Ocean basin. The season began with Tropical Storm Allison on June 4, and ended with Hurricane Olga, which dissipated on December 6.

<span class="mw-page-title-main">2000 Atlantic hurricane season</span>

The 2000 Atlantic hurricane season was a fairly active hurricane season, but featured the latest first named storm in a hurricane season since 1992. The hurricane season officially began on June 1, and ended on November 30. It was slightly above average due to a La Niña weather pattern although most of the storms were weak. It was also the only season to have two of the storms affect Ireland. The first cyclone, Tropical Depression One, developed in the southern Gulf of Mexico on June 7 and dissipated after an uneventful duration. However, it would be almost two months before the first named storm, Alberto, formed near Cape Verde; Alberto also dissipated with no effects on land. Several other tropical cyclones—Tropical Depression Two, Tropical Depression Four, Chris, Ernesto, Nadine, and an unnamed subtropical storm—did not impact land. Five additional storms—Tropical Depression Nine, Florence, Isaac, Joyce, and Leslie—minimally affected land areas.

<span class="mw-page-title-main">1997 Atlantic hurricane season</span>

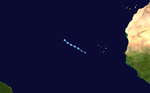
The 1997 Atlantic hurricane season was a below-average hurricane season. It officially began on June 1, and lasted until November 30 of that year. These dates conventionally delimit the period of each year when most tropical cyclones form in the Atlantic basin. The 1997 season was fairly inactive, with only seven named storms forming, with an additional tropical depression and an unnumbered subtropical storm. It was the first time since the 1961 season that there were no active tropical cyclones in the Atlantic basin during the entire month of August–historically one of the more active months of the season—a phenomenon that would not occur again until 2022. A strong El Niño is credited with reducing activity in the Atlantic, while increasing the number of storms in the eastern and western Pacific basins to 19 and 26 storms, respectively. As is common in El Niño years, tropical cyclogenesis was suppressed in the tropical latitudes, with only two becoming tropical storms south of 25°N.

<span class="mw-page-title-main">1986 Atlantic hurricane season</span>

The 1986 Atlantic hurricane season was a very inactive season that produced 10 depressions, 6 named storms, 4 hurricanes, and no major hurricanes. The season officially began on June 1, 1986, and lasted until November 30, 1986. These dates conventionally delimit the period of each year when most tropical cyclones form in the Atlantic basin. During the 1986 season, the first subtropical depression formed in the first week of June, while the last tropical cyclone dissipated at the end of the third week of November. The 1986 season had lower than average activity because of an ongoing El Niño event, and was the least active season in the North Atlantic since the 1983 Atlantic hurricane season. This was also the first season since 1972 to have no major hurricanes.

<span class="mw-page-title-main">1985 Atlantic hurricane season</span>

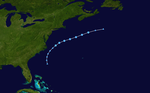
The 1985 Atlantic hurricane season had six United States landfalling hurricanes, tied with 1886 and 2020 for the highest number on record. The season officially began on June 1 and lasted until November 30. It was an average season, with 11 named storms developing. This was partially attributed to a La Niña – a meteorological phenomenon that produces favorable conditions across the Atlantic basin, such as lower wind shear and higher sea surface temperatures. The first storm, Ana, developed on July 15 near Bermuda and caused minor effects in Canada while transitioning into an extratropical cyclone. Three other tropical cyclones – Claudette, Henri, and Isabel – did not significantly affect land. Claudette developed offshore of the Southeastern United States and brushed Bermuda and the Azores. Henri and Isabel were dissipating as they approached land. However, the precursor of the latter caused a severe flood in Puerto Rico that killed 180 people. Additionally, Tropical Storm Fabian and three tropical depressions did not have any known impact on land.

<span class="mw-page-title-main">2005 Atlantic hurricane season</span>

The 2005 Atlantic hurricane season was the most active year on record until surpassed by 2020. It featured 28 tropical or subtropical storms. The United States National Hurricane Center named 27 storms, exhausting the annual pre-designated list, requiring the use of six Greek letter names, and adding an additional unnamed storm during a post-season re-analysis. A record 15 storms attained hurricane status, with maximum sustained winds of at least 74 miles per hour (119 km/h). Of those, a record seven became major hurricanes, rated Category 3 or higher on the Saffir–Simpson scale. Four storms of this season became Category 5 hurricanes, the highest ranking.

<span class="mw-page-title-main">2006 Atlantic hurricane season</span>

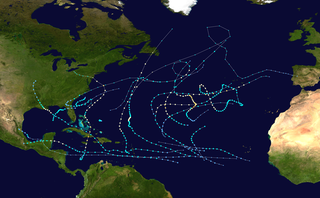
The 2006 Atlantic hurricane season was the least active in the basin since 1997, with nine named storms as well as an additional unnamed tropical storm identified by the National Hurricane Center. 2006 was the first season since 2001 in which no hurricanes made landfall in the United States, and was the first since 1994 in which no tropical cyclones formed during October. Following the intense activity of 2003, 2004, and 2005, forecasters predicted that the 2006 season would be only slightly less active. Instead, it turned out to be a below average season, as activity was slowed by a rapidly forming moderate El Niño event, the presence of the Saharan Air Layer over the tropical Atlantic, and the steady presence of a robust secondary high-pressure area to the Azores High centered on Bermuda. There were no tropical cyclones after October 2.

<span class="mw-page-title-main">2007 Atlantic hurricane season</span>

The 2007 Atlantic hurricane season was the first season since 2003 to feature tropical activity both before and after the official bounds of the season. There were an above-average number of named storms during the season – 15, however many storms were weak and short-lived. Despite the predominance of weak systems, this was the first season on record to feature more than one Category 5 landfalling hurricane. This would not happen again until 2017. It produced 17 tropical cyclones, 15 tropical storms, six hurricanes, and two major hurricanes. It officially started on June 1 and ended on November 30, dates which conventionally delimit the period during which most tropical cyclones form in the Atlantic Ocean, although as shown by Subtropical Storm Andrea and Tropical Storm Olga in early May and early December, respectively, the formation of tropical cyclones is possible at any time of the year. The first system, Subtropical Storm Andrea, developed on May 9, while the last storm, Tropical Storm Olga, dissipated on December 13. The most intense hurricane, Dean, was, at the time, the third most intense landfalling Atlantic storm on record. It was the second on record in which an Atlantic hurricane, Felix, and an eastern Pacific hurricane, Henriette, made landfall on the same day. September had a then record-tying eight storms, until it was surpassed in 2020. However, the strengths and durations of most of the storms were low.

<span class="mw-page-title-main">2008 Atlantic hurricane season</span>

The 2008 Atlantic hurricane season was the most destructive Atlantic hurricane season since 2005, causing over 1,000 deaths and nearly $50 billion in damage. The season ranked as the third costliest ever at the time, but has since fallen to ninth costliest. It was an above-average season, featuring sixteen named storms, eight of which became hurricanes, and five which further became major hurricanes. It officially started on June 1 and ended on November 30. These dates conventionally delimit the period of each year when most tropical cyclones form in the Atlantic basin. However, the formation of Tropical Storm Arthur caused the season to start one day early. It was the only year on record in which a major hurricane existed in every month from July through November in the North Atlantic. Bertha became the longest-lived July tropical cyclone on record for the basin, the first of several long-lived systems during 2008.

<span class="mw-page-title-main">Timeline of the 2009 Atlantic hurricane season</span>

The 2009 Atlantic hurricane season was an event in the annual tropical cyclone season in the North Atlantic Ocean. It was a below-average Atlantic hurricane season with nine named storms, the fewest since the 1997 season. The season officially began on June 1, 2009, and ended on November 30, 2009, dates that conventionally delimit the period of each year when most tropical cyclones develop in the Atlantic basin. The first storm to form was Tropical Depression One on May 28, 2009, while the last storm, Hurricane Ida, dissipated on November 10.

<span class="mw-page-title-main">2011 Atlantic hurricane season</span>

The 2011 Atlantic hurricane season was the second in a group of three very active Atlantic hurricane seasons, each with 19 named storms, only behind 1887, 1995, 2010, and 2012. The above-average activity was mostly due to a La Niña that persisted during the previous year. Of the season's 19 tropical storms, only seven strengthened into hurricanes, and four of those became major hurricanes: Irene, Katia, Ophelia, and Rina. The season officially began on June 1 and ended on November 30, dates which conventionally delimit the period during each year in which most tropical cyclones develop in the Atlantic Ocean. However, the first tropical storm of the season, Arlene, did not develop until nearly a month later. The final system, Tropical Storm Sean, dissipated over the open Atlantic on November 11.

<span class="mw-page-title-main">2010 Atlantic hurricane season</span>

The 2010 Atlantic hurricane season was the first of three consecutive very active Atlantic hurricane seasons, each with 19 named storms. This above average activity included 12 hurricanes, equaling the number that formed in 1969. Only the 2020 and 2005 seasons have had more, at 14 and 15 hurricanes respectively. Despite the high number of hurricanes, not one hurricane hit the United States making the season the only season with 10 or more hurricanes without a United States landfall. The overall tropical cyclone count in the Atlantic exceeded that in the West Pacific for only the second time on record. The season officially began on June 1 and ended on November 30, dates that conventionally delimit the period during each year when tropical cyclone formation is most likely. The first cyclone, Alex intensified into the first June hurricane since Allison in 1995. The month of September featured eight named storms. October featured five hurricanes, including Tomas, which became the latest on record in a calendar year to move through the Windward Islands. Activity was represented with an accumulated cyclone energy (ACE) value of 165 units, which was the eleventh highest value on record at the time. The activity in 2010 was heightened due to a very strong La Niña, which also led to an inactive Pacific hurricane season.

<span class="mw-page-title-main">2012 Atlantic hurricane season</span>

The 2012 Atlantic hurricane season was the final year in a string of three consecutive very active seasons since 2010, with 19 tropical storms. The 2012 season was also a costly one in terms of property damage, mostly due to Hurricane Sandy. The season officially began on June 1 and ended on November 30, dates that conventionally delimit the period during each year in which most tropical cyclones form in the Atlantic Ocean. However, Alberto, the first named system of the year, developed on May 19 – the earliest date of formation since Subtropical Storm Andrea in 2007. A second tropical cyclone, Beryl, developed later that month. This was the first occurrence of two pre-season named storms in the Atlantic basin since 1951. It moved ashore in North Florida on May 29 with winds of 65 mph (105 km/h), making it the strongest pre-season storm to make landfall in the Atlantic basin. This season marked the first time since 2009 where no tropical cyclones formed in July. Another record was set by Hurricane Nadine later in the season; the system became the fourth-longest-lived tropical cyclone ever recorded in the Atlantic, with a total duration of 22.25 days. The final storm to form, Tony, dissipated on October 25 – however, Hurricane Sandy, which formed before Tony, became extratropical on October 29.

<span class="mw-page-title-main">2015 Atlantic hurricane season</span>

The 2015 Atlantic hurricane season was the last of three consecutive below average Atlantic hurricane seasons. It produced twelve tropical cyclones, eleven named storms, four hurricanes, and two major hurricanes. The Accumulated Cyclone Energy (ACE) for the season was 68% of the long-term median value. The hurricane season officially began on June 1, 2015, and ended on November 30, 2015. These dates historically describe the period each year when most tropical cyclones form in the North Atlantic basin. However, the first named storm, Ana, developed on May 8, nearly a month before the official start of the season, the first pre-season cyclone since Beryl in 2012 and the earliest since Ana in 2003. The formation of Ana marked the start of a series of seven consecutive seasons with pre-season activity, spanning from 2015 to 2021. The season concluded with Kate transitioning into an extratropical cyclone on November 11, almost three weeks before the official end.

<span class="mw-page-title-main">2013 Atlantic hurricane season</span>

The 2013 Atlantic hurricane season was a well below average Atlantic hurricane season in terms of the number of hurricanes. It was the first since 1994 with no major hurricanes, Category 3 or higher on the Saffir–Simpson scale, and the first in the satellite era where no hurricanes reached Category 2 strength. Altogether, the season produced 15 tropical cyclones, of which all but one became a named storm. The season officially began on June 1, 2013, and ended on November 30, 2013. These dates historically describe the period in each year when most tropical cyclogenesis occurs in the North Atlantic and are adopted by convention. The first storm of the season, Andrea, developed on June 5, while the last, an unnamed subtropical storm, dissipated on December 7. Throughout the year, only two storms, Humberto and Ingrid, reached hurricane strength; this was the lowest seasonal total since 1982.

<span class="mw-page-title-main">2016 Atlantic hurricane season</span>

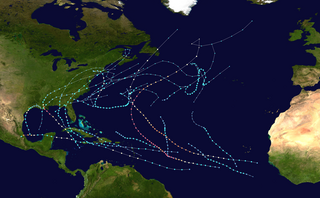
The 2016 Atlantic hurricane season was the first above-average hurricane season since 2012, producing 15 named storms, 7 hurricanes and 4 major hurricanes. The season officially started on June 1 and ended on November 30, though the first storm, Hurricane Alex which formed in the Northeastern Atlantic, developed on January 12, being the first hurricane to develop in January since 1938. The final storm, Otto, crossed into the Eastern Pacific on November 25, a few days before the official end. Following Alex, Tropical Storm Bonnie brought flooding to South Carolina and portions of North Carolina. Tropical Storm Colin in early June brought minor flooding and wind damage to parts of the Southeastern United States, especially Florida. Hurricane Earl left 94 fatalities in the Dominican Republic and Mexico, 81 of which occurred in the latter. In early September, Hurricane Hermine, the first hurricane to make landfall in Florida since Hurricane Wilma in 2005, brought extensive coastal flooding damage especially to the Forgotten and Nature coasts of Florida. Hermine was responsible for five fatalities and about $550 million (2016 USD) in damage.

<span class="mw-page-title-main">2021 Atlantic hurricane season</span>

The 2021 Atlantic hurricane season was the third-most active Atlantic hurricane season on record in terms of number of tropical cyclones, although many of them were weak and short-lived. With 21 named storms forming, it became the second season in a row and third overall in which the designated 21-name list of storm names was exhausted. Seven of those storms strengthened into a hurricane, four of which reached major hurricane intensity, which is slightly above-average. The season officially began on June 1 and ended on November 30. These dates historically describe the period in each year when most Atlantic tropical cyclones form. However, subtropical or tropical cyclogenesis is possible at any time of the year, as demonstrated by the development of Tropical Storm Ana on May 22, making this the seventh consecutive year in which a storm developed outside of the official season.

References

  1. 1 2 National Hurricane Center (November 30, 2009). "Slow Atlantic Hurricane Season Comes to a Close". National Oceanic and Atmospheric Administration. Archived from the original on 1 February 2010. Retrieved January 20, 2010.
  2. "Background Information: The North Atlantic Hurricane Season". National Oceanic and Atmospheric Administration. August 4, 2011. Archived from the original on 2010-08-26. Retrieved December 18, 2011.
  3. Neal Dorst (2009). "Subject: G1) When is hurricane season?". National Hurricane Center. Archived from the original on April 16, 2008. Retrieved January 20, 2010.
  4. 1 2 3 Robbie Berg (June 12, 2009). "Tropical Depression One Tropical Cyclone Report" (PDF). National Hurricane Center . Retrieved January 18, 2010.
  5. 1 2 3 4 Lixion A. Avila and John Cangialosi (January 14, 2010). "Hurricane Ida Tropical Cyclone Report" (PDF). National Hurricane Center. Retrieved January 20, 2010.
  6. 1 2 3 4 5 Lixion A. Avila (January 18, 2010). "Hurricane Bill Tropical Cyclone Report" (PDF). National Hurricane Center. Retrieved January 18, 2010.
  7. 1 2 "North Atlantic Ocean Historical Tropical Cyclone Statistics". Fort Collins, Colorado: Colorado State University. Retrieved July 19, 2023.
  8. Philip J. Klotzbach and William M. Gray (2008-12-10). "Extended Range Forecast of Atlantic Seasonal Hurricane Activity and U.S. Landfall Strike Probability for 2009" (PDF). Colorado State University. Archived (PDF) from the original on May 15, 2009. Retrieved January 1, 2009.
  9. Atlantic basin Comparison of Original and Revised HURDAT. Hurricane Research Division; Atlantic Oceanographic and Meteorological Laboratory (Report). Miami, Florida: National Oceanic and Atmospheric Administration. September 2021. Retrieved September 29, 2021.
  10. National Hurricane Center (May 22, 2008). "NOAA Atlantic Hurricane Season Classifications". National Oceanic and Atmospheric Administration. Archived from the original on August 15, 2009. Retrieved April 14, 2009.
  11. William M. Gray (April 7, 2009). "Mid-Season Forecast of Atlantic Seasonal Hurricane Activity and U.S. Landfall Strike Probability for 2009" (PDF). Colorado State University. Archived (PDF) from the original on 19 April 2009. Retrieved April 7, 2009.
  12. Michael E. Ruane (May 21, 2009). "Government Weather Officials Predict Average 2009 Season". The Washington Post . Retrieved August 16, 2009.
  13. Center for Ocean-Atmospheric Prediction Studies. "FSU COAPS Atlantic Hurricane Season Forecast Archive". Florida State University. Archived from the original on 19 June 2011. Retrieved June 16, 2011.
  14. "Appraisal of the 2009 Met Office seasonal tropical storm forecast for the North Atlantic" (PDF). United Kingdom Meteorological Office. 2009. Retrieved June 18, 2009.
  15. National Hurricane Center (August 6, 2009). "NOAA Lowers Hurricane Season Outlook, Cautions Public Not to Let Down Guard". National Oceanic and Atmospheric Administration. Archived from the original on 1 February 2010. Retrieved February 15, 2010.
  16. Glenn McGillivary (January 2010). "Annus Horriblis, The Sequel" (PDF). Institute for Catastrophe Loss Reduction. Retrieved February 17, 2010.
  17. 1 2 Michael J. Brennan (October 23, 2009). "Hurricane Fred Tropical Cyclone Report" (PDF). National Hurricane Center. Retrieved February 15, 2010.
  18. 1 2 3 4 Robbie Berg (November 28, 2009). "Tropical Storm Grace Tropical Cyclone Report" (PDF). National Hurricane Center. Retrieved February 15, 2010.
  19. "Basin Archives: North Atlantic Ocean Historical Tropical Cyclone Statistics". Fort Collins, Colorado: Colorado State University. Retrieved July 8, 2022.
  20. National Weather Service (2008). "Background Information: The North Atlantic Hurricane Season". National Oceanic and Atmospheric Administration. Archived from the original on 2010-08-26. Retrieved February 15, 2010.
  21. Hurricane Specialists Unit (September 1, 2009). "August 2009 Tropical Weather Summary". National Hurricane Center. Retrieved February 15, 2010.
  22. National Hurricane Center (2009). "Easy-to-Read-HURDAT 1851–2008". National Oceanic and Atmospheric Administration. Retrieved February 15, 2010.
  23. "History for Hatteras, NC: May 27, 2009 Weather". Weather Underground. May 27, 2008. Archived from the original on November 4, 2013. Retrieved September 29, 2021.
  24. Rob Nucatola (May 28, 2009). "Tropical Depression One Forms". WCTV. Archived from the original on August 31, 2015. Retrieved May 28, 2009.
  25. 1 2 3 4 Eric S. Blake (September 26, 2009). "Tropical Storm Ana Tropical Cyclone Report" (PDF). National Hurricane Center. Retrieved February 23, 2010.
  26. Staff Writer (August 18, 2009). "República Dominicana respira ante degradación de "Ana" en onda tropical" (in Spanish). Cope. Archived from the original on February 24, 2012. Retrieved February 23, 2010.
  27. Staff Writer (August 17, 2009). "Activan organismos por depresión tropical Ana" (in Spanish). Dominicanos Hoy. Archived from the original on January 29, 2016. Retrieved February 23, 2010.
  28. David M. Roth (2009). "Tropical Storm Ana – August 17–18, 2009". Hydrometeorological Prediction Center. Retrieved February 23, 2010.
  29. Gerardo E. (August 18, 2009). "Ana se deja sentir en la Isla" (in Spanish). El Nuevo Dia. Archived from the original on April 20, 2010. Retrieved February 23, 2010.
  30. "Bermuda placed on alert as Hurricane Bill advances". Taiwan News. Agence France-Presse. August 22, 2009. Retrieved September 29, 2021.
  31. Shelby Sebens (August 22, 2009). "No deaths or major damage as hurricane Bill passes". Star News. Archived from the original on May 21, 2024. Retrieved August 23, 2009.
  32. Russell Drumm (December 3, 2009). "Federal, State Funds Sought for Damage". The East Hampton Star. Archived from the original on December 29, 2010. Retrieved February 17, 2010.
  33. 1 2 Richard J. Pasch (January 5, 2010). "Tropical Storm Claudette Tropical Cyclone Report" (PDF). National Hurricane Center. Retrieved February 28, 2010.
  34. Staff Writer (August 16, 2009). "Severe Weather — Gulf County". WMBB13. Archived from the original on August 17, 2009. Retrieved February 28, 2011.
  35. Stuart Hinson (2009). "Florida Event Report: Storm Surge/Tide". National Climatic Data Center. Archived from the original on 2012-08-05. Retrieved February 15, 2010.
  36. 1 2 "NCDC Storm Events Database". National Climatic Data Center. 2010. Archived from the original on 10 April 2010. Retrieved April 11, 2010.
  37. John L. Beven II (January 6, 2010). "Tropical Storm Danny Tropical Cyclone Report" (PDF). National Hurricane Center. Retrieved February 15, 2010.
  38. "Body of boy missing off Outer Banks recovered". WRAL . September 1, 2009. Archived from the original on 2009-09-04. Retrieved 2009-09-01.
  39. 1 2 Daniel P. Brown (October 29, 2009). "Tropical Storm Erika Tropical Cyclone Report" (PDF). National Hurricane Center. Retrieved February 15, 2010.
  40. Todd B. Kimberlain (October 23, 2009). "Tropical Depression Eight Tropical Cyclone Report" (PDF). National Hurricane Center. Retrieved February 15, 2010.
  41. André Ferreira (October 7, 2009). "'Grace' traz vento e chuva até sexta" (in Portuguese). Cofina Media. Archived from the original on September 7, 2011. Retrieved February 18, 2010.
  42. Tiffany Curnick (October 8, 2009). "Grace Not Typically Tropical, But Parma The Real Deal". Press Association Mediapoint.
  43. "Flash du 8 octobre 2009 : Pluies orageuses" (in French). Météo Belgique. October 8, 2009. Retrieved February 21, 2010.
  44. 1 2 3 4 Eric Blake (November 17, 2009). "Tropical Cyclone Report: Tropical Storm Henri" (PDF). National Hurricane Center . Retrieved December 1, 2009.
  45. Michael Brennan (October 5, 2009). "Tropical Weather Outlook for October 5, 2009". National Hurricane Center. Retrieved February 25, 2021.
  46. Daniel Brown and David Roberts (October 5, 2009). "Tropical Weather Outlook for October 5, 2009". National Hurricane Center. Retrieved February 25, 2021.
  47. Robbie Berg (October 6, 2009). "Tropical Storm Henri Discussion Number 1". National Hurricane Center. Retrieved December 1, 2009.
  48. Eric Blake (October 8, 2009). "Tropical Depression Henri Discussion Number 8". National Hurricane Center. Retrieved December 1, 2009.
  49. Staff Writer (November 6, 2009). "El huracán 'Ida' deja al menos 40.000 damnificados en Nicaragua" (in Spanish). Agence France-Presse. Archived from the original on April 13, 2010. Retrieved February 15, 2009.
  50. Sergio León (November 5, 2009). "Huracán deja estela de daños en la RAAS". La Prensa (in Spanish). Archived from the original on December 26, 2013. Retrieved February 15, 2009.
  51. National Hurricane Center (2008). "Worldwide Tropical Cyclone Names". National Oceanic and Atmospheric Administration. Archived from the original on August 4, 2008. Retrieved August 4, 2008.
  52. National Hurricane Operations Plan (PDF) (Report). Washington, D.C.: NOAA Office of the Federal Coordinator for Meteorological Services and Supporting Research. May 2003. p. 3-8. Retrieved January 21, 2024.
  53. National Hurricane Operations Plan (PDF) (Report). Washington, D.C.: NOAA Office of the Federal Coordinator for Meteorological Services and Supporting Research. May 2004. p. 3-9. Retrieved January 21, 2024.
  54. "Tropical Cyclone Naming History and Retired Names". Miami, Florida: National Hurricane Center. Retrieved January 21, 2024.
  55. "Hurricane names for the 2015 Atlantic season". Raleigh, North Carolina: WRAL-TV. June 1, 2015. Retrieved January 21, 2024.

Notes

  1. An average season, as defined by the National Oceanic and Atmospheric Administration, has twelve tropical storms, six hurricanes and two major hurricanes. [2]
  2. A major hurricane is a storm that ranks as Category 3 or higher on the Saffir–Simpson hurricane scale.