Related Research Articles

A transect is a path along which one counts and records occurrences of the objects of study.
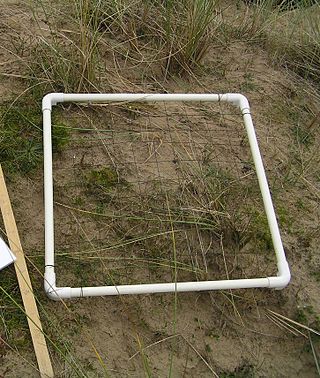
A quadrat is a frame, traditionally square, used in ecology, geography and biology to isolate a standard unit of area for study of the distribution of an item over a large area. Modern quadrats can for example be rectangular, circular, or irregular. The quadrat is suitable for sampling plants, slow-moving animals, and some aquatic organisms.
Species diversity is the number of different species that are represented in a given community. The effective number of species refers to the number of equally abundant species needed to obtain the same mean proportional species abundance as that observed in the dataset of interest. Meanings of species diversity may include species richness, taxonomic or phylogenetic diversity, and/or species evenness. Species richness is a simple count of species. Taxonomic or phylogenetic diversity is the genetic relationship between different groups of species. Species evenness quantifies how equal the abundances of the species are.

The unified neutral theory of biodiversity and biogeography is a theory and the title of a monograph by ecologist Stephen P. Hubbell. It aims to explain the diversity and relative abundance of species in ecological communities. Like other neutral theories of ecology, Hubbell assumes that the differences between members of an ecological community of trophically similar species are "neutral", or irrelevant to their success. This implies that niche differences do not influence abundance and the abundance of each species follows a random walk. The theory has sparked controversy, and some authors consider it a more complex version of other null models that fit the data better.

Species richness is the number of different species represented in an ecological community, landscape or region. Species richness is simply a count of species, and it does not take into account the abundances of the species or their relative abundance distributions. Species richness is sometimes considered synonymous with species diversity, but the formal metric species diversity takes into account both species richness and species evenness.
Spatial ecology studies the ultimate distributional or spatial unit occupied by a species. In a particular habitat shared by several species, each of the species is usually confined to its own microhabitat or spatial niche because two species in the same general territory cannot usually occupy the same ecological niche for any significant length of time.
Leaf area index (LAI) is a dimensionless quantity that characterizes plant canopies. It is defined as the one-sided green leaf area per unit ground surface area in broadleaf canopies. In conifers, three definitions for LAI have been used:
The species–area relationship or species–area curve describes the relationship between the area of a habitat, or of part of a habitat, and the number of species found within that area. Larger areas tend to contain larger numbers of species, and empirically, the relative numbers seem to follow systematic mathematical relationships. The species–area relationship is usually constructed for a single type of organism, such as all vascular plants or all species of a specific trophic level within a particular site. It is rarely if ever, constructed for all types of organisms if simply because of the prodigious data requirements. It is related but not identical to the species discovery curve.
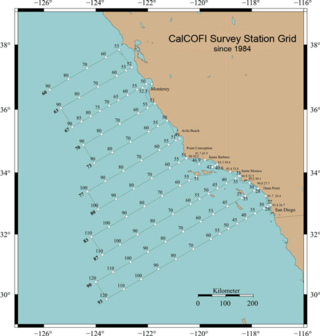
CalCOFI is a multi-agency partnership formed in 1949 to investigate the collapse of the sardine population off California. The organization's members are from NOAA Fisheries Service, Scripps Institution of Oceanography, and California Department of Fish and Wildlife. The scope of this research has evolved into the study of marine ecosystems off California and the management of its fisheries resources. In 2004, the CalCOFI survey area became one of 26 LTER research sites. This time-series of oceanographic and fisheries data allows scientists to assess the human impact and effects of climate change on the coastal ocean ecosystem. CalCOFI hydrographic & biological data, publications, and web information are distributed for use without restriction under the terms of the GNU Free Documentation License.
In spatial ecology and macroecology, scaling pattern of occupancy (SPO), also known as the area-of-occupancy (AOO) is the way in which species distribution changes across spatial scales. In physical geography and image analysis, it is similar to the modifiable areal unit problem. Simon A. Levin (1992) states that the problem of relating phenomena across scales is the central problem in biology and in all of science. Understanding the SPO is thus one central theme in ecology.
The proportionator is the most efficient unbiased stereological method used to estimate population size in samples.
Line plot survey is a systematic sampling technique used on land surfaces for laying out sample plots within a rectangular grid to conduct forest inventory or agricultural research. It is a specific type of systematic sampling, similar to other statistical sampling methods such as random sampling, but more straightforward to carry out in practice.

In statistics, more specifically in biostatistics, line-intercept sampling (LIS) is a method of sampling elements in a region whereby an element is sampled if a chosen line segment, called a “transect”, intersects the element.
Distance sampling is a widely used group of closely related methods for estimating the density and/or abundance of populations. The main methods are based on line transects or point transects. In this method of sampling, the data collected are the distances of the objects being surveyed from these randomly placed lines or points, and the objective is to estimate the average density of the objects within a region.

A pitfall trap is a trapping pit for small animals, such as insects, amphibians and reptiles. Pitfall traps are a sampling technique, mainly used for ecology studies and ecologic pest control. Animals that enter a pitfall trap are unable to escape. This is a form of passive collection, as opposed to active collection where the collector catches each animal. Active collection may be difficult or time-consuming, especially in habitats where it is hard to see the animals such as thick grass.
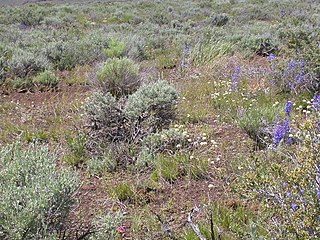
The abundances of plant species are often measured by plant cover, which is the relative area covered by different plant species in a small plot. Plant cover is not biased by the size and distributions of individuals, and is an important and often measured characteristic of the composition of plant communities.
Reef Life Survey is a marine life monitoring programme based in Hobart, Tasmania. It is international in scope, but predominantly Australian, as a large proportion of the volunteers are Australian. Most of the surveys are done by volunteer recreational divers, collecting biodiversity data for marine conservation. The database is available to marine ecology researchers, and is used by several marine protected area managements in Australia, New Zealand, American Samoa and the eastern Pacific.

Butterfly counts are often carried out in North America and Europe to estimate the populations of butterflies in a specific geographical area.
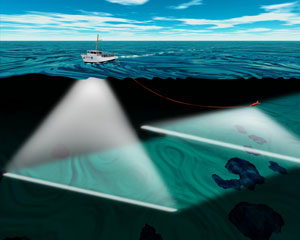
An underwater survey is a survey performed in an underwater environment or conducted remotely on an underwater object or region. Survey can have several meanings. The word originates in Medieval Latin with meanings of looking over and detailed study of a subject. One meaning is the accurate measurement of a geographical region, usually with the intention of plotting the positions of features as a scale map of the region. This meaning is often used in scientific contexts, and also in civil engineering and mineral extraction. Another meaning, often used in a civil, structural, or marine engineering context, is the inspection of a structure or vessel to compare actual condition with the specified nominal condition, usually with the purpose of reporting on the actual condition and compliance with, or deviations from, the nominal condition, for quality control, damage assessment, valuation, insurance, maintenance, and similar purposes. In other contexts it can mean inspection of a region to establish presence and distribution of specified content, such as living organisms, either to establish a baseline, or to compare with a baseline.
References
- ↑ Hill, David Arnold; Matthew Fasham; Graham Tucker; Michael Shewry; Philip Shaw (2005). Handbook of biodiversity methods: survey, evaluation and monitoring. Cambridge, UK: Cambridge University Press. pp. 219–222. ISBN 0-521-82368-4. OCLC 61439712.
- ↑ Fan, Jihui; Liu, Tianyuan; Liao, Ying; Li, Yiying; Yan, Yan; Lu, Xuyang (2021). "Distinguishing Stoichiometric Homeostasis of Soil Microbial Biomass in Alpine Grassland Ecosystems: Evidence From 5,000 km Belt Transect Across Qinghai–Tibet Plateau". Frontiers in Plant Science. 12: 781695. doi: 10.3389/fpls.2021.781695 . ISSN 1664-462X. PMC 8675581 . PMID 34925425.
- ↑ Ecological Sampling Methods
- ↑ Urban Sampling Methods - Barcelona Field Study Center
- 1 2 "How to carry out ecological sampling page 4". www.countrysideinfo.co.uk. Retrieved 2022-11-03.
- ↑ "Difference Between Belt and Line Transect". Compare the Difference Between Similar Terms. 2021-03-17. Retrieved 2022-11-03.