Calculation
Applying the convolution theorem allows fast calculation of the bispectrum: , where denotes the Fourier transform of the signal, and its conjugate.
In mathematics, in the area of statistical analysis, the bispectrum is a statistic used to search for nonlinear interactions.
The Fourier transform of the second-order cumulant, i.e., the autocorrelation function, is the traditional power spectrum.
The Fourier transform of C3(t1, t2) (third-order cumulant-generating function) is called the bispectrum or bispectral density.
Applying the convolution theorem allows fast calculation of the bispectrum: , where denotes the Fourier transform of the signal, and its conjugate.
Bispectrum and bicoherence may be applied to the case of non-linear interactions of a continuous spectrum of propagating waves in one dimension. [1]
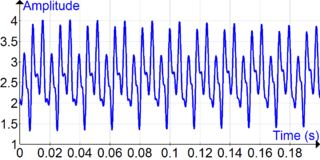
Bispectral measurements have been carried out for EEG signals monitoring. [2] It was also shown that bispectra characterize differences between families of musical instruments. [3]
In seismology, signals rarely have adequate duration for making sensible bispectral estimates from time averages.[ citation needed ]
Bispectral analysis describes observations made at two wavelengths. It is often used by scientists to analyze elemental makeup of a planetary atmosphere by analyzing the amount of light reflected and received through various color filters. By combining and removing two filters, much can be gleaned from only two filters. Through modern computerized interpolation, a third virtual filter can be created to recreate true color photographs that, while not particularly useful for scientific analysis, are popular for public display in textbooks and fund raising campaigns.[ citation needed ]
Bispectral analysis can also be used to analyze interactions between wave patterns and tides on Earth. [4]
A form of bispectral analysis called the bispectral index is applied to EEG waveforms to monitor depth of anesthesia. [5]
Biphase (phase of polyspectrum) can be used for detection of phase couplings, [6] noise reduction of polharmonic (particularly, speech [7] ) signal analysis.
The bispectrum reflects the energy budget of interactions, as it can be interpreted as a covariance defined between energy-supplying and energy-receiving parties of waves involved in an nonlinear interaction. [8] On the other hand, bicoherence has been proven to be the corresponding correlation coefficient. [8] Just as correlation cannot sufficiently demonstrate the presence of causality, spectrum and bicoherence also cannot sufficiently substantiate the existence of an nonlinear interaction.
Bispectra fall in the category of higher-order spectra, or polyspectra and provide supplementary information to the power spectrum. The third order polyspectrum (bispectrum) is the easiest to compute, and hence the most popular.
A statistic defined analogously is the bispectral coherency or bicoherence.
The Fourier transform of C4 (t1, t2, t3) (fourth-order cumulant-generating function) is called the trispectrum or trispectral density.
The trispectrum T(f1,f2,f3) falls into the category of higher-order spectra, or polyspectra, and provides supplementary information to the power spectrum. The trispectrum is a three-dimensional construct. The symmetries of the trispectrum allow a much reduced support set to be defined, contained within the following vertices, where 1 is the Nyquist frequency. (0,0,0) (1/2,1/2,-1/2) (1/3,1/3,0) (1/2,0,0) (1/4,1/4,1/4). The plane containing the points (1/6,1/6,1/6) (1/4,1/4,0) (1/2,0,0) divides this volume into an inner and an outer region. A stationary signal will have zero strength (statistically) in the outer region. The trispectrum support is divided into regions by the plane identified above and by the (f1,f2) plane. Each region has different requirements in terms of the bandwidth of signal required for non-zero values.
In the same way that the bispectrum identifies contributions to a signal's skewness as a function of frequency triples, the trispectrum identifies contributions to a signal's kurtosis as a function of frequency quadruplets.
The trispectrum has been used to investigate the domains of applicability of maximum kurtosis phase estimation used in the deconvolution of seismic data to find layer structure.
In mathematics, Fourier analysis is the study of the way general functions may be represented or approximated by sums of simpler trigonometric functions. Fourier analysis grew from the study of Fourier series, and is named after Joseph Fourier, who showed that representing a function as a sum of trigonometric functions greatly simplifies the study of heat transfer.

In Fourier analysis, the cepstrum is the result of computing the inverse Fourier transform (IFT) of the logarithm of the estimated signal spectrum. The method is a tool for investigating periodic structures in frequency spectra. The power cepstrum has applications in the analysis of human speech.

Millimeter-wave cloud radars, also denominated cloud radars, are radar systems designed to monitor clouds with operating frequencies between 24 and 110 GHz. Accordingly, their wavelengths range from 1 mm to 1.11 cm, about ten times shorter than those used in conventional S band radars such as NEXRAD.

The power spectrum of a time series describes the distribution of power into frequency components composing that signal. According to Fourier analysis, any physical signal can be decomposed into a number of discrete frequencies, or a spectrum of frequencies over a continuous range. The statistical average of any sort of signal as analyzed in terms of its frequency content, is called its spectrum.

In mathematics, deconvolution is the operation inverse to convolution. Both operations are used in signal processing and image processing. For example, it may be possible to recover the original signal after a filter (convolution) by using a deconvolution method with a certain degree of accuracy. Due to the measurement error of the recorded signal or image, it can be demonstrated that the worse the signal-to-noise ratio (SNR), the worse the reversing of a filter will be; hence, inverting a filter is not always a good solution as the error amplifies. Deconvolution offers a solution to this problem.
In sound processing, the mel-frequency cepstrum (MFC) is a representation of the short-term power spectrum of a sound, based on a linear cosine transform of a log power spectrum on a nonlinear mel scale of frequency.
In signal processing and electronics, the frequency response of a system is the quantitative measure of the magnitude and phase of the output as a function of input frequency. The frequency response is widely used in the design and analysis of systems, such as audio and control systems, where they simplify mathematical analysis by converting governing differential equations into algebraic equations. In an audio system, it may be used to minimize audible distortion by designing components so that the overall response is as flat (uniform) as possible across the system's bandwidth. In control systems, such as a vehicle's cruise control, it may be used to assess system stability, often through the use of Bode plots. Systems with a specific frequency response can be designed using analog and digital filters.

A spectrum analyzer measures the magnitude of an input signal versus frequency within the full frequency range of the instrument. The primary use is to measure the power of the spectrum of known and unknown signals. The input signal that most common spectrum analyzers measure is electrical; however, spectral compositions of other signals, such as acoustic pressure waves and optical light waves, can be considered through the use of an appropriate transducer. Spectrum analyzers for other types of signals also exist, such as optical spectrum analyzers which use direct optical techniques such as a monochromator to make measurements.

In mathematics, physics, electronics, control systems engineering, and statistics, the frequency domain refers to the analysis of mathematical functions or signals with respect to frequency, rather than time. Put simply, a time-domain graph shows how a signal changes over time, whereas a frequency-domain graph shows how the signal is distributed within different frequency bands over a range of frequencies. A frequency-domain representation consists of both the magnitude and the phase of a set of sinusoids at the frequency components of the signal. Although it is common to refer to the magnitude portion as the frequency response of a signal, the phase portion is required to uniquely define the signal.
In signal processing, a periodogram is an estimate of the spectral density of a signal. The term was coined by Arthur Schuster in 1898. Today, the periodogram is a component of more sophisticated methods. It is the most common tool for examining the amplitude vs frequency characteristics of FIR filters and window functions. FFT spectrum analyzers are also implemented as a time-sequence of periodograms.
The Fourier transform of a function of time, s(t), is a complex-valued function of frequency, S(f), often referred to as a frequency spectrum. Any linear time-invariant operation on s(t) produces a new spectrum of the form H(f)•S(f), which changes the relative magnitudes and/or angles (phase) of the non-zero values of S(f). Any other type of operation creates new frequency components that may be referred to as spectral leakage in the broadest sense. Sampling, for instance, produces leakage, which we call aliases of the original spectral component. For Fourier transform purposes, sampling is modeled as a product between s(t) and a Dirac comb function. The spectrum of a product is the convolution between S(f) and another function, which inevitably creates the new frequency components. But the term 'leakage' usually refers to the effect of windowing, which is the product of s(t) with a different kind of function, the window function. Window functions happen to have finite duration, but that is not necessary to create leakage. Multiplication by a time-variant function is sufficient.
In mathematics and statistical analysis, bicoherence is a squared normalised version of the bispectrum. The bicoherence takes values bounded between 0 and 1, which make it a convenient measure for quantifying the extent of phase coupling in a signal. The prefix bi- in bispectrum and bicoherence refers not to two time series xt, yt but rather to two frequencies of a single signal.
A cyclostationary process is a signal having statistical properties that vary cyclically with time. A cyclostationary process can be viewed as multiple interleaved stationary processes. For example, the maximum daily temperature in New York City can be modeled as a cyclostationary process: the maximum temperature on July 21 is statistically different from the temperature on December 20; however, it is a reasonable approximation that the temperature on December 20 of different years has identical statistics. Thus, we can view the random process composed of daily maximum temperatures as 365 interleaved stationary processes, each of which takes on a new value once per year.
Geophysical survey is the systematic collection of geophysical data for spatial studies. Detection and analysis of the geophysical signals forms the core of Geophysical signal processing. The magnetic and gravitational fields emanating from the Earth's interior hold essential information concerning seismic activities and the internal structure. Hence, detection and analysis of the electric and Magnetic fields is very crucial. As the Electromagnetic and gravitational waves are multi-dimensional signals, all the 1-D transformation techniques can be extended for the analysis of these signals as well. Hence this article also discusses multi-dimensional signal processing techniques.
The triple correlation of an ordinary function on the real line is the integral of the product of that function with two independently shifted copies of itself:
The method of reassignment is a technique for sharpening a time-frequency representation by mapping the data to time-frequency coordinates that are nearer to the true region of support of the analyzed signal. The method has been independently introduced by several parties under various names, including method of reassignment, remapping, time-frequency reassignment, and modified moving-window method. In the case of the spectrogram or the short-time Fourier transform, the method of reassignment sharpens blurry time-frequency data by relocating the data according to local estimates of instantaneous frequency and group delay. This mapping to reassigned time-frequency coordinates is very precise for signals that are separable in time and frequency with respect to the analysis window.
In statistical signal processing, the goal of spectral density estimation (SDE) or simply spectral estimation is to estimate the spectral density of a signal from a sequence of time samples of the signal. Intuitively speaking, the spectral density characterizes the frequency content of the signal. One purpose of estimating the spectral density is to detect any periodicities in the data, by observing peaks at the frequencies corresponding to these periodicities.
The Hilbert–Huang transform (HHT) is a way to decompose a signal into so-called intrinsic mode functions (IMF) along with a trend, and obtain instantaneous frequency data. It is designed to work well for data that is nonstationary and nonlinear. In contrast to other common transforms like the Fourier transform, the HHT is an algorithm that can be applied to a data set, rather than a theoretical tool.
In statistics, Whittle likelihood is an approximation to the likelihood function of a stationary Gaussian time series. It is named after the mathematician and statistician Peter Whittle, who introduced it in his PhD thesis in 1951. It is commonly used in time series analysis and signal processing for parameter estimation and signal detection.
Two-dimensional electronic spectroscopy (2DES) is an ultrafast laser spectroscopy technique that allows the study of ultrafast phenomena inside systems in condensed phase. The term electronic refers to the fact that the optical frequencies in the visible spectral range are used to excite electronic energy states of the system; however, such a technique is also used in the IR optical range and in this case the method is called two-dimensional infrared spectroscopy (2DIR). This technique records the signal which is emitted from a system after an interaction with a sequence of 3 laser pulses. Such pulses usually have a time duration of few hundred femtosecond and this high time resolution allows capturing of dynamics inside the system that evolves with the same time scale. The main result of this technique is a two-dimensional absorption spectrum that shows the correlation between excitation and detection frequencies. The first 2DES spectra were recorded in 1998


