
Skywarn is a program of the National Weather Service (NWS). Its mission is to collect reports of localized severe weather in the United States. These reports are used to aid forecasters in issuing and verifying severe weather watches and warnings and to improve the forecasting and warning processes and the tools used to collect meteorological data. Reports are also used by local emergency managers and public safety organizations.

An ice storm, also known as a glaze event or a silver storm, is a type of winter storm characterized by freezing rain. The U.S. National Weather Service defines an ice storm as a storm which results in the accumulation of at least 0.25-inch (6.4 mm) of ice on exposed surfaces. They are generally not violent storms but instead are commonly perceived as gentle rains occurring at temperatures just below freezing.

The National Weather Service (NWS) is an agency of the United States federal government that is tasked with providing weather forecasts, warnings of hazardous weather, and other weather-related products to organizations and the public for the purposes of protection, safety, and general information. It is a part of the National Oceanic and Atmospheric Administration (NOAA) branch of the Department of Commerce, and is headquartered in Silver Spring, Maryland, within the Washington metropolitan area. The agency was known as the United States Weather Bureau from 1890 until it adopted its current name in 1970.

METAR is a format for reporting weather information. A METAR weather report is predominantly used by aircraft pilots, and by meteorologists, who use aggregated METAR information to assist in weather forecasting. Today, according to the advancement of technology in civil aviation, the METAR is sent as IWXXM model.

Weather radar, also called weather surveillance radar (WSR) and Doppler weather radar, is a type of radar used to locate precipitation, calculate its motion, and estimate its type. Modern weather radars are mostly pulse-Doppler radars, capable of detecting the motion of rain droplets in addition to the intensity of the precipitation. Both types of data can be analyzed to determine the structure of storms and their potential to cause severe weather.
The Weather Prediction Center (WPC), located in College Park, Maryland, is one of nine service centers under the umbrella of the National Centers for Environmental Prediction (NCEP), a part of the National Weather Service (NWS), which in turn is part of the National Oceanic and Atmospheric Administration (NOAA) of the U.S. Government. Until March 5, 2013 the Weather Prediction Center was known as the Hydrometeorological Prediction Center (HPC). The Weather Prediction Center serves as a center for quantitative precipitation forecasting, medium range forecasting, and the interpretation of numerical weather prediction computer models.
The National Severe Storms Laboratory (NSSL) is a National Oceanic and Atmospheric Administration (NOAA) weather research laboratory under the Office of Oceanic and Atmospheric Research. It is one of seven NOAA Research Laboratories (RLs).
Weather spotting is observing weather for the purpose of reporting to a larger group or organization. Examples include National Weather Service (NWS) co-op observers and Skywarn storm spotters.
The NOAA Environmental Real-time Observation Network (NERON) is a project to establish a nationwide network of high quality near real-time weather monitoring stations across the United States. A 20-mile by 20-mile grid has been established, with the hopes of having one observation system within each grid cell. Effort is being put forth by local National Weather Service (NWS) offices and other state climate groups to ensure that sites in the network meet important criteria. The network will be composed of existing, and in some cases upgraded, sites as well as new sites being established for other local and state efforts. Many stations in New England and New York have already been installed.

The Citizen Weather Observer Program (CWOP) is a network of privately owned electronic weather stations concentrated in the United States but also located in over 150 countries. Network participation allows volunteers with computerized weather stations to send automated surface weather observations to the National Weather Service (NWS) by way of the Meteorological Assimilation Data Ingest System (MADIS). This data is then used by the Rapid Refresh (RAP) forecast model to produce short term forecasts of conditions across the contiguous United States. Observations are also redistributed to the public.

Meteorological instruments, including meteorological sensors, are the equipment used to find the state of the atmosphere at a given time. Each science has its own unique sets of laboratory equipment. Meteorology, however, is a science which does not use much laboratory equipment but relies more on on-site observation and remote sensing equipment. In science, an observation, or observable, is an abstract idea that can be measured and for which data can be taken. Rain was one of the first quantities to be measured historically. Two other accurately measured weather-related variables are wind and humidity. Many attempts had been made prior to the 15th century to construct adequate equipment to measure atmospheric variables.
Convective storm detection is the meteorological observation, and short-term prediction, of deep moist convection (DMC). DMC describes atmospheric conditions producing single or clusters of large vertical extension clouds ranging from cumulus congestus to cumulonimbus, the latter producing thunderstorms associated with lightning and thunder. Those two types of clouds can produce severe weather at the surface and aloft.

Spring Creek is a 12.7-mile-long (20.4 km) tributary of the Cache La Poudre River in the state of Colorado in the United States.
Storm spotting is a form of weather spotting in which observers watch for the approach of severe weather, monitor its development and progression, and actively relay their findings to local authorities.
The Spotter Network (SN) is a system that utilizes storm spotter and chaser reports of location and severe weather in a centralized framework for use by coordinators such as emergency managers, Skywarn and related spotter organizations, and the National Weather Service. It uses GPS to provide accurate and automated position data of storm spotters and chasers for coordination and reporting, which in turn provides ground truth to public servants engaged in the protection of life and property. The network is a combination of locally installed software for position and status reporting and web-based processing, mapping, and reporting.
The Significant Weather Observing Program (SWOP) was created at the National Weather Service (NWS) Weather Forecast Office (WFO) in Central Illinois in order to provide forecasters with additional data during and after significant weather events.
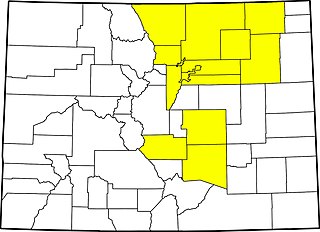
The 2013 Colorado floods were a series of natural disasters occurring in the U.S. state of Colorado. Starting on September 11, 2013, a slow-moving cold front stalled over Colorado, clashing with warm humid monsoonal air from the south. This resulted in heavy rain and catastrophic flooding along Colorado's Front Range from Colorado Springs north to Fort Collins. The situation intensified on September 11 and 12. Boulder County was worst hit, with 9.08 inches (231 mm) recorded September 12 and up to 18 inches (460 mm) of rain recorded by September 15, which is comparable to Boulder County's average annual precipitation. This event has also been referred to as the 2013 Colorado Front Range Flood, reflecting a more precise geographic extent in and along the Colorado Front Range mountains.

The bill H.R. 3174, long title "To authorize the Secretary of Transportation to obligate funds for emergency relief projects arising from damage caused by severe weather events in 2013, and for other purposes," is a bill that was introduced in the United States House of Representatives during the 113th United States Congress. The bill would allow the United States Department of Transportation to "exceed a $100 million cap on grants to repair roads damaged by a national emergency." The bill was written in response to the 2013 Colorado floods, which caused as much as $500 million worth of damage to Colorado's roads.

The NOAA Cooperative Observer Program (COOP) is a citizen weather observer network run by the U.S. National Weather Service (NWS) and National Centers for Environmental Information (NCEI). Over 8,700 volunteers from the fifty states and all territories report at least daily a variety of weather conditions such as daily maximum and minimum temperatures, 24-hour precipitation totals, including snowfall, and significant weather occurrences throughout a day that are recorded via remarks in observer logs. Some stations also report stream stage or tidal levels.
In a two-day period on July 27–28, 1997, heavy rainfall caused an overflow of the Spring Creek near Fort Collins, Colorado, United States. Stalled convection over the city produced heavy rainfall of up to 14.5 inches (370 mm) across western portions of Fort Collins, causing a flash flood which damaged areas along Spring Creek. Numerous buildings at Colorado State University were inundated by floodwaters, sustaining over US$100 million in damage. Five people were killed, 62 were injured, and damage totaled in excess of $250 million, including more than 2,000 businesses and homes being damaged or destroyed. The flood is the worst natural disaster to impact the Fort Collins, Colorado, area.
