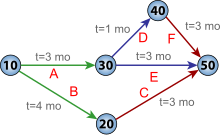
PERT chart for a project with five milestones (10 through 50) and six activities (A through F). The project has two critical paths: activities B and C, or A, D, and F – giving a minimum project time of 7 months with fast tracking. Activity E is sub-critical, and has a float of 1 month.
The critical path method (CPM), or critical path analysis (CPA), is an algorithm for scheduling a set of project activities.[1] A critical path is determined by identifying the longest stretch of dependent activities and measuring the time[2] required to complete them from start to finish. It is commonly used in conjunction with the program evaluation and review technique (PERT).
The CPM is a project-modeling technique developed in the late 1950s by Morgan R. Walker of DuPont and James E. Kelley Jr. of Remington Rand.[3] Kelley and Walker related their memories of the development of CPM in 1989.[4] Kelley attributed the term "critical path" to the developers of the PERT, which was developed at about the same time by Booz Allen Hamilton and the U.S. Navy.[5] The precursors of what came to be known as critical path were developed and put into practice by DuPont between 1940 and 1943 and contributed to the success of the Manhattan Project.[6]
Critical path analysis is commonly used with all forms of projects, including construction, aerospace and defense, software development, research projects, product development, engineering, and plant maintenance, among others. Any project with interdependent activities can apply this method of mathematical analysis. CPM was used for the first time in 1966 for the major skyscraper development of constructing the former World Trade Center Twin Towers in New York City. Although the original CPM program and approach is no longer used,[7] the term is generally applied to any approach used to analyze a project network logic diagram.
Basic techniques
Components
The essential technique for using CPM[8][9] is to construct a model of the project that includes:
A list of all activities required to complete the project (typically categorized within a work breakdown structure)
The time (duration) that each activity will take to complete
The dependencies between the activities
Logical end points such as milestones or deliverable items
Using these values, CPM calculates the longest path of planned activities to logical end points or to the end of the project, and the earliest and latest that each activity can start and finish without making the project longer. This process determines which activities are "critical" (i.e., on the longest path) and which have "total float" (i.e., can be delayed without making the project longer). In project management, a critical path is the sequence of project network activities that adds up to the longest overall duration, regardless of whether that longest duration has float or not. This determines the shortest time possible to complete the project. "Total float" (unused time) can occur within the critical path. For example, if a project is testing a solar panel and task 'B' requires 'sunrise', a scheduling constraint on the testing activity could be that it would not start until the scheduled time for sunrise. This might insert dead time (total float) into the schedule on the activities on that path prior to the sunrise due to needing to wait for this event. This path, with the constraint-generated total float, would actually make the path longer, with total float being part of the shortest possible duration for the overall project. In other words, individual tasks on the critical path prior to the constraint might be able to be delayed without elongating the critical path; this is the total float of that task, but the time added to the project duration by the constraint is actually critical path drag, the amount by which the project's duration is extended by each critical path activity and constraint.
A project can have several, parallel, near-critical paths, and some or all of the tasks could have free float and/or total float. An additional parallel path through the network with the total durations shorter than the critical path is called a subcritical or noncritical path. Activities on subcritical paths have no drag, as they are not extending the project's duration.
CPM analysis tools allow a user to select a logical end point in a project and quickly identify its longest series of dependent activities (its longest path). These tools can display the critical path (and near-critical path activities if desired) as a cascading waterfall that flows from the project's start (or current status date) to the selected logical end point.
Visualizing critical path schedule
Although the activity-on-arrow diagram (PERT chart) is still used in a few places, it has generally been superseded by the activity-on-node diagram, where each activity is shown as a box or node and the arrows represent the logical relationships going from predecessor to successor as shown here in the "Activity-on-node diagram".
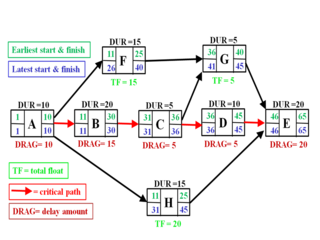
Activity-on-node diagram showing critical path schedule, along with total float and critical path drag computations
In this diagram, Activities A, B, C, D, and E comprise the critical or longest path, while Activities F, G, and H are off the critical path with floats of 15 days, 5 days, and 20 days respectively. Whereas activities that are off the critical path have float and are therefore not delaying completion of the project, those on the critical path will usually have critical path drag, i.e., they delay project completion. The drag of a critical path activity can be computed using the following formula:
If a critical path activity has nothing in parallel, its drag is equal to its duration. Thus A and E have drags of 10 days and 20 days respectively.
If a critical path activity has another activity in parallel, its drag is equal to whichever is less: its duration or the total float of the parallel activity with the least total float. Thus since B and C are both parallel to F (float of 15) and H (float of 20), B has a duration of 20 and drag of 15 (equal to F's float), while C has a duration of only 5 days and thus drag of only 5. Activity D, with a duration of 10 days, is parallel to G (float of 5) and H (float of 20) and therefore its drag is equal to 5, the float of G.
These results, including the drag computations, allow managers to prioritize activities for the effective management of project, and to shorten the planned critical path of a project by pruning critical path activities, by "fast tracking" (i.e., performing more activities in parallel), and/or by "crashing the critical path" (i.e., shortening the durations of critical path activities by adding resources).
Critical path drag analysis has also been used to optimize schedules in processes outside of strict project-oriented contexts, such as to increase manufacturing throughput by using the technique and metrics to identify and alleviate delaying factors and thus reduce assembly lead time.[10]
Crash duration
"Crash duration" is a term referring to the shortest possible time for which an activity can be scheduled.[11] It can be achieved by shifting more resources towards the completion of that activity, resulting in decreased time spent and often a reduced quality of work, as the premium is set on speed.[12] Crash duration is typically modeled as a linear relationship between cost and activity duration, but in many cases, a convex function or a step function is more applicable.[13]
Originally, the critical path method considered only logical dependencies between terminal elements. Since then, it has been expanded to allow for the inclusion of resources related to each activity, through processes called activity-based resource assignments and resource optimization techniques such as Resource Leveling and Resource smoothing. A resource-leveled schedule may include delays due to resource bottlenecks (i.e., unavailability of a resource at the required time), and may cause a previously shorter path to become the longest or most "resource critical" path while a resource-smoothed schedule avoids impacting the critical path by using only free and total float.[14] A related concept is called the critical chain, which attempts to protect activity and project durations from unforeseen delays due to resource constraints.
Since project schedules change on a regular basis, CPM allows continuous monitoring of the schedule, which allows the project manager to track the critical activities, and alerts the project manager to the possibility that non-critical activities may be delayed beyond their total float, thus creating a new critical path and delaying project completion. In addition, the method can easily incorporate the concepts of stochastic predictions, using the PERT and event chain methodology.
Currently, there are several software solutions available in industry that use the CPM method of scheduling; see list of project management software. The method currently used by most project management software is based on a manual calculation approach developed by Fondahl of Stanford University.
Flexibility
A schedule generated using the critical path techniques often is not realized precisely, as estimations are used to calculate times: if one mistake is made, the results of the analysis may change. This could cause an upset in the implementation of a project if the estimates are blindly believed, and if changes are not addressed promptly. However, the structure of critical path analysis is such that the variance from the original schedule caused by any change can be measured, and its impact either ameliorated or adjusted for. Indeed, an important element of project postmortem analysis is the 'as built critical path' (ABCP), which analyzes the specific causes and impacts of changes between the planned schedule and eventual schedule as actually implemented.
In popular culture
In Odds On, the first novel by Michael Crichton, robbers use a critical path computer program to help plan a heist.
The Nome Trilogy (part 2 Diggers) by Terry Pratchett mentions "the doctrine of the critical path" and says that it means, "There's always something that you should have done first".
Project management is the process of leading the work of a team to achieve all project goals within the given constraints. This information is usually described in project documentation, created at the beginning of the development process. The primary constraints are scope, time, and budget. The secondary challenge is to optimize the allocation of necessary inputs and apply them to meet pre-defined objectives.
Project planning is part of project management, which relates to the use of schedules such as Gantt charts to plan and subsequently report progress within the project environment. Project planning can be done manually or by the use of project management software.
Critical chain project management (CCPM) is a method of planning and managing projects that emphasizes the resources required to execute project tasks. It was developed by Eliyahu M. Goldratt. It differs from more traditional methods that derive from critical path and PERT algorithms, which emphasize task order and rigid scheduling. A critical chain project network strives to keep resources levelled, and requires that they be flexible in start times.
Project management software (PMS) has the capacity to help plan, organize, and manage resource tools and develop resource estimates. Depending on the sophistication of the software, it can manage estimation and planning, scheduling, cost control and budget management, resource allocation, collaboration software, communication, decision-making, quality management, time management and documentation or administration systems. Numerous PC and browser-based project management software and contract management software products and services are available.
The program evaluation and review technique (PERT) is a statistical tool used in project management, which was designed to analyze and represent the tasks involved in completing a given project.
In project management, a schedule is a listing of a project's milestones, activities, and deliverables. Usually dependencies and resources are defined for each task, then start and finish dates are estimated from the resource allocation, budget, task duration, and scheduled events. A schedule is commonly used in the project planning and project portfolio management parts of project management. Elements on a schedule may be closely related to the work breakdown structure (WBS) terminal elements, the Statement of work, or a Contract Data Requirements List.
In project management, float or slack is the amount of time that a task in a project network can be delayed without causing a delay to:
A project network diagram is a graph that displays the order in which a project’s activities are to be completed. Derived from the work breakdown structure, the terminal elements of a project are organized sequentially based on the relationship among them. It is typically drawn from left to right to reflect project chronology.
Graphical Evaluation and Review Technique, commonly known as GERT, is a network analysis technique used in project management that allows probabilistic treatment both network logic and estimation of activity duration. The technique was first described in 1966 by Dr. Alan B. Pritsker of Purdue University and WW Happ.
The precedence diagram method (PDM) is a tool for scheduling activities in a project plan. It is a method of constructing a project schedule network diagram that uses boxes, referred to as nodes, to represent activities and connects them with arrows that show the dependencies. It is also called the activity-on-node (AON) method.
In project management, resource leveling is defined by A Guide to the Project Management Body of Knowledge as "A technique in which start and finish dates are adjusted based on resource limitation with the goal of balancing demand for resources with the available supply." Resource leveling problem could be formulated as an optimization problem. The problem could be solved by different optimization algorithms such as exact algorithms or meta-heuristic methods.
Event chain methodology is a network analysis technique that is focused on identifying and managing events and relationship between them that affect project schedules. It is an uncertainty modeling schedule technique. Event chain methodology is an extension of quantitative project risk analysis with Monte Carlo simulations. It is the next advance beyond critical path method and critical chain project management. Event chain methodology tries to mitigate the effect of motivational and cognitive biases in estimating and scheduling. It improves accuracy of risk assessment and helps to generate more realistic risk adjusted project schedules.
A glossary of terms relating to project management and consulting.
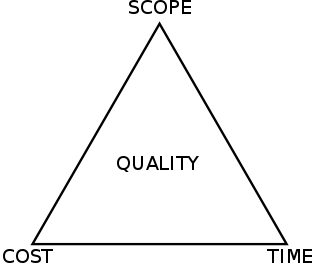
The project management triangle is a model of the constraints of project management. While its origins are unclear, it has been used since at least the 1950s. It contends that:
The quality of work is constrained by the project's budget, deadlines and scope (features).
The project manager can trade between constraints.
Changes in one constraint necessitate changes in others to compensate or quality will suffer.
The Graphical Path Method (GPM) is a mathematically based algorithm used in project management for planning, scheduling and resource control. GPM represents logical relationships of dated objects – such as activities, milestones, and benchmarks – in a time-scaled network diagram.
The following outline is provided as an overview of and topical guide to project management:
Critical path drag is a project management metric developed by Stephen Devaux as part of the Total Project Control (TPC) approach to schedule analysis and compression in the critical path method of scheduling. Critical path drag is the amount of time that an activity or constraint on the critical path is adding to the project duration. Alternatively, it is the maximum amount of time that one can shorten the activity before it is no longer on the critical path or before its duration becomes zero.
Drag cost is a project management metric developed by Stephen Devaux as part of the Total Project Control (TPC) approach to project schedule and cost analysis. It is the amount by which a project’s expected return on investment (ROI) is reduced due to the critical path drag of a specific critical path activity Task or other specific schedule factor such as a schedule lag or other delaying constraint.
Spider Project is a project management software, developed by a company, called Spider Project Team.
↑ Santiago, Jesse (February 4, 2009). "Critical Path Method"(PDF). Stanford. Archived from the original(PDF) on October 24, 2018. Retrieved October 24, 2018.
↑ Kelley, James; Walker, Morgan. Critical-Path Planning and Scheduling. 1959 Proceedings of the Eastern Joint Computer Conference.
↑ Kelley, James; Walker, Morgan. The Origins of CPM: A Personal History. PMNETwork 3(2):7–22.
↑ Newell, Michael; Grashina, Marina (2003). The Project Management Question and Answer Book. American Management Association. p.98.
↑ Thayer, Harry (1996). Management of the Hanford Engineer Works in World War II, How the Corps, DuPont and the Metallurgical Laboratory fast tracked the original plutonium works. ASCE Press, pp. 66–67.
↑ Armstrong-Wright, MICE, A. T. Critical Path Method: Introduction and Practice. Longman Group LTD, London, 1969, pp5ff.
↑ Blake William Clark Sedore, M.Sc.M.E. dspace.mit.edu "Assembly lead time reduction in a semiconductor capital equipment plant through constraint based scheduling", M. Eng. in Manufacturing thesis, Massachusetts Institute of Technology, Department of Mechanical Engineering, 2014.
Emmanuel Asanga (2013). A Guide To The Project Management Body Of Knowledge (5thed.). Project Management Institute. ISBN978-1-935589-67-9.
Devaux, Stephen A. (2014). Managing Projects as Investments: Earned Value to Business Value. CRC Press. ISBN978-1-4822-1270-9.
Devaux, Stephen A. (2015). Total Project Control (2nd Edition): A Practitioner's Guide to Managing Projects as Investments. CRC Press. ISBN978-1-4987-0677-3.
This page is based on this Wikipedia article Text is available under the CC BY-SA 4.0 license; additional terms may apply. Images, videos and audio are available under their respective licenses.