Related Research Articles

India is the world's third largest producer and third largest consumer of electricity. The national electric grid in India has an installed capacity of 383.37 GW as of 31 May 2021. Renewable power plants, which also include large hydroelectric plants, constitute 37% of India's total installed capacity. During the fiscal year (FY) 2019-20, the gross electricity generated by utilities in India was 1,383.5 TWh and the total electricity generation in the country was 1,598 TWh. The gross electricity consumption in FY2019 was 1,208 kWh per capita. In FY2015, electric energy consumption in agriculture was recorded as being the highest (17.89%) worldwide. The per capita electricity consumption is low compared to most other countries despite India having a low electricity tariff.

The energy policy of the United States is determined by federal, state, and local entities in the United States, which address issues of energy production, distribution, and consumption, such as building codes and gas mileage standards. Energy policy may include legislation, international treaties, subsidies and incentives to investment, guidelines for energy conservation, taxation and other public policy techniques.

Taiwan relies on imports for almost 98% of its energy in 2016, which leaves the island's energy supply vulnerable to external disruption. In order to reduce this dependence, the Ministry of Economic Affairs' Bureau of Energy has been actively promoting energy research at several universities since the 1990s.
The energy policy of India is largely defined by the country's expanding energy deficit and increased focus on developing alternative sources of energy, particularly nuclear, solar and wind energy. India attained 63% overall energy self-sufficiency in 2017.
A low-carbon economy (LCE) or decarbonised economy is an economy based on low-carbon power sources that therefore has a minimal output of greenhouse gas (GHG) emissions into the atmosphere, specifically carbon dioxide. GHG emissions due to anthropogenic (human) activity are the dominant cause of observed climate change since the mid-20th century. Continued emission of greenhouse gases may cause long-lasting changes around the world, increasing the likelihood of severe, pervasive, and irreversible effects for people and ecosystems.
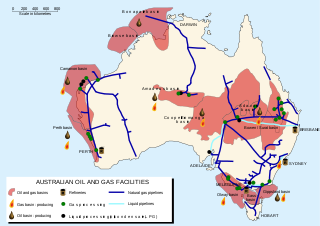
The energy policy of Australia is subject to the regulatory and fiscal influence of all three levels of government in Australia, although only the State and Federal levels determine policy for primary industries such as coal.

Greenhouse gas emissions are greenhouse gases vented to the Earth's atmosphere because of humans: the greenhouse effect of their 50 billion tons a year causes climate change. Most is carbon dioxide from burning fossil fuels: coal, oil and natural gas. The largest polluters include coal in China and large oil and gas companies, many state-owned by OPEC and Russia. Human caused emissions have increased atmospheric carbon dioxide by about 50%.

Ensuring adequate energy supply to sustain economic growth has been a core concern of the Chinese government since 1949. The country is the world's largest emitter of greenhouse gases, and coal in China is a major cause of global warming. However, from 2010 to 2015 China reduced energy consumption per unit of GDP by 18%, and CO2 emissions per unit of GDP by 20%. On a per-capita basis, it was the world's 51st largest emitter of greenhouse gases in 2016.

Renewable energy in Finland grew to 38.7% of total final energy consumption by year end 2014, achieving joint second position with Latvia in terms of renewable energy consumption by share amongst the EU-28 countries, behind its neighbour Sweden in first position on a 52.6% share. The 2014 share in Finland breaks down as renewable energy providing 52% of the heating and cooling sector, 31.4% of the electricity sector and 21.6% of the transport sector. By 2014, Finland had already exceeded its 2020 target for renewable energy use under the EU renewable energy directive as shown in the table of country targets.

Despite abundant natural resources and a relatively small population, New Zealand is a net importer of energy, in the form of petroleum products. The ratio of non-renewable and renewable energy sources was fairly consistent from 1975 to 2008, with about 70 percent of primary energy supply coming from hydrocarbon fuels. This ratio decreased to about 60 percent in 2018. The proportion of non-renewable energy varies annually, depending on water flows into hydro-electricity lakes and demand for energy. In 2018, approximately 60% of primary energy was from non-renewable hydrocarbon fuels and 40% was from renewable sources. In 2007 energy consumption per capita was 120 gigajoules. Per capita energy consumption had increased 8 per cent since 1998. New Zealand uses more energy per capita than 17 of 30 OECD countries. New Zealand is one of 13 OECD countries that does not operate nuclear power stations.

Energy in Finland describes energy and electricity production, consumption and import in Finland. Energy policy of Finland describes the politics of Finland related to energy. Electricity sector in Finland is the main article of electricity in Finland.

The energy sector in Switzerland is, by its structure and importance, typical of a developed country. Apart from hydroelectric power and firewood, the country has few indigenous energy resources: oil products, natural gas and nuclear fuel are imported, so that by 2013 only 22.6% of primary energy consumption will have been covered by local resources.
Cape Verde is a net importer of energy, with no significant fossil energy resources. As of 2016, 176,743 tonnes of fuel were sold on the internal market. Electricity production was 443 GWh in 2016, of which 81% from thermal power, 17% from wind power and 1.4% from solar power. The main electricity producing company of Cape Verde is Electra. Electra serves all islands of Cape Verde except Boa Vista, where electricity and water are produced and distributed by the public-private company Águas e Energia de Boavista. Other smaller electricity producers are Cabeólica, which operates 4 wind parks, Águas de Ponta Preta on the island of Sal, and Electric Wind on Santo Antão.
The energy mix is a group of different primary energy sources from which secondary energy for direct use - such as electricity - is produced. Energy mix refers to all direct uses of energy, such as transportation and housing, so it is not be confused with power generation mix, which refers only to generation of electricity.
Italy consumed about 185 Mtoe of primary energy in 2010. This came mostly from fossil fuels. Among the most used resources are petroleum, natural gas, coal and renewables.
Renewable energy in Tuvalu is a growing sector of the country's energy supply. Tuvalu has committed to sourcing 100% of its electricity from renewable energy. This is considered possible because of the small size of the population of Tuvalu and its abundant solar energy resources due to its tropical location. It is somewhat complicated because Tuvalu consists of nine inhabited islands. The Tuvalu National Energy Policy (TNEP) was formulated in 2009, and the Energy Strategic Action Plan defines and directs current and future energy developments so that Tuvalu can achieve the ambitious target of 100% renewable energy for power generation by 2020. The program is expected to cost 20 million US dollars and is supported by the e8, a group of 10 electric companies from G8 countries. The Government of Tuvalu worked with the e8 group to develop the Tuvalu Solar Power Project, which is a 40 kW grid-connected solar system that is intended to provide about 5% of Funafuti’s peak demand, and 3% of the Tuvalu Electricity Corporation's annual household consumption.

The electricity sector in Belgium describes electricity in Belgium. Production by power source in 2009 was 53% nuclear, 40% fossil electricity and 7% renewable electricity. 2% of production was exported in 2009. In 2008 import was 11%. Belgium is highly nuclear dependent country where the share of renewable electricity has been low. The share of renewable electricity was about 2% in 2005. Plan for 2020 is wind 10.5 TWh (9.5%), biomass 11 TWh and PV 1 TWh.

Ireland is a net energy importer. Ireland's import dependency decreased to 85% in 2014. The cost of all energy imports to Ireland was approximately €5.7 billion, down from €6.5 billion (revised) in 2013 due mainly to falling oil and, to a lesser extent, gas import prices. Consumption of all fuels fell in 2014 with the exception of peat, renewables and non-renewable wastes.
Renewable energy in the Cook Islands is primarily provided by solar energy and biomass. Since 2011 the Cook Islands has embarked on a programme of renewable energy development to improve its energy security and reduce greenhouse gas emissions, with an initial goal of reaching 50% renewable electricity by 2015, and 100% by 2020. The programme has been assisted by the governments of Japan, Australia, and New Zealand, and the Asian Development Bank.

World energy supply and consumption is global production and preparation of fuel, generation of electricity, energy transport and energy consumption. It is a basic part of economic activity. It does not include energy from food.
References
- ↑ "Cook Islands Energy". Worldometer. Retrieved 16 July 2020.
- ↑ "The Cook Islands: Energy Policies" (PDF). IEEJ. May 2012. p. 5. Retrieved 16 July 2020.
- ↑ "Cook Islands Energy 2020". Theodora. 27 January 2020. Retrieved 16 July 2020.
- ↑ Nikolic, Dusan; Tereapii, Tangi; Woo, Yul Lee; Blanksby, Chris (December 2016). "Cook Islands: 100% Renewable Energy in Different Guises". Energy Procedia. 103: 207–212. doi: 10.1016/j.egypro.2016.11.274 . Retrieved 16 July 2020.
- 1 2 "Energy consumption on the Cook Islands". Worlddata.info. Retrieved 16 July 2020.
- ↑ "The Cook Islands Renewable Electricity Chart" (PDF). Renewable Energy Development Division. April 2012. p. 6. Retrieved 16 July 2020.
- ↑ "Manihiki in Cooks eyes solar power". RNZ. 6 November 2012. Retrieved 16 July 2020.
- ↑ "Renewable Energy". Cook Islands Ministry of Finance & Economic Management. Retrieved 16 July 2020.
- ↑ "Cook Islands: 100% Renewable Energy by 2020". Secretariat of the Pacific Regional Environment Programme. 5 July 2011. Retrieved 16 July 2020.
- ↑ Melina Etches (27 September 2019). "Public meeting as diesel still leaks". Cook Islands News. Retrieved 17 July 2020.
- ↑ "Energy Act 1998". PACLII. Retrieved 16 July 2020.
- ↑ "Environment Act 2003". PACLII. Retrieved 16 July 2020.
- ↑ "Cook Islands Renewable Energy Charts and Implementation Plans". Cook Islands Ministry of Finance and Economic Management. Retrieved 16 July 2020.