This article has multiple issues. Please help improve it or discuss these issues on the talk page . (Learn how and when to remove these template messages)
|
This page compares the sovereign states of Europe on economic, financial and social indicators.
For the purposes of comparison the broader definition of Europe will be used. A sovereign state must meet at least one of the following criteria to be included:
Data provided is by the International Monetary Fund (2021) [1]
Rank | Country | GDP (millions of US$) |
---|---|---|
1 | Germany | 4,200,000 |
2 | France | 3,100,000 |
3 | United Kingdom | 3,000,000 |
4 | Italy | 1,886,000 |
5 | Russia | 1,483,000 |
6 | Spain | 1,281,000 |
7 | Netherlands | 912,806 |
8 | Switzerland | 748,000 |
9 | Turkey | 720,100 |
11 | Poland | 594,200 |
12 | Sweden | 537,600 |
13 | Belgium | 515,300 |
14 | Austria | 429,000 |
15 | Ireland | 418,600 |
16 | Norway | 362,000 |
17 | Denmark | 355,200 |
18 | Czech Republic | 282,300 |
19 | Finland | 271,200 |
20 | Romania | 248,700 |
21 | Portugal | 231,300 |
22 | Greece | 189,400 |
23 | Ukraine | 155,600 |
24 | Hungary | 155,260 |
25 | Slovakia | 104,600 |
26 | Luxembourg | 73,260 |
27 | Bulgaria | 69,110 |
28 | Belarus | 60,260 |
29 | Croatia | 55,970 |
30 | Lithuania | 55,890 |
31 | Serbia | 52,960 |
32 | Slovenia | 52,880 |
33 | Azerbaijan | 42,610 |
34 | Latvia | 33,510 |
35 | Estonia | 31,030 |
36 | Cyprus | 23,800 |
37 | Iceland | 21,710 |
38 | Bosnia and Herzegovina | 19,790 |
39 | Georgia | 15,890 |
40 | Albania | 14,800 |
41 | Malta | 14,650 |
42 | Armenia | 12,650 |
43 | North Macedonia | 12,270 |
44 | Moldova | 11,910 |
45 | Monaco | 7,424 |
46 | Liechtenstein | 6,839 |
48 | Montenegro | 4,779 |
49 | Andorra | 3,155 |
50 | San Marino | 1,616 |
The real GDP growth rates provided are the 2015 estimates (unless otherwise indicated) as recorded in the CIA World Factbook. [2]
Rank | Country | Real GDP growth rate (%) |
---|---|---|
1 | Monaco | 9.30 (2013 est.) |
2 | Ireland | 7.80 |
3 | Malta | 5.40 |
4 | Luxembourg | 4.50 |
5 | Czech Republic | 4.20 |
6 | Montenegro | 4.10 |
7 | Sweden | 4.10 |
8 | Iceland | 4.00 |
9 | Vatican City | 3.80 |
10 | Romania | 3.70 |
11 | North Macedonia | 3.70 |
12 | Slovakia | 3.60 |
13 | Poland | 3.60 |
14 | Spain | 3.20 |
15 | Armenia | 3.00 |
16 | Bulgaria | 3.00 |
17 | Slovenia | 2.90 |
18 | Hungary | 2.90 |
19 | Bosnia and Herzegovina | 2.80 |
20 | Georgia | 2.80 |
21 | Latvia | 2.70 |
22 | Albania | 2.60 |
23 | United Kingdom | 2.20 |
24 | Netherlands | 1.90 |
25 | Liechtenstein | 1.80 |
26 | Lithuania | 1.60 |
27 | Norway | 1.60 |
28 | Cyprus | 1.60 |
29 | Croatia | 1.60 |
30 | Germany | 1.50 |
31 | Portugal | 1.50 |
32 | Belgium | 1.40 |
33 | Denmark | 1.20 |
34 | France | 1.10 |
35 | Estonia | 1.10 |
36 | Azerbaijan | 1.10 |
37 | San Marino | 1.00 |
38 | Switzerland | 0.90 |
39 | Austria | 0.90 |
40 | Italy | 0.80 |
41 | Serbia | 0.70 |
42 | Finland | 0.40 |
43 | Greece | −0.20 |
44 | Moldova | −1.10 |
45 | Andorra | −1.60 |
46 | Russia | −3.70 |
47 | Belarus | −3.90 |
48 | Ukraine | −9.90 |
Data provided is by the World Bank (2021). Data for Monaco and Liechtenstein is from 2020 and 2019 respectively. [3]
Rank in Europe | Country | US$ |
---|---|---|
1 | Monaco | 173,688 |
2 | Liechtenstein | 169,049 |
3 | Luxembourg | 135,683 |
4 | Ireland | 99,152 |
5 | Switzerland | 93,457 |
6 | Norway | 89,203 |
7 | Iceland | 68,384 |
8 | Denmark | 67,803 |
9 | Sweden | 60,239 |
10 | Netherlands | 58,061 |
11 | Finland | 53,983 |
12 | Austria | 53,268 |
13 | Belgium | 51,768 |
14 | Germany | 50,802 |
15 | United Kingdom | 47,334 |
16 | San Marino | 45,516 |
17 | France | 43,519 |
18 | Andorra | 43,048 |
19 | Italy | 35,551 |
20 | Malta | 33,257 |
21 | Cyprus | 30,799 |
22 | Spain | 30,116 |
23 | Slovenia | 29,201 |
24 | Estonia | 27,281 |
25 | Czech Republic | 26,379 |
26 | Portugal | 24,262 |
27 | Lithuania | 23,433 |
28 | Slovakia | 21,088 |
29 | Latvia | 20,642 |
30 | Greece | 20,277 |
31 | Hungary | 18,773 |
32 | Poland | 17,841 |
33 | Croatia | 17,399 |
34 | Romania | 14,862 |
— | World | 12,263 |
35 | Russia | 12,173 |
36 | Bulgaria | 11,635 |
37 | Turkey | 9,587 |
38 | Montenegro | 9,367 |
39 | Serbia | 9,215 |
40 | Belarus | 7,304 |
41 | Bosnia and Herzegovina | 6,916 |
42 | North Macedonia | 6,721 |
43 | Albania | 6,494 |
44 | Moldova | 5,315 |
45 | Kosovo | 4,987 |
46 | Ukraine | 4,836 |
Data provided is by the International Monetary Fund (2018) [4]
Rank | Country | GDP (billions of US$) |
---|---|---|
1 | Germany | 4,342.9 |
2 | Russia | 4,227.4 |
3 | France | 3,040.4 |
4 | United Kingdom | 3,038.8 |
5 | Italy | 2,399.7 |
6 | Spain | 1,865.9 |
7 | Poland | 1,215.4 |
8 | Switzerland | 551.5 |
9 | Belgium | 550.8 |
10 | Sweden | 548.8 |
11 | Romania | 516.3 |
13 | Austria | 463.5 |
14 | Czech Republic | 396.1 |
15 | Norway | 395.8 |
16 | Ukraine | 390.4 |
17 | Ireland | 389.0 |
18 | Portugal | 333.1 |
19 | Greece | 312.2 |
20 | Hungary | 312.0 |
21 | Denmark | 302.2 |
22 | Finland | 256.8 |
23 | Slovakia | 191.2 |
24 | Belarus | 189.2 |
25 | Azerbaijan | 179.1 |
26 | Bulgaria | 162.1 |
27 | Serbia | 122.7 |
28 | Croatia | 107.3 |
29 | Lithuania | 97.0 |
30 | Slovenia | 75.9 |
31 | Luxembourg | 64.0 |
32 | Latvia | 57.8 |
33 | Bosnia and Herzegovina | 52.4 |
34 | Estonia | 45.4 |
35 | Georgia | 42.6 |
36 | Albania | 38.3 |
37 | North Macedonia | 32.6 |
38 | Cyprus | 34.5 |
39 | Armenia | 30.5 |
40 | Moldova | 25.8 |
41 | Malta | 21.4 |
42 | Iceland | 19.4 |
43 | Montenegro | 11.9 |
44 | Monaco | 5.74 (2011 est.) [n 1] |
45 | Liechtenstein | 3.20 (2009 est.) [n 1] |
46 | Andorra | 3.16 (2012 est.) [n 1] |
47 | San Marino | 2.01 |
Rank | Country | Total wealth (billions USD) |
---|---|---|
Europe | 85,402 | |
European Union | 77,821 | |
1 | Germany | 14,499 |
2 | France | 14,449 |
3 | United Kingdom | 14,209 |
4 | Italy | 10,569 |
5 | Spain | 7,152 |
6 | Switzerland | 3,611 |
7 | Netherlands | 3,357 |
8 | Belgium | 2,776 |
9 | Russia | 2,240 |
10 | Sweden | 1,920 |
11 | Austria | 1,637 |
12 | Denmark | 1,276 |
13 | Norway | 1,181 |
14 | Greece | 975 |
15 | Poland | 974 |
16 | Portugal | 916 |
17 | Ireland | 806 |
18 | Finland | 697 |
19 | Czech Republic | 524 |
20 | Romania | 317 |
21 | Hungary | 294 |
22 | Luxembourg | 188 |
23 | Slovakia | 151 |
24 | Bulgaria | 138 |
25 | Iceland | 138 |
26 | Slovenia | 133 |
27 | Croatia | 120 |
28 | Cyprus | 91 |
29 | Serbia | 73 |
30 | Estonia | 60 |
31 | Lithuania | 57 |
32 | Ukraine | 55 |
33 | Latvia | 53 |
34 | Malta | 49 |
35 | Bosnia and Herzegovina | 40 |
36 | Albania | 37 |
37 | North Macedonia | 20 |
38 | Montenegro | 12 |
39 | Belarus | 11 |
The current account balance values provided are the 2013 figures (unless otherwise indicated) as recorded in the CIA World Factbook. [6] Figures for Andorra, Liechtenstein, Monaco and San Marino are unavailable.
Rank | Country | Current account balance (US$) |
---|---|---|
1 | Germany | 257,100,000,000 |
2 | Russia | 74,800,000,000 (2012 est.) |
3 | Norway | 67,400,000,000 |
4 | Netherlands | 65,870,000,000 |
5 | Switzerland | 65,600,000,000 |
6 | Sweden | 39,000,000,000 |
7 | Denmark | 19,600,000,000 |
8 | Azerbaijan | 13,280,000,000 |
9 | Austria | 10,600,000,000 |
10 | Ireland | 7,300,000,000 |
11 | Slovakia | 3,315,000,000 |
12 | Slovenia | 2,954,000,000 |
13 | Luxembourg | 2,700,000,000 |
14 | Spain | 2,100,000,000 |
15 | Greece | 2,021,000,000 |
16 | Hungary | 1,722,000,000 |
17 | Portugal | 1,000,000,000 |
18 | Malta | 133,100,000 |
19 | Iceland | −100,000,000 |
20 | Croatia | −102,300,000 |
21 | Bulgaria | −182,300,000 |
22 | North Macedonia | −194,100,000 |
23 | Estonia | −352,300,000 |
24 | Cyprus | −358,200,000 |
25 | Moldova | −507,700,000 |
26 | Lithuania | −567,000,000 |
27 | Latvia | −613,900,000 |
28 | Armenia | −720,600,000 |
29 | Bosnia and Herzegovina | −939,500,000 |
30 | Albania | −1,280,000,000 |
31 | Georgia | −1,375,000,000 |
32 | Serbia | −1,807,000,000 |
33 | Montenegro | −1,938,000,000 (2012 est.) |
34 | Romania | −1,986,000,000 |
35 | Finland | −2,000,000,000 |
36 | Italy | −2,400,000,000 |
37 | Czech Republic | −3,270,000,000 |
38 | Belarus | −4,245,000,000 |
39 | Belgium | −9,100,000,000 |
40 | Poland | −11,060,000,000 |
41 | Ukraine | −11,920,000,000 |
42 | France | −58,970,000,000 |
43 | United Kingdom | -93,600,000,000 |
The public debt values provided are the 2013 figures (unless otherwise indicated) as recorded in the CIA World Factbook. [7] Figures for Liechtenstein and Monaco are unavailable.
Rank | Country | Public debt (% of GDP) |
---|---|---|
1 | Greece | 175.00 |
2 | Italy | 133.00 |
3 | Iceland | 130.50 |
4 | Portugal | 127.80 |
5 | Cyprus | 113.10 |
6 | Belgium | 102.40 |
7 | Spain | 93.70 |
8 | France | 93.40 |
9 | United Kingdom | 91.10 |
10 | Germany | 79.90 |
11 | Hungary | 79.80 |
12 | Austria | 75.70 |
13 | Malta | 75.30 |
14 | Netherlands | 74.30 |
15 | Slovenia | 71.70 |
16 | Albania | 70.50 |
17 | Croatia | 66.20 |
18 | Ireland | 64.80 (2019) |
19 | Serbia | 61.20 |
20 | Finland | 56.50 |
21 | Slovakia | 55.50 |
22 | Montenegro | 52.10 (2012 est.) |
23 | Czech Republic | 48.80 |
24 | Poland | 48.20 |
25 | Denmark | 47.00 |
26 | Bosnia and Herzegovina | 45.90 |
27 | Sweden | 41.50 |
28 | Andorra | 41.10 (2012) |
29 | Ukraine | 40.60 |
30 | Lithuania | 40.20 |
31 | Latvia | 39.20 |
32 | Romania | 38.60 |
33 | Armenia | 37.70 |
34 | Liechtenstein | 36.60 |
35 | Georgia | 36.30 (2012 est.) |
36 | North Macedonia | 34.30 |
37 | Switzerland | 33.80 |
38 | Belarus | 31.50 |
39 | Norway | 30.10 |
40 | San Marino | 25.80 |
41 | Luxembourg | 22.90 |
42 | Bulgaria | 18.40 |
43 | Moldova | 16.60 |
44 | Russia | 7.90 |
45 | Azerbaijan | 7.50 |
46 | Estonia | 6.00 |
The unemployment rate values provided are the most recent figures provided by varying sources, namely data released by governments.
This article needs to be updated.(September 2018) |
Rank | Country | Unemployment rate (%) |
---|---|---|
1 | Monaco | 0.1 (2013) [n 2] |
2 | Belarus | 0.5 (2020) |
3 | Czech Republic | 2.7 (2020) |
4 | Poland | 3.2 (2020) |
5 | Malta | 4.1 (2020) |
6 | Bulgaria | 4.4 (2020) |
7 | Germany | 4.4 (2020) |
8 | Netherlands | 4.5 (2020) [n 3] |
9 | Slovenia | 4.7 (2020) |
10 | Hungary | 4.9 (2020) |
11 | Ireland | 5 (2020) |
12 | Austria | 5.2 (2020) |
13 | Romania | 5.4 (2020) |
14 | Belgium | 5.5 (2020) |
15 | Denmark | 6 (2020) |
16 | Slovakia | 6.8 (2020) |
17 | France | 6.9 (2020) |
18 | Cyprus | 6.9 (2020) |
19 | Luxembourg | 7.3 (2020) |
20 | Finland | 7.8 (2020) |
21 | Estonia | 8 (2020) |
22 | Portugal | 8.1 (2020) |
23 | Croatia | 8.6 (2020) |
24 | Latvia | 9 (2020) |
25 | Lithuania | 9 (2020) |
26 | Sweden | 9.4 (2020) |
27 | Italy | 9.7 (2020) |
28 | Spain | 15.8 (2020) |
29 | Greece | 18.3 (2020) |
The average wage values provided are 2018 figures (unless otherwise stated) as recorded by varying sources, namely releases by respective Governments. The values are for monthly average wage (annual wage divided by 12 months) for net income (after taxes) in Euro currency.
Rank | Country | Net wage (Euro €) |
---|---|---|
1 | Liechtenstein | 4,887 |
2 | Switzerland | 4,502 |
3 | Monaco | 4,300 |
4 | Iceland | 3,568 |
5 | Luxembourg | 3,416 |
6 | Norway | 3,395 |
7 | Denmark | 3,270 |
8 | France | 2,634 |
9 | United Kingdom | 2,583 |
10 | Ireland | 2,525 |
11 | Finland | 2,509 |
12 | Sweden | 2,458 |
13 | Germany | 2,409 |
14 | San Marino | 2,390 |
15 | Austria | 2,324 |
16 | Andorra | 2,230 |
17 | Netherlands | 2,152 |
18 | Belgium | 1,920 |
19 | Italy | 1,758 |
20 | Spain | 1,749 |
21 | Cyprus | 1,658 |
22 | Estonia | 1,105 |
23 | Slovenia | 1,083 |
24 | Malta | 1,021 |
25 | Czechia | 932 |
26 | Portugal | 925 |
27 | Greece | 890 |
28 | Slovakia | 862 |
29 | Poland | 793 |
30 | Latvia | 755 |
31 | Lithuania | 722 |
32 | Hungary | 701 |
33 | Romania | 589 |
34 | Bulgaria | 583 |
35 | Serbia | 565 |
36 | Montenegro | 512 |
37 | Bosnia and Herzegovina | 510 |
38 | North Macedonia | 473 |
39 | Russia | 454 |
40 | Albania | 393 |
41 | Belarus | 348 |
42 | Moldova | 242 |
43 | Ukraine | 228 |
The minimum wage figures provided are the 2018 figures by The Federation of International Employers. Currency conversions from non-Euro currencies being based on the exchange rates of 2018. [8]
Rank | Country | Monthly minimum (euro) |
---|---|---|
1 | Luxembourg | 2,049 |
2 | San Marino | 1,832 |
3 | Austria | 1,750 (2020) |
4 | Monaco | 1,732 |
5 | Netherlands | 1,578 |
6 | Belgium | 1,563 |
7 | Ireland | 1,563 |
8 | Germany | 1,498 |
9 | France | 1,458 |
10 | United Kingdom | 1,413 |
11 | Spain | 1,050 |
12 | Andorra | 991 |
13 | Slovenia | 886 |
14 | Malta | 761 |
15 | Portugal | 700 |
16 | Greece | 683 |
17 | Lithuania | 555 |
18 | Estonia | 540 |
19 | Poland | 524 |
20 | Slovakia | 480 |
21 | Czechia | 477 |
22 | Croatia | 462 |
23 | Hungary | 445 |
24 | Latvia | 430 |
25 | Romania | 407 |
26 | Albania | 300 |
27 | Serbia | 276 |
28 | Bulgaria | 260 |
29 | North Macedonia | 239 |
30 | Bosnia and Herzegovina | 207 |
31 | Montenegro | 193 |
32 | Russia | 139 |
33 | Ukraine | 128 |
34 | Belarus | 125 |
35 | Moldova | 124 |
The Human Development Index values provided are the 2018 estimates for 2017, as included in the United Nations Development Programme's Human Development Report. [9]
Rank | Country | HDI | Change |
---|---|---|---|
1 | Norway | 0.953 | 0.002 |
2 | Switzerland | 0.944 | 0.001 |
3 | Ireland | 0.938 | 0.004 |
4 | Germany | 0.936 | 0.002 |
5 | Iceland | 0.935 | 0.002 |
6 | Sweden | 0.933 | 0.001 |
7 | Netherlands | 0.931 | 0.003 |
8 | Denmark | 0.929 | 0.001 |
9 | United Kingdom | 0.922 | 0.002 |
10 | Finland | 0.920 | 0.002 |
11 | Belgium | 0.916 | 0.001 |
12 | Liechtenstein | 0.916 | 0.001 |
13 | Austria | 0.908 | 0.002 |
14 | Luxembourg | 0.904 | 0.001 |
15 | France | 0.901 | 0.002 |
16 | Slovenia | 0.896 | 0.002 |
17 | Spain | 0.891 | 0.002 |
18 | Czech Republic | 0.888 | 0.003 |
19 | Italy | 0.880 | 0.002 |
20 | Malta | 0.878 | 0.003 |
21 | Estonia | 0.871 | 0.003 |
22 | Greece | 0.870 | 0.002 |
23 | Cyprus | 0.869 | 0.002 |
24 | Poland | 0.865 | 0.005 |
25 | Andorra | 0.858 | 0.002 |
26 | Lithuania | 0.858 | 0.003 |
27 | Slovakia | 0.855 | 0.002 |
28 | Latvia | 0.847 | 0.003 |
29 | Portugal | 0.847 | 0.002 |
30 | Hungary | 0.838 | 0.003 |
31 | Croatia | 0.831 | 0.003 |
32 | Russia | 0.816 | 0.001 |
33 | Montenegro | 0.814 | 0.004 |
34 | Bulgaria | 0.813 | 0.003 |
35 | Romania | 0.811 | 0.004 |
36 | Belarus | 0.808 | 0.003 |
37 | Turkey | 0.806 | 0.004 |
38 | Serbia | 0.787 | 0.002 |
39 | Albania | 0.785 | 0.003 |
40 | Bosnia and Herzegovina | 0.780 | 0.002 |
41 | Georgia | 0.780 | 0.004 |
42 | Azerbaijan | 0.757 | |
43 | North Macedonia | 0.757 | 0.001 |
44 | Armenia | 0.755 | 0.006 |
45 | Ukraine | 0.752 | 0.005 |
46 | Moldova | 0.700 | 0.003 |
The percentage figures for citizens living below the poverty line are provided by either the CIA World Factbook (2007) or the World Bank (2012) [10] [11] [12] There is no data available for eleven European states.
Rank | Country | Percentage | Year |
---|---|---|---|
1 | Lithuania | 4.0 | 2008 |
2 | Norway | 4.3 | 2007 |
3 | Ireland | 5.5 | 2009 |
4 | Latvia | 5.9 | 2004 |
5 | Austria | 6.0 | 2008 |
5 | Azerbaijan | 6.0 | 2012 |
7 | France | 6.2 | 2004 |
8 | Switzerland | 6.9 | 2010 |
9 | Belarus | 7.3 | 2011 |
10 | Poland | 7.6 | 2008 |
11 | Ukraine | 7.8 | 2011 |
12 | Czech Republic | 8.6 | 2012 |
13 | Serbia | 9.1 | 2013 |
14 | Netherlands | 10.5 | 2005 |
15 | Montenegro | 11.3 | 2012 |
16 | Slovenia | 12.3 | 2008 |
17 | Russia | 12.7 | 2011 |
18 | Slovakia | 13.2 | 2011 |
19 | Denmark | 13.4 | 2011 |
20 | Hungary | 13.9 | 2010 |
21 | United Kingdom | 14.0 | 2006 |
37 | Albania | 40.7 | 2022 |
22 | Belgium | 15.2 | 2007 |
23 | Germany | 15.5 | 2010 |
24 | Moldova | 16.6 | 2012 |
25 | Turkey | 16.9 | 2010 |
26 | Estonia | 17.5 | 2010 |
27 | Georgia | 17.7 | 2011 |
28 | Bosnia and Herzegovina | 17.9 | 2011 |
29 | Croatia | 18.0 | 2009 |
30 | Portugal | 18.0 | 2006 |
31 | Spain | 19.8 | 2005 |
32 | Greece | 20.0 | 2009 |
33 | Bulgaria | 20.7 | 2009 |
34 | North Macedonia | 21.1 | 2010 |
35 | Romania | 22.2 | 2011 |
36 | Armenia | 34.1 | 2009 |
The Social Progress Index figures are provided by the nonprofit Social Progress Imperative and represent 2014. Eight European states are not represented as data is not available. [13]
Rank | Country | Social Progress Index |
---|---|---|
1 | Switzerland | 88.19 |
2 | Iceland | 88.07 |
3 | Netherlands | 87.37 |
4 | Norway | 87.12 |
5 | Sweden | 87.08 |
6 | Finland | 86.91 |
7 | Denmark | 86.55 |
8 | Austria | 85.11 |
9 | Germany | 84.61 |
10 | United Kingdom | 84.56 |
11 | Ireland | 84.05 |
12 | Belgium | 82.63 |
13 | Slovenia | 81.65 |
14 | Estonia | 81.65 |
15 | France | 81.10 |
16 | Spain | 80.77 |
17 | Portugal | 80.49 |
18 | Czech Republic | 80.41 |
19 | Slovakia | 78.93 |
20 | Poland | 77.44 |
21 | Italy | 76.93 |
22 | Latvia | 73.91 |
23 | Hungary | 73.87 |
24 | Lithuania | 73.76 |
25 | Greece | 73.43 |
26 | Croatia | 73.31 |
27 | Serbia | 70.61 |
28 | Bulgaria | 70.24 |
29 | Albania | 69.13 |
30 | North Macedonia | 68.33 |
31 | Romania | 67.72 |
32 | Montenegro | 66.80 |
33 | Belarus | 65.20 |
34 | Armenia | 65.03 |
35 | Bosnia and Herzegovina | 64.99 |
36 | Ukraine | 64.91 |
37 | Turkey | 64.62 |
38 | Georgia | 63.94 |
39 | Azerbaijan | 62.44 |
40 | Russia | 60.79 |
41 | Moldova | 60.12 |
The Opportunity figures are included in the 2014 Social Progress Index by the nonprofit Social Progress Imperative. Eight European states are not represented as data is not available. [13]
Rank | Country | Opportunity |
---|---|---|
1 | Ireland | 82.63 |
2 | United Kingdom | 82.29 |
3 | Sweden | 81.95 |
4 | Finland | 81.92 |
5 | Iceland | 81.71 |
6 | Norway | 80.82 |
7 | Netherlands | 80.63 |
8 | Switzerland | 79.92 |
9 | Denmark | 79.10 |
10 | Belgium | 76.34 |
11 | Germany | 75.81 |
12 | Spain | 75.19 |
13 | Portugal | 74.43 |
14 | Austria | 74.42 |
15 | France | 72.72 |
16 | Estonia | 72.32 |
17 | Slovenia | 69.3 |
18 | Italy | 66.58 |
19 | Poland | 66.50 |
20 | Czech Republic | 66.21 |
21 | Hungary | 63.46 |
22 | Slovakia | 63.04 |
23 | Lithuania | 61.84 |
24 | Latvia | 59.85 |
25 | Greece | 58.45 |
26 | Bulgaria | 56.98 |
27 | Ukraine | 55.33 |
28 | North Macedonia | 55.23 |
29 | Romania | 54.91 |
30 | Croatia | 54.88 |
31 | Albania | 54.14 |
32 | Serbia | 52.87 |
33 | Montenegro | 52.48 |
34 | Georgia | 49.07 |
35 | Moldova | 48.04 |
36 | Turkey | 47.41 |
37 | Armenia | 47.39 |
38 | Bosnia and Herzegovina | 46.93 |
39 | Russia | 46.58 |
40 | Belarus | 44.13 |
41 | Azerbaijan | 42.54 |
The World Happiness Report is a measure of happiness published by the United Nations Sustainable Development Solutions Network, with the figures provided being the 2013 edition for the 2010 to 2012 period. [14]
Rank | Country | Happiness | Change in happiness (2005-2006) |
---|---|---|---|
1 | Finland | 7.693 | −0.233 |
2 | Norway | 7.655 | 0.263 |
3 | Switzerland | 7.650 | 0.303 |
4 | Netherlands | 7.512 | 0.054 |
5 | Sweden | 7.480 | 0.171 |
7 | Austria | 7.369 | 0.247 |
8 | Iceland | 7.355 | N/A |
9 | Ireland | 7.076 | −0.068 |
10 | Luxembourg | 7.054 | N/A |
11 | Belgium | 6.967 | −0.274 |
12 | United Kingdom | 6.883 | −0.003 |
13 | France | 6.764 | −0.049 |
14 | Germany | 6.672 | 0.163 |
15 | Cyprus | 6.466 | 0.228 |
16 | Spain | 6.322 | −0.750 |
17 | Czech Republic | 6.290 | −0.180 |
18 | Slovenia | 6.060 | 0.249 |
19 | Italy | 6.021 | −0.691 |
20 | Slovakia | 5.969 | 0.705 |
21 | Malta | 5.964 | N/A |
22 | Poland | 5.822 | 0.085 |
23 | Moldova | 5.791 | 0.852 |
24 | Croatia | 5.661 | −0.160 |
25 | Albania | 5.550 | 0.915 |
26 | Belarus | 5.504 | −0.133 |
27 | Russia | 5.464 | 0.346 |
28 | Greece | 5.435 | −0.891 |
29 | Lithuania | 5.426 | −0.456 |
30 | Estonia | 5.426 | 0.074 |
31 | Turkey | 5.344 | 0.171 |
32 | Montenegro | 5.299 | 0.103 |
33 | Portugal | 5.101 | −0.305 |
34 | Ukraine | 5.057 | 0.032 |
35 | Latvia | 5.046 | 0.358 |
36 | Romania | 5.033 | −0.186 |
37 | Bulgaria | 4.981 | 0.137 |
38 | Serbia | 4.813 | 0.063 |
39 | Bosnia and Herzegovina | 4.813 | −0.087 |
40 | Hungary | 4.775 | −0.300 |
41 | Azerbaijan | 4.604 | −0.045 |
42 | North Macedonia | 4.574 | 0.081 |
43 | Armenia | 4.316 | −0.269 |
44 | Georgia | 4.187 | 0.496 |
The economy of the Czech Republic is a developed export-oriented social market economy based in services, manufacturing, and innovation that maintains a high-income welfare state and the European social model. The Czech Republic participates in the European Single Market as a member of the European Union, and is therefore a part of the economy of the European Union. It uses its own currency, the Czech koruna, instead of the euro. It is a member of the Organisation for Economic Co-operation and Development (OECD). The Czech Republic ranks 16th in inequality-adjusted human development and 24th in World Bank Human Capital Index, ahead of countries such as the United States, the United Kingdom or France. It was described by The Guardian as "one of Europe's most flourishing economies".
The economy of Denmark is a modern high-income and mixed economy. The economy of Denmark is dominated by the service sector with 80% of all jobs, whereas about 11% of all employees work in manufacturing and 2% in agriculture. The nominal gross national income per capita was the ninth-highest in the world at $68,827 in 2023.
The economy of Estonia is an advanced economy and the country is a member of the European Union and the eurozone. Estonia's economy is heavily influenced by developments in the Finnish and Swedish economies.
The economy of Grenada is a largely tourism-based, small and open economy. Over the past two decades, the main thrust of Grenada's economy has shifted from agriculture to services, with tourism serving as the leading foreign currency earning sector. The country's principal export crops are the spices nutmeg and mace. Other crops for export include cocoa, citrus fruits, bananas, cloves, and cinnamon. Manufacturing industries in Grenada operate mostly on a small scale, including production of beverages and other foodstuffs, textiles, and the assembly of electronic components for export.
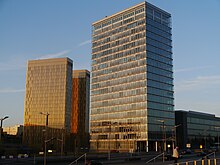
The economy of Latvia is an open economy in Europe and is part of the European Single Market. Latvia is a member of the World Trade Organization (WTO) since 1999, a member of the European Union since 2004, a member of the Eurozone since 2014 and a member of the OECD since 2016. Latvia is ranked the 14th in the world by the Ease of Doing Business Index prepared by the World Bank Group. According to the Human Development Report 2011, Latvia belongs to the group of very high human development countries. Due to its geographical location, transit services are highly developed, along with timber and wood processing, agriculture and food products, and manufacturing of machinery and electronic devices.
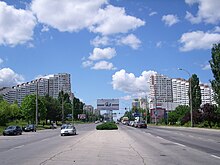
The economy of Nicaragua is focused primarily on the agricultural sector. Nicaragua itself is the least developed country in Central America, and the second poorest in the Americas by nominal GDP. In recent years, under the administrations of Daniel Ortega, the Nicaraguan economy has expanded somewhat, following the Great Recession, when the country's economy actually contracted by 1.5%, due to decreased export demand in the American and Central American markets, lower commodity prices for key agricultural exports, and low remittance growth. The economy saw 4.5% growth in 2010 thanks to a recovery in export demand and growth in its tourism industry. Nicaragua's economy continues to post growth, with preliminary indicators showing the Nicaraguan economy growing an additional 5% in 2011. Consumer Price inflation have also curtailed since 2008, when Nicaragua's inflation rate hovered at 19.82%. In 2009 and 2010, the country posted lower inflation rates, 3.68% and 5.45%, respectively. Remittances are a major source of income, equivalent to 15% of the country's GDP, which originate primarily from Costa Rica, the United States, and European Union member states. Approximately one million Nicaraguans contribute to the remittance sector of the economy.
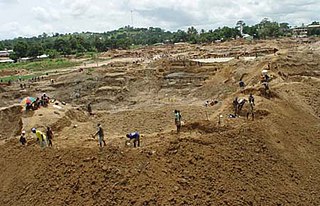
The economy of Sierra Leone is $4.082 billion by gross domestic product as of 2018. Since the end of the Sierra Leone Civil War in 2002, the economy is gradually recovering with a gross domestic product growth rate between 4 and 7%. In 2008 it in PPP ranked between 147th by World Bank, and 153rd by CIA, largest in the world.
The economy of Slovakia is based upon Slovakia becoming an EU member state in 2004, and adopting the euro at the beginning of 2009. Its capital, Bratislava, is the largest financial centre in Slovakia. As of Q1 2018, the unemployment rate was 5.72%.
The economy of Slovenia is a developed economy, and the country enjoys a high level of prosperity and stability as well as above-average GDP per capita by purchasing power parity at 92% of the EU average in 2022. The nominal GDP in 2023 is 68.108 billion USD, nominal GDP per capita (GDP/pc) in 2023 is USD 32,214. The highest GDP/pc is in central Slovenia, where the capital city Ljubljana is located. It is part of the Western Slovenia statistical region, which has a higher GDP/pc than eastern Slovenia.
The economy of Tunisia is in the process of being liberalized after decades of heavy state direction and participation in the country's economy. Prudent economic and fiscal planning has resulted in moderate but sustained growth for over a decade. Tunisia's economic growth historically has depended on oil, phosphates, agri-food products, car parts manufacturing, and tourism. In the World Economic Forum Global Competitiveness Report for 2015–2016, Tunisia ranks in 92nd place.
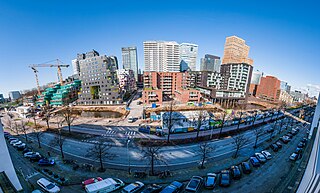
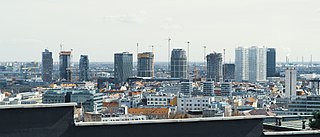
The economy of the Netherlands is a highly developed market economy focused on Trade and Logistics, Manufacturing, Services, Innovation and Technology and Sustainable and Renewable Energy. It is the world's 18th largest economy by nominal GDP and the 28th largest by purchasing power parity (PPP) and is the fifth largest economy in European Union by nominal GDP. It has the world's 11th highest per capita GDP (nominal) and the 13th highest per capita GDP (PPP) as of 2023 making it one of the highest earning nations in the world. Many of the world's largest tech companies are based in its capital Amsterdam or have established their European headquarters in the city, such as IBM, Microsoft, Google, Oracle, Cisco, Uber, Netflix and Tesla. Its second largest city Rotterdam is a major trade, logistics and economic center of the world and is Europe's largest seaport. Netherlands is ranked fifth on global innovation index and fourth on the Global Competitiveness Report.
The economy of Belgium is a highly developed, high-income, mixed economy.
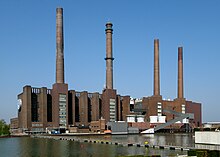
The economy of Austria is a developed social market economy, with the country being one of the fourteen richest in the world in terms of GDP per capita. Until the 1980s, many of Austria's largest industry firms were nationalised. In recent years, privatisation has reduced state holdings to a level comparable to other European economies.
The world economy or global economy is the economy of all humans in the world, referring to the global economic system, which includes all economic activities conducted both within and between nations, including production, consumption, economic management, work in general, exchange of financial values and trade of goods and services. In some contexts, the two terms are distinct: the "international" or "global economy" is measured separately and distinguished from national economies, while the "world economy" is simply an aggregate of the separate countries' measurements. Beyond the minimum standard concerning value in production, use and exchange, the definitions, representations, models and valuations of the world economy vary widely. It is inseparable from the geography and ecology of planet Earth.
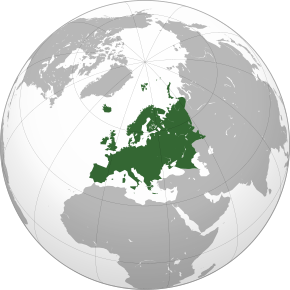
The economy of the European Union is the joint economy of the member states of the European Union (EU). It is the second largest economy in the world in nominal terms, after the United States and the third one in purchasing power parity (PPP) terms, after China and the United States. The European Union's GDP estimated to be around $19.35 trillion (nominal) in 2024 representing around one sixth of the global economy. Germany has by far the biggest national GDP of all EU countries, followed by France and Italy.
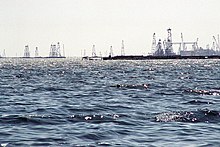
The economy of the Middle East is very diverse, with national economies ranging from hydrocarbon-exporting rentiers to centralized socialist economies and free-market economies. The region is best known for oil production and export, which significantly impacts the entire region through the wealth it generates and through labor utilization. In recent years, many of the countries in the region have undertaken efforts to diversify their economies.
The economy of Sweden is a highly developed export-oriented economy, aided by timber, hydropower, and iron ore. These constitute the resource base of an economy oriented toward foreign trade. The main industries include motor vehicles, telecommunications, pharmaceuticals, industrial machines, precision equipment, chemical goods, home goods and appliances, forestry, iron, and steel. Traditionally, Sweden relied on a modern agricultural economy that employed over half the domestic workforce. Today Sweden further develops engineering, mine, steel, and pulp industries, which are competitive internationally, as evidenced by companies like Ericsson, ASEA/ABB, SKF, Alfa Laval, AGA, and Dyno Nobel.
The economy of Central America is the eleventh-largest economy in Latin America, behind Brazil, Mexico, Argentina and Colombia. According to the World Bank, the nominal GDP of Central America reached 204 billion US dollar in 2010, as recovery from the crisis of 2009, where gross domestic product (GDP) suffered a decline to 3.8%. The major economic sectors are agriculture and tourism, although the industrial sector has shown strong growth, mainly in Panama.
{{cite journal}}
: Cite journal requires |journal=
(help)