Holdridge life zones

Last updated
Holdridge life zone classification scheme. Although conceived as three-dimensional by its originator, it is usually shown as a two-dimensional array of hexagons in a triangular frame. Lifezones Pengo.svg
Holdridge life zone classification scheme. Although conceived as three-dimensional by its originator, it is usually shown as a two-dimensional array of hexagons in a triangular frame.

The Holdridge life zones system is a global bioclimatic scheme for the classification of land areas. It was first published by Leslie Holdridge in 1947, and updated in 1967. It is a relatively simple system based on few empirical data, giving objective criteria. [1] A basic assumption of the system is that both soil and the climax vegetation can be mapped once the climate is known. [2]

Contents

Scheme

While it was first designed for tropical and subtropical areas, the system now applies globally. The system has been shown to fit not just tropical vegetation zones, but Mediterranean zones, and boreal zones too, but is less applicable to cold oceanic or cold arid climates where moisture becomes the predominant factor. The system has found a major use in assessing the potential changes in natural vegetation patterns due to global warming. [3]

The three major axes of the barycentric subdivisions are:

Further indicators incorporated into the system are:

Biotemperature is based on the growing season length and temperature. It is measured as the mean of all annual temperatures, with all temperatures below freezing and above 30 °C adjusted to 0 °C, [4] as most plants are dormant at these temperatures. Holdridge's system uses biotemperature first, rather than the temperate latitude bias of Merriam's life zones, and does not primarily consider elevation directly. The system is considered more appropriate for tropical vegetation than Merriam's system.

Scientific relationship between the 3 axes and 3 indicators

Potential evapotranspiration (PET) is the amount of water that would be evaporated and transpired if there were enough water available. Higher temperatures result in higher PET. [5] Evapotranspiration (ET) is the raw sum of evaporation and plant transpiration from the Earth's land surface to atmosphere. Evapotranspiration can never be greater than PET. The ratio, Precipitation/PET, is the aridity index (AI), with an AI<0.2 indicating arid/hyperarid, and AI<0.5 indicating dry. [6]

The coldest regions have not much evapotranspiration nor precipitation as there is not enough heat to evaporate much water, hence polar deserts. In the warmer regions, there are deserts with maximum PET but low rainfall that make the soil even drier, and rain forests with low PET and maximum rainfall causing river systems to drain excess water into oceans.

Classes

All the classes defined within the system, as used by the International Institute for Applied Systems Analysis (IIASA), are: [7]

  1. Polar desert
  2. Subpolar dry tundra
  3. Subpolar moist tundra
  4. Subpolar wet tundra
  5. Subpolar rain tundra
  6. Boreal desert
  7. Boreal dry scrub
  8. Boreal moist forest
  9. Boreal wet forest
  10. Boreal rain forest
  11. Cool temperate desert
  12. Cool temperate desert scrub
  13. Cool temperate steppe
  14. Cool temperate moist forest
  15. Cool temperate wet forest
  16. Cool temperate rain forest
  17. Warm temperate desert
  18. Warm temperate desert scrub
  19. Warm temperate thorn scrub
  20. Warm temperate dry forest
  21. Warm temperate moist forest
  22. Warm temperate wet forest
  23. Warm temperate rain forest
  24. Subtropical desert
  25. Subtropical desert scrub
  26. Subtropical thorn woodland
  27. Subtropical dry forest
  28. Subtropical moist forest
  29. Subtropical wet forest
  30. Subtropical rain forest
  31. Tropical desert
  32. Tropical desert scrub
  33. Tropical thorn woodland
  34. Tropical very dry forest
  35. Tropical dry forest
  36. Tropical moist forest
  37. Tropical wet forest
  38. Tropical rain forest

Climate change

On this map, a shift of 1 indicates that at the end of the century, the region had fully moved into a completely different Holdridge zone type from where it had been historically. The extent of the shifts will be dependent on the severity of the climate change scenario followed. Kummu 2021 quantiles.jpg
On this map, a shift of 1 indicates that at the end of the century, the region had fully moved into a completely different Holdridge zone type from where it had been historically. The extent of the shifts will be dependent on the severity of the climate change scenario followed.

Many areas of the globe are expected to see substantial changes in their Holdridge life zone type as the result of climate change, with more severe change resulting in more remarkable shifts in a geologically rapid time span, leaving less time for humans and biomes to adjust. If species fail to adapt to these changes, they would ultimately go extinct: the scale of future change also determines the extent of extinction risk from climate change. For humanity, this phenomenon has particularly important implications for agriculture, as shifts in life zones happening in a matter of decades inherently result in unstable weather conditions compared to what that area had experienced throughout human history. Developed regions may be able to adjust to that, but those with fewer resources are less likely to do so. [8]

Areas of the globe where agriculture would become more difficult perhaps to the point of leaving the conditions historically suitable for it, under low-emission and high-emission scenarios, by 2100. Kummu 2021 zones.jpg
Areas of the globe where agriculture would become more difficult perhaps to the point of leaving the conditions historically suitable for it, under low-emission and high-emission scenarios, by 2100.

Some research suggests that under the scenario of continually increasing greenhouse gas emissions, known as SSP5-8.5, the areas responsible for over half of the current crop and livestock output would experience very rapid shift in its Holdridge Life Zones. This includes most of South Asia and the Middle East, as well as parts of sub-Saharan Africa and Central America: unlike the more developed areas facing the same shift, it is suggested they would struggle to adapt due to limited social resilience, and so crop and lifestock in those places would leave what the authors have defined as a "safe climatic space". On a global scale, that results in 31% of crop and 34% of livestock production being outside of the safe climmatic space. In contrast, under the low-emissions SSP1-2.6 (a scenario compatible with the less ambitious Paris Agreement goals, 5% and 8% of crop and livestock production would leave that safe climatic space. [8]

See also

Related Research Articles

<span class="mw-page-title-main">Biome</span> Biogeographical unit with a particular biological community

A biome is a distinct geographical region with specific climate, vegetation, and animal life. It consists of a biological community that has formed in response to its physical environment and regional climate. Biomes may span more than one continent. A biome encompasses multiple ecosystems within its boundaries. It can also comprise a variety of habitats.

<span class="mw-page-title-main">Polar climate</span> Climate classification

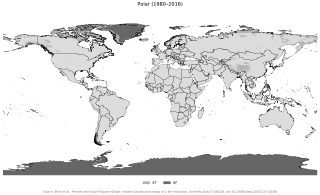
The polar climate regions are characterized by a lack of warm summers but with varying winters. Every month a polar climate has an average temperature of less than 10 °C (50 °F). Regions with a polar climate cover more than 20% of the Earth's area. Most of these regions are far from the equator and near the poles, and in this case, winter days are extremely short and summer days are extremely long. A polar climate consists of cool summers and very cold winters, which results in treeless tundra, glaciers, or a permanent or semi-permanent layer of ice. It is identified with the letter E in the Köppen climate classification.

<span class="mw-page-title-main">Temperate climate</span> Main climate class

In geography, the temperate climates of Earth occur in the middle latitudes, which span between the tropics and the polar regions of Earth. These zones generally have wider temperature ranges throughout the year and more distinct seasonal changes compared to tropical climates, where such variations are often small and usually only have precipitation differences.

<span class="mw-page-title-main">Tropics</span> Region of Earth surrounding the Equator

The tropics are the regions of Earth surrounding the Equator. They are defined in latitude by the Tropic of Cancer in the Northern Hemisphere at 23°26′10.2″ (or 23.43616°) N and the Tropic of Capricorn in the Southern Hemisphere at 23°26′10.2″ (or 23.43616°) S. The tropics are also referred to as the tropical zone and the torrid zone.

The Global 200 is the list of ecoregions identified by the World Wide Fund for Nature (WWF), the global conservation organization, as priorities for conservation. According to WWF, an ecoregion is defined as a "relatively large unit of land or water containing a characteristic set of natural communities that share a large majority of their species dynamics, and environmental conditions". For example, based on their levels of endemism, Madagascar gets multiple listings, ancient Lake Baikal gets one, and the North American Great Lakes get none.

<span class="mw-page-title-main">Mediterranean climate</span> Type of climate

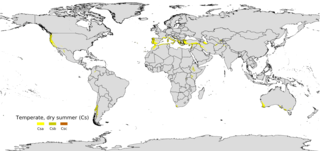
A Mediterranean climate, also called a dry summer climate, described by Köppen as Cs, is a temperate climate type that occurs in the lower mid-latitudes. Such climates typically have dry summers and wet winters, with summer conditions ranging from warm to hot and winter conditions typically being mild to cool. These weather conditions are typically experienced in the majority of Mediterranean-climate regions and countries, but remain highly dependent on proximity to the ocean, altitude and geographical location.

<span class="mw-page-title-main">Subtropics</span> Geographic and climate zone

The subtropical zones or subtropics are geographical and climate zones to the north and south of the tropics. Geographically part of the temperate zones of both hemispheres, they cover the middle latitudes from 23°26′10.2″ (or 23.43616°) to approximately 35° north and south. The horse latitudes lie within this range.

<span class="mw-page-title-main">Semi-arid climate</span> Climate with precipitation below potential evapotranspiration

A semi-arid climate, semi-desert climate, or steppe climate is a dry climate sub-type. It is located on regions that receive precipitation below potential evapotranspiration, but not as low as a desert climate. There are different kinds of semi-arid climates, depending on variables such as temperature, and they give rise to different biomes.

The life zone concept was developed by C. Hart Merriam in 1889 as a means of describing areas with similar plant and animal communities. Merriam observed that the changes in these communities with an increase in latitude at a constant elevation are similar to the changes seen with an increase in elevation at a constant latitude.

<span class="mw-page-title-main">Life zones of Peru</span>

When the Spanish arrived, they divided Peru into three main regions: the coastal region, that is bounded by the Pacific Ocean; the highlands, that is located on the Andean Heights, and the jungle, that is located on the Amazonian Jungle. But Javier Pulgar Vidal, a geographer who studied the biogeographic reality of the Peruvian territory for a long time, proposed the creation of eight Natural Regions. In 1941, he presented his thesis "Las Ocho Regiones Naturales del Perú" at the III General Assembly of the Pan-American Institute of Geography and History.

<span class="mw-page-title-main">Climate classification</span> Systems that categorize the worlds climates

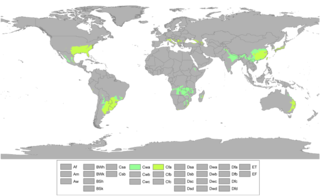
Climate classifications are systems that categorize the world's climates. A climate classification may correlate closely with a biome classification, as climate is a major influence on life in a region. One of the most used is the Köppen climate classification scheme first developed in 1884.

<span class="mw-page-title-main">Climate of the United States</span> Varies due to changes in latitude, and a range of geographic features

The climate of the United States varies due to changes in latitude, and a range of geographic features, including mountains and deserts. Generally, on the mainland, the climate of the U.S. becomes warmer the further south one travels, and drier the further west, until one reaches the West Coast.

<span class="mw-page-title-main">Humid subtropical climate</span> Transitional climatic zone

A humid subtropical climate is a temperate climate type characterized by hot and humid summers, and cool to mild winters. These climates normally lie on the southeast side of all continents, generally between latitudes 25° and 40° and are located poleward from adjacent tropical climates, and equatorward from either humid continental or oceanic climates. It is also known as warm temperate climate in some climate classifications.

<span class="mw-page-title-main">Montane ecosystems</span> Ecosystems found in mountains

Montane ecosystems are found on the slopes of mountains. The alpine climate in these regions strongly affects the ecosystem because temperatures fall as elevation increases, causing the ecosystem to stratify. This stratification is a crucial factor in shaping plant community, biodiversity, metabolic processes and ecosystem dynamics for montane ecosystems. Dense montane forests are common at moderate elevations, due to moderate temperatures and high rainfall. At higher elevations, the climate is harsher, with lower temperatures and higher winds, preventing the growth of trees and causing the plant community to transition to montane grasslands and shrublands or alpine tundra. Due to the unique climate conditions of montane ecosystems, they contain increased numbers of endemic species. Montane ecosystems also exhibit variation in ecosystem services, which include carbon storage and water supply.

<span class="mw-page-title-main">Trewartha climate classification</span> Categorical system for longer-range recurrent weather patterns of Earth, orig. 1966

The Trewartha climate classification (TCC) or the Köppen–Trewartha climate classification (KTC) is a climate classification system first published by American geographer Glenn Thomas Trewartha in 1966. It is a modified version of the Köppen–Geiger system, created to answer some of its deficiencies. The Trewartha system attempts to redefine the middle latitudes to be closer to vegetation zoning and genetic climate systems.

Vegetation classification is the process of classifying and mapping the vegetation over an area of the earth's surface. Vegetation classification is often performed by state based agencies as part of land use, resource and environmental management. Many different methods of vegetation classification have been used. In general, there has been a shift from structural classification used by forestry for the mapping of timber resources, to floristic community mapping for biodiversity management. Whereas older forestry-based schemes considered factors such as height, species and density of the woody canopy, floristic community mapping shifts the emphasis onto ecological factors such as climate, soil type and floristic associations. Classification mapping is usually now done using geographic information systems (GIS) software.

Land surface effects on climate are wide-ranging and vary by region. Deforestation and exploitation of natural landscapes play a significant role. Some of these environmental changes are similar to those caused by the effects of global warming.

<span class="mw-page-title-main">Highland temperate climate</span>

The highland temperate climates are a temperate climate sub-type, although located in tropical zone, isothermal and with characteristics different from others temperate climates like oceanic or mediterranean where they are often are included without proper differentiation.

References

  1. US EPA, OA (January 29, 2013). "About the National Health and Environmental Effects Research Laboratory (NHEERL)". US EPA. Archived from the original on April 28, 2013.
  2. Harris SA (1973). "Comments on the Application of the Holdridge System for Classification of World Life Zones as Applied to Costa Rica". Arctic and Alpine Research. 5 (3): A187–A191. JSTOR   1550169.
  3. Leemans, Rik (1990). "Possible Changes in Natural Vegetation Patterns Due to a Global Warming". National Geophysical Data Center (NOAA). Archived from the original on 2009-10-16.
  4. Lugo, A. E. (1999). "The Holdridge life zones of the conterminous United States in relation to ecosystem mapping". Journal of Biogeography. 26 (5): 1025–1038. Bibcode:1999JBiog..26.1025L. doi:10.1046/j.1365-2699.1999.00329.x. S2CID   11733879. Archived (PDF) from the original on 27 May 2015. Retrieved 27 May 2015.
  5. "potential_evapotranspiration". esdac.jrc.ec.europa.eu. Retrieved 2022-03-23.
  6. "Archived copy". agron-www.agron.iastate.edu. Archived from the original on 2020-01-28. Retrieved 2022-03-23.{{cite web}}: CS1 maint: archived copy as title (link)
  7. Parry, M. L.; Carter, T. R.; Konijn, N. T. (1988), The effects on Holdridge Life Zones, Dordrecht, The Netherlands: Springer, pp. 473–484, ISBN   978-94-009-2965-4 , retrieved 2022-03-23
  8. 1 2 3 4 Kummu, Matti; Heino, Matias; Taka, Maija; Varis, Olli; Viviroli, Daniel (21 May 2021). "Climate change risks pushing one-third of global food production outside the safe climatic space". One Earth. 4 (5): 720–729. Bibcode:2021OEart...4..720K. doi:10.1016/j.oneear.2021.04.017. PMC   8158176 . PMID   34056573.