List of German states by life expectancy

Last updated

Life expectancy in the German states in 2020/2022 for male Life expectancy map of Germany 2020-2022 for males -names.png
Life expectancy in the German states in 2020/2022 for male
Life expectancy in the German states in 2020/2022 for female Life expectancy map of Germany 2020-2022 for females -names.png
Life expectancy in the German states in 2020/2022 for female

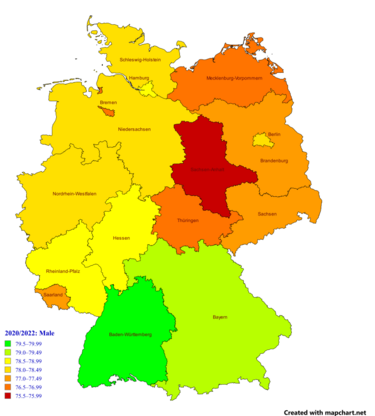
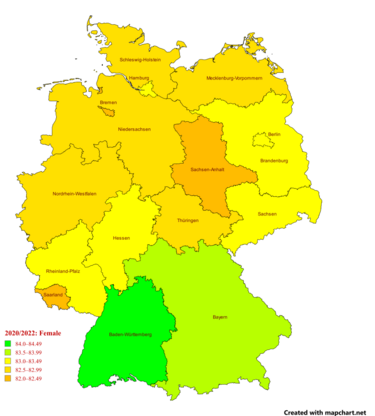
The official statistics of Germany, available on the Destatis website, do not include total life expectancy for the population as a whole. For a more correct comparison of regions with various differences in life expectancy for men and women, a column with the arithmetic mean of these indicators was added to the tables.

Contents

Destatis (2020/2022)

state malefemalesex gaparith. mean
Germany on average78.3383.184.8580.76
Baden-Württemberg 79.7284.114.3981.91
Bavaria 79.1183.644.5381.38
Hesse 78.8783.334.4681.10
Hamburg 78.5783.234.6680.90
Rhineland-Palatinate 78.5483.014.4780.78
Berlin 78.1183.295.1880.70
Schleswig-Holstein 78.4182.914.5080.66
Lower Saxony 78.0582.934.8880.49
North Rhine-Westphalia 78.1082.664.5680.38
Saxony 77.2783.496.2280.38
Brandenburg 77.2483.195.9580.22
Thuringia 76.9482.725.7879.83
Mecklenburg-Vorpommern 76.6882.796.1179.74
Saarland 77.2282.064.8479.64
Bremen 76.9382.305.3779.62
Saxony-Anhalt 75.7882.286.5079.03

Data source: Destatis [1] [2] [3]

Destatis (2016/2018)

This is a list of German states by life expectancy at birth (average of 2016 to 2018) according to the Federal Statistical Office of Germany. [4]

RankStateLife expectancy in years
(mean of both)
Life expectancy in years
(men)
Life expectancy in years
(women)
1Flag of Baden-Wurttemberg.svg  Baden-Württemberg 81.8879.6684.10
2Flag of Bavaria (lozengy).svg  Bavaria 81.5679.3383.56
3Flag of Hesse.svg  Hesse 81.3279.1583.48
4Flag of Hamburg.svg  Hamburg 80.9578.5383.37
5Flag of Saxony.svg  Saxony 80.9477.9783.91
6Flag of Rhineland-Palatinate.svg  Rhineland-Palatinate 80.8478.6283.06
7Flag of Berlin.svg  Berlin 80.7578.3083.19
8Flag of Brandenburg.svg  Brandenburg 80.5177.7683.26
9Flag of Schleswig-Holstein.svg  Schleswig-Holstein 80.4878.1882.78
10Flag of Lower Saxony.svg  Lower Saxony 80.4778.1182.82
10Flag of North Rhine-Westphalia.svg  North Rhine-Westphalia 80.4778.1782.76
12Flag of Thuringia.svg  Thuringia 80.2377.4483.02
13Flag of Mecklenburg-Western Pomerania.svg  Mecklenburg-Vorpommern 79.9576.7683.14
14Flag of Saarland.svg  Saarland 79.8877.6282.14
15Flag of Bremen.svg  Bremen 79.8377.1882.47
16Flag of Saxony-Anhalt (state).svg  Saxony-Anhalt 79.4676.2882.63
Flag of Germany.svg Germany80.8878.4883.27

Eurostat (2019—2022)

By default the table is sorted by 2022.

code region 20192019
→2021
20212021
→2022
20222019
→2022
overallmalefemaleF Δ MoveralloverallmalefemaleF Δ M
DE21 Upper Bavaria 82.880.984.73.8−0.482.4−0.182.380.284.44.2−0.5
DE14 Tübingen 82.480.384.64.30.082.4−0.382.180.084.24.2−0.3
DE11 Stuttgart 82.680.484.74.3−0.382.3−0.382.079.984.04.1−0.6
DE13 Freiburg 82.380.284.44.2−0.282.1−0.182.079.884.14.3−0.3
DE12 Karlsruhe 81.879.684.04.4−0.181.7−0.181.679.583.74.2−0.2
DE27 Swabia 82.180.084.24.2−0.581.6−0.181.579.483.74.3−0.6
DED2 Dresden 81.979.184.85.7−1.480.51.081.578.684.55.9−0.4
DE26 Lower Franconia 82.180.084.34.3−0.581.6−0.281.479.283.64.4−0.7
DE71 Darmstadt 82.180.184.03.9−0.581.6−0.381.379.383.34.0−0.8
DEA2 Cologne 81.379.283.44.2−0.181.2−0.380.978.783.04.3−0.4
DE22 Lower Bavaria 81.479.483.54.1−0.880.60.380.978.583.34.8−0.5
DE30 Berlin 81.579.183.94.8−0.581.0−0.180.978.383.45.1−0.6
DEB3 Rheinhessen-Pfalz 81.379.283.44.2−0.281.1−0.380.878.682.94.3−0.5
DE60 Hamburg 81.579.283.84.6−0.481.1−0.380.878.583.14.6−0.7
DE25 Middle Franconia 81.379.083.44.4−0.680.70.180.878.583.04.5−0.5
DEB2 Trier 81.779.683.74.1−0.181.6−1.080.678.482.94.5−1.1
DEA4 Detmold 81.679.283.94.7−0.381.3−0.780.678.383.04.7−1.0
DED5 Leipzig 81.078.184.05.9−0.780.30.380.677.683.76.1−0.4
DE23 Upper Palatinate 81.379.183.44.3−0.780.6−0.180.578.282.84.6−0.8
DE73 Kassel 81.379.083.64.6−0.780.6−0.280.478.282.74.5−0.9
DEF0 Schleswig-Holstein 80.978.683.34.70.181.0−0.680.478.282.54.3−0.5
DEB1 Koblenz 81.179.083.14.1−0.580.6−0.380.378.282.54.3−0.8
DE72 Giessen 81.078.883.24.4−0.480.6−0.380.378.082.74.7−0.7
DE94 Weser-Ems 81.078.683.44.8−0.180.9−0.680.378.082.74.7−0.7
DE40 Brandenburg 81.278.484.05.6−1.280.00.380.377.483.25.8−0.9
DED4 Chemnitz 80.877.883.96.1−1.879.01.380.377.383.36.0−0.5
DE93 Lüneburg 80.978.583.24.7−0.280.7−0.580.278.082.54.5−0.7
DEA3 Münster 81.178.783.44.7−0.680.5−0.380.278.082.44.4−0.9
DE92 Hanover 81.078.483.55.1−0.380.7−0.680.177.782.75.0−0.9
DE91 Braunschweig 80.678.482.94.5−0.280.4−0.480.077.782.34.6−0.6
DE24 Upper Franconia 81.278.783.64.9−0.980.3−0.380.077.482.65.2−1.2
DEA1 Düsseldorf 80.778.482.94.5−0.380.4−0.579.977.682.14.5−0.8
DEG0 Thuringia 80.778.083.55.5−1.679.10.779.877.082.65.6−0.9
DEA5 Arnsberg 80.478.082.74.7−0.579.9−0.279.777.481.94.5−0.7
DE80 Mecklenburg-Vorpommern 80.377.383.56.2−0.679.7−0.179.676.682.76.1−0.7
DEC0 Saarland 80.277.982.54.6−0.479.8−0.679.276.881.85.0−1.0
DE50 Bremen 80.778.083.35.3−0.580.2−1.079.276.681.85.2−1.5
DEE0 Saxony-Anhalt 80.077.083.16.1−1.478.60.278.875.782.16.4−1.2

Data source: Eurostat [5] [6]

Life expectancy in European regions by Eutostat -2019.png
Life expectancy in European regions by Eutostat -2022.png
Life expectancy in German regions in comparison with regions of other European countries in 2019 and 2022, according to Eurostat [5] [6]
(legends on the maps are identical)

Charts

See also

Related Research Articles

<span class="mw-page-title-main">Demographics of Germany</span>

The demography of Germany is monitored by the Statistisches Bundesamt. According to the most recent data, Germany's population is 84,607,016 making it the most populous country in the European Union and the nineteenth-most populous country in the world. The total fertility rate was rated at 1.58 in 2021, significantly below the replacement rate of 2.1. For a long time Germany had one of the world's lowest fertility rates of around 1.3 to 1.4, however there has been a small increase in recent years. Due to the low birth rate Germany has recorded more deaths than births every year since 1972, which means 2021 was the 50th consecutive year the German population would have decreased without immigration. However, due to immigration the population has actually increased during the last half-century. In 2019 the number of people with a foreign background was 26%; this category includes foreigners, naturalized citizens, ethnic German repatriates from Eastern Europe and the children of all of the above.

<span class="mw-page-title-main">Demographics of the European Union</span>

The demographics of the European Union show a highly populated, culturally diverse union of 27 member states. As of 1 January 2023, the population of the EU is around 448 million people.

<span class="mw-page-title-main">Old states of Germany</span> Ten states of Germany, previously states in former West Germany

The old states of Germany is a jargon referring to the ten of the sixteen states of the Federal Republic of Germany (FRG) that were part of West Germany and that unified with the eastern German Democratic Republic's 5 states, which are given the contrasting term new states of Germany. Usage of this terminology usually excludes one other state, Berlin, conterminous with the capital city of the reunified nation which used to be divided, with its western part linked with West Germany.

Obesity in Malta is a contemporary health issue. This problem is connected to several other illnesses and economic costs for the government. The causes for Malta's obesity are various and one of the leading aspects is physical inactivity.

References

  1. 1 2 3 "Deaths, life expectancy: Life expectancy by sex and state". Federal Statistical Office of Germany . Retrieved 3 February 2024.
  2. 1 2 "Sterbefälle und Lebenserwartung: Durchschnittliche fernere Lebenserwartung (Periodensterbetafel) in den Bundesländern für Männer". Federal Statistical Office of Germany (in German). Retrieved 3 February 2024.
  3. 1 2 "Sterbefälle und Lebenserwartung: Durchschnittliche fernere Lebenserwartung (Periodensterbetafel) in den Bundesländern für Frauen". Federal Statistical Office of Germany (in German). Retrieved 3 February 2024.
  4. "Lebenserwartung in Deutschland nach Bundesländern und Geschlecht 2015/2017 | Statistik". Statista (in German). Retrieved 2018-12-10.
  5. 1 2 "Life expectancy at birth by sex and NUTS 2 region". Eurostat. 14 March 2024. Retrieved 28 March 2024. — Dataset
  6. 1 2 "Life expectancy at birth by sex and NUTS 2 region". Eurostat. 14 March 2024. Retrieved 28 March 2024. — Table. For visualization use tab "Map"
  7. 1 2 3 4 "Life expectancy at birth, total - Germany". World Bank Group.
  8. "Life expectancy at birth: Germany". Our World in Data.
  9. 1 2 3 4 "Life expectancy and Healthy life expectancy, data by country". World Health Organization. 2020. Retrieved 1 February 2024.