Manchester | |
---|---|
Former Borough constituency for the House of Commons | |
County | Lancashire (now Greater Manchester) |
Major settlements | Manchester |
1832–1885 | |
Seats | 1832–1868: Two 1868–1885: Three |
Created from | Lancashire |
Replaced by | Manchester East Manchester North Manchester North East Manchester North West Manchester South Manchester South West |
1654–1660 | |
Type of constituency | Borough constituency |
Manchester was a Parliamentary borough constituency in the county of Lancashire which was represented in the House of Commons of the Parliament of the United Kingdom. Its territory consisted of the city of Manchester.
Manchester had first been represented in Parliament in 1654, when it was granted one seat in the First Protectorate Parliament. However, as with other boroughs enfranchised during the Commonwealth, it was disenfranchised at the Restoration of the monarchy in 1660.
The subsequent growth of Manchester into a major industrial city left its lack of representation a major anomaly, and demands for a seat in Parliament led to a mass public meeting in August 1819. This peaceful rally of 60,000 pro-democracy reformers, men, women and children, was attacked by armed cavalry resulting in 15 deaths and over 600 injuries, [1] and became known as the Peterloo Massacre.
Reform was attempted unsuccessfully by Lord John Russell, whose bills in 1828 and 1830 were rejected by the Commons. The city was finally enfranchised by the Reform Act of 1832, and at the 1832 general election, Manchester returned two Members of Parliament (MPs). The Reform Act 1867 increased this in 1868 to three Members of Parliament.
Under the Redistribution of Seats Act 1885, the constituency was abolished with effect from the 1885 general election, when the city was split into six new single-member divisions: East, North, North East, North West, South, and South West.
Election | 1st Member | |
---|---|---|
1654 | Charles Worsley | |
1656 | Richard Radcliffe |
Election | 1st Member [2] | 1st Party [3] | 2nd Member | 2nd Party | 3rd Member | 3rd Party | ||||
---|---|---|---|---|---|---|---|---|---|---|
1832 | Mark Philips | Whig [4] [5] [6] | Charles Poulett-Thomson | Whig [4] [5] [6] | 2 seats until 1868 3 seats from 1868 to 1885 | |||||
1839 by-election | Robert Hyde Greg | Whig [4] [7] [8] | ||||||||
1841 | Thomas Milner Gibson | Radical [9] [10] [11] [12] [13] | ||||||||
1847 | John Bright | Radical | ||||||||
1857 | John Potter | Whig [14] [15] | James Aspinall Turner | Whig [14] [15] | ||||||
1858 by-election | Thomas Bazley | Whig [16] | ||||||||
1859 | Liberal | Liberal | ||||||||
1865 | Edward James | Liberal | ||||||||
1867 by-election | Jacob Bright | Liberal | ||||||||
1868 | Hugh Birley | Conservative | ||||||||
1874 | William Romaine Callender | Conservative | ||||||||
1876 by-election | Jacob Bright | Liberal | ||||||||
1880 | John Slagg | Liberal | ||||||||
1883 by-election | William Houldsworth | Conservative | ||||||||
1885 | Constituency abolished (1885) |
Party | Candidate | Votes | % | ±% | |
---|---|---|---|---|---|
Conservative | William Houldsworth | 18,188 | 74.5 | +29.4 | |
Liberal | Richard Pankhurst | 6,216 | 25.5 | −29.4 | |
Majority | 11,972 | 49.0 | N/A | ||
Turnout | 24,404 | 46.2 | −27.8 (est) | ||
Registered electors | 52,831 | ||||
Conservative hold | Swing | +29.4 | |||
Party | Candidate | Votes | % | ±% | |
---|---|---|---|---|---|
Liberal | John Slagg | 24,959 | 27.5 | +2.6 | |
Liberal | Jacob Bright | 24,789 | 27.4 | +3.3 | |
Conservative | Hugh Birley | 20,594 | 22.7 | −3.0 | |
Conservative | William Houldsworth | 20,268 | 22.4 | −2.9 | |
Majority | 4,521 | 5.0 | N/A | ||
Turnout | 45,305 (est) | 74.0 (est) | +9.5 | ||
Registered electors | 61,234 | ||||
Liberal hold | Swing | ||||
Liberal gain from Conservative | Swing | ||||
Conservative hold | Swing | ||||
Party | Candidate | Votes | % | ±% | |
---|---|---|---|---|---|
Liberal | Jacob Bright | 22,770 | 52.0 | +3.0 | |
Conservative | Francis Powell [18] | 20,985 | 48.0 | −3.0 | |
Majority | 1,785 | 4.0 | N/A | ||
Turnout | 43,755 | 70.5 | +6.0 | ||
Registered electors | 62,074 | ||||
Liberal gain from Conservative | Swing | +3.0 | |||
Party | Candidate | Votes | % | ±% | |
---|---|---|---|---|---|
Conservative | Hugh Birley | 19,984 | 25.7 | +4.1 | |
Conservative | William Romaine Callender | 19,649 | 25.3 | +7.6 | |
Liberal | Thomas Bazley | 19,325 | 24.9 | +3.3 | |
Liberal | Jacob Bright | 18,727 | 24.1 | +5.8 | |
Majority | 922 | 1.2 | N/A | ||
Turnout | 38,843 (est) | 64.5 (est) | +5.2 | ||
Registered electors | 60,222 | ||||
Conservative hold | Swing | −0.2 | |||
Conservative gain from Liberal | Swing | +1.5 | |||
Liberal hold | Swing | −1.3 | |||
Party | Candidate | Votes | % | ±% | |
---|---|---|---|---|---|
Conservative | Hugh Birley | 15,486 | 21.6 | N/A | |
Liberal | Thomas Bazley | 14,192 | 19.8 | −12.6 | |
Liberal | Jacob Bright | 13,154 | 18.3 | −4.5 | |
Conservative | Joseph Hoare | 12,684 | 17.7 | N/A | |
Liberal | Ernest Charles Jones | 10,662 | 14.9 | N/A | |
Liberal | Mitchell Henry | 5,236 | 7.3 | N/A | |
Turnout | 28,620 (est) | 59.3 (est) | +2.6 | ||
Registered electors | 48,256 | ||||
Majority | 4,824 | 6.7 | N/A | ||
Conservative gain from Liberal | Swing | ||||
Majority | 1,508 | 2.1 | −2.5 | ||
Liberal hold | Swing | ||||
Liberal win (new seat) |
Party | Candidate | Votes | % | ±% | |
---|---|---|---|---|---|
Liberal | Jacob Bright | 8,160 | 53.6 | +30.8 | |
Conservative | John Marsland Bennett [19] | 6,420 | 42.2 | New | |
Liberal | Mitchell Henry [20] | 643 | 4.2 | N/A | |
Majority | 1,740 | 11.4 | +6.8 | ||
Turnout | 15,223 | 70.7 | +14.0 | ||
Registered electors | 21,542 | ||||
Liberal hold | Swing | N/A | |||
Party | Candidate | Votes | % | ±% | |
---|---|---|---|---|---|
Liberal | Thomas Bazley | 7,909 | 32.4 | +2.8 | |
Liberal | Edward James | 6,698 | 27.4 | N/A | |
Liberal | Jacob Bright | 5,562 | 22.8 | N/A | |
Liberal | Abel Heywood | 4,242 | 17.4 | −4.0 | |
Majority | 1,136 | 4.6 | −2.7 | ||
Turnout | 12,206 (est) | 56.7 (est) | −12.8 | ||
Registered electors | 21,542 | ||||
Liberal hold | Swing | N/A | |||
Party | Candidate | Votes | % | ±% | |
---|---|---|---|---|---|
Liberal | Thomas Bazley | 7,545 | 29.6 | −1.1 | |
Liberal | James Aspinall Turner | 7,300 | 28.6 | −0.2 | |
Liberal | Abel Heywood | 5,448 | 21.4 | N/A | |
Conservative | Joseph Denman [22] [23] | 5,201 | 20.4 | New | |
Majority | 1,852 | 7.2 | −1.1 | ||
Turnout | 12,747 (est) | 69.5 (est) | −6.1 | ||
Registered electors | 18,334 | ||||
Liberal hold | Swing | ||||
Party | Candidate | Votes | % | ±% | |
---|---|---|---|---|---|
Whig | Thomas Bazley | Unopposed | |||
Whig hold | |||||
Party | Candidate | Votes | % | ±% | |
---|---|---|---|---|---|
Whig | John Potter | 8,368 | 30.7 | ||
Whig | James Aspinall Turner | 7,854 | 28.8 | ||
Radical | Thomas Milner Gibson | 5,588 | 20.5 | −8.9 | |
Radical | John Bright | 5,458 | 20.0 | −8.0 | |
Majority | 2,266 | 8.3 | N/A | ||
Turnout | 13,634 (est) | 75.6 (est) | +5.3 | ||
Registered electors | 18,044 | ||||
Whig gain from Radical | Swing | ||||
Whig hold | Swing | ||||
Party | Candidate | Votes | % | ±% | |
---|---|---|---|---|---|
Whig | Thomas Milner Gibson | 5,762 | 29.4 | N/A | |
Radical | John Bright | 5,475 | 28.0 | N/A | |
Conservative | George Loch | 4,364 | 22.3 | New | |
Conservative | Joseph Denman | 3,969 | 20.3 | New | |
Majority | 1,111 | 5.7 | N/A | ||
Turnout | 9,785 (est) | 70.3 (est) | N/A | ||
Registered electors | 13,921 | ||||
Radical hold | Swing | N/A | |||
Party | Candidate | Votes | % | ±% | |
---|---|---|---|---|---|
Radical | John Bright | Unopposed | |||
Radical | Thomas Milner Gibson | Unopposed | |||
Registered electors | 12,841 | ||||
Radical hold | |||||
Radical gain from Whig |
Party | Candidate | Votes | % | ±% | |
---|---|---|---|---|---|
Radical | Thomas Milner Gibson | Unopposed | |||
Radical hold | |||||
Party | Candidate | Votes | % | ±% | |
---|---|---|---|---|---|
Whig | Mark Philips | 3,695 | 28.3 | −49.3 | |
Radical | Thomas Milner Gibson | 3,575 | 27.3 | N/A | |
Conservative | George Murray | 3,115 | 23.8 | +12.6 | |
Conservative | William Entwisle | 2,692 | 20.6 | +9.4 | |
Turnout | 6,539 (est) | 60.4 (est) | c. +5.5 | ||
Registered electors | 10,818 | ||||
Majority | 120 | 1.0 | −13.4 | ||
Whig hold | Swing | −31.0 | |||
Majority | 460 | 3.5 | N/A | ||
Radical gain from Whig | Swing | ||||
Party | Candidate | Votes | % | ±% | |
---|---|---|---|---|---|
Whig | Robert Hyde Greg | 3,096 | 50.5 | −27.1 | |
Conservative | George Murray | 2,969 | 48.4 | +26.0 | |
Radical | Thomas Perronet Thompson | 63 | 1.0 | N/A | |
Majority | 127 | 2.1 | −12.3 | ||
Turnout | 6,128 | 54.8 | −0.1 | ||
Registered electors | 11,185 | ||||
Whig hold | Swing | −26.6 | |||
Party | Candidate | Votes | % | ±% | |
---|---|---|---|---|---|
Whig | Charles Poulett-Thomson | 4,158 | 40.8 | +6.0 | |
Whig | Mark Philips | 3,750 | 36.8 | +4.0 | |
Conservative | William Ewart Gladstone | 2,281 | 22.4 | −3.9 | |
Majority | 1,469 | 14.4 | +7.9 | ||
Turnout | 6,146 | 54.9 | −11.5 | ||
Registered electors | 11,185 | ||||
Whig hold | Swing | +4.0 | |||
Whig hold | Swing | +3.0 | |||
Party | Candidate | Votes | % | ±% | |
---|---|---|---|---|---|
Whig | Charles Poulett-Thomson | 3,183 | 63.4 | −4.2 | |
Conservative | Benjamin Braidley | 1,837 | 36.6 | +10.3 | |
Majority | 1,346 | 26.8 | +20.3 | ||
Turnout | 5,020 | 59.5 | −6.9 | ||
Registered electors | 8,432 | ||||
Whig hold | Swing | −4.7 | |||
Party | Candidate | Votes | % | ±% | |
---|---|---|---|---|---|
Whig | Charles Poulett-Thomson | 3,355 | 34.8 | +13.5 | |
Whig | Mark Philips | 3,163 | 32.8 | +2.6 | |
Conservative | Benjamin Braidley | 2,535 | 26.3 | +10.2 | |
Radical | Charles Wolseley | 583 | 6.1 | −7.4 | |
Majority | 628 | 6.5 | +4.1 | ||
Turnout | 5,595 | 66.4 | −11.9 | ||
Registered electors | 8,432 | ||||
Whig hold | Swing | +8.6 | |||
Whig hold | Swing | +3.2 | |||
Party | Candidate | Votes | % | ||
---|---|---|---|---|---|
Whig | Mark Philips | 2,923 | 30.2 | ||
Whig | Charles Poulett-Thomson | 2,068 | 21.3 | ||
Whig | Samuel Jones-Loyd | 1,832 | 18.9 | ||
Tory | John Thomas Hope | 1,560 | 16.1 | ||
Radical | William Cobbett | 1,305 | 13.5 | ||
Majority | 236 | 2.4 | |||
Turnout | 5,267 | 78.3 | |||
Registered electors | 6,726 | ||||
Whig win (new seat) | |||||
Whig win (new seat) |
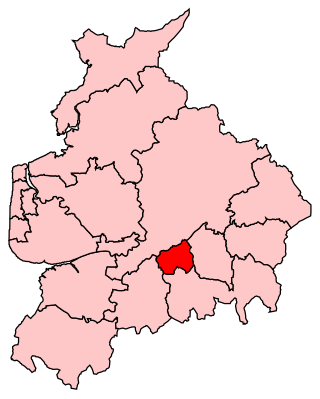
Blackburn is a constituency in Lancashire, England, which has been represented in the House of Commons of the UK Parliament since 2015 by Kate Hollern of the Labour Party. From 1979 to 2015, it was represented by Jack Straw who served under the Labour leaders of Neil Kinnock and John Smith and the Labour governments of Tony Blair and Gordon Brown.
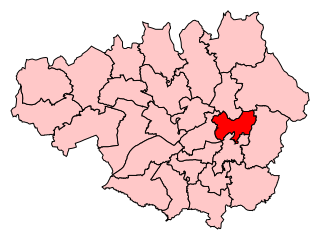
Ashton-under-Lyne is a constituency in the House of Commons of the UK Parliament. It has been represented since 2015 by Angela Rayner, who has served as Deputy Leader of the Labour Party since 2020.
Stockport is a constituency represented in the House of Commons of the UK Parliament since 2019 by Navendu Mishra of the Labour Party.
Newark is a constituency in Nottinghamshire, England. It is currently represented by Robert Jenrick of the Conservative Party who won the seat in a by-election on 5 June 2014, following the resignation of Patrick Mercer in April 2014.
Greenock was a burgh constituency represented in the House of Commons of the Parliament of the United Kingdom from 1832 until 1974, when it was abolished and its area was merged into the new Greenock and Port Glasgow constituency.
Lancaster was a constituency of the House of Commons of the Parliament of England then of the Parliament of Great Britain from 1707 to 1800 and of the Parliament of the United Kingdom from 1801 to 1867, centred on the historic city of Lancaster in north-west England. It was represented by two Members of Parliament until the constituency was disenfranchised for corruption in 1867.
Sunderland was a borough constituency in the House of Commons of the United Kingdom, created by the Reform Act 1832 for the 1832 general election. It elected two Members of Parliament (MPs) by the bloc vote system of election. It was split into the single-member seats of Sunderland North and Sunderland South for the 1950 general election.
Clitheroe was a parliamentary constituency in Lancashire.
Bradford was a parliamentary constituency in Bradford, in the West Riding of Yorkshire.
Bury was a borough constituency centred on the town of Bury in Lancashire. It returned one Member of Parliament (MP) to the House of Commons of the Parliament of the United Kingdom.
Oldham was a parliamentary constituency centred on the town of Oldham, England. It returned two Members of Parliament (MPs) to the House of Commons of the Parliament of the United Kingdom. The constituency was created by the Great Reform Act of 1832 and was abolished for the 1950 general election when it was split into the Oldham East and Oldham West constituencies.
South Lancashire, formally called the Southern Division of Lancashire or Lancashire Southern, is a former county constituency of the South Lancashire area in England. It returned two Members of Parliament (MPs) to the British House of Commons from 1832 to 1861, and then from a very narrow reform of that year, three until it was further split in 1868.
North Lancashire was a county constituency of the House of Commons of the Parliament of the United Kingdom. It was represented by two Members of Parliament. The constituency was created by the Great Reform Act of 1832 by the splitting of Lancashire constituency into Northern and Southern divisions.
South East Lancashire was a county constituency of the House of Commons of the Parliament of the United Kingdom. It was represented by two Members of Parliament. The constituency was created by the Reform Act of 1867 by the splitting of the South Lancashire constituency into South-West and South-East divisions.
Bolton was a borough constituency centred on the town of Bolton in the county of Lancashire. It returned two Members of Parliament (MPs) to the House of Commons for the Parliament of the United Kingdom, elected by the bloc vote system.
Southampton was a parliamentary constituency which was represented in the English and after 1707 British House of Commons. Centred on the town of Southampton, it returned two members of parliament (MPs) from 1295 until it was abolished for the 1950 general election.
Brighton was a parliamentary constituency of the House of Commons of the Parliament of the United Kingdom from 1832 until it was divided into single-member seats from the 1950 United Kingdom general election. Covering the seaside towns of Brighton and Hove in East Sussex, it elected two Members of Parliament (MP) by the block vote system of election.
Penryn and Falmouth was the name of a constituency in Cornwall, England, UK, represented in the House of Commons of the Parliament of the United Kingdom from 1832 until 1950. From 1832 to 1918 it was a parliamentary borough, initially returning two Members of Parliament (MPs), elected by the bloc vote system.
Kendal was a parliamentary borough centred on the town of Kendal in Westmorland. It returned one Member of Parliament (MP) to the House of Commons of the Parliament of the United Kingdom, elected by the first past the post system.
Newcastle-upon-Tyne was a parliamentary borough in the county of Northumberland of the House of Commons of England from 1283 to 1706, then of the House of Commons of Great Britain from 1707 to 1800 and of the House of Commons of the United Kingdom from 1801 to 1918. It returned two Members of Parliament (MPs), elected by the bloc vote system.