PANTHER

Last updated
PANTHER
Content
DescriptionThe PANTHER database classifies gene products into families
Data types
captured
Gene families
Contact
Research center University of Southern California
AuthorsPaul D Thomas
Primary citation PMID   12520017
Access
Website
Miscellaneous
Bookmarkable
entities
yes

In bioinformatics, the PANTHER (protein analysis through evolutionary relationships) classification system is a large curated biological database of gene/protein families and their functionally related subfamilies that can be used to classify and identify the function of gene products. [1] PANTHER is part of the Gene Ontology Reference Genome Project [2] designed to classify proteins and their genes for high-throughput analysis.

Contents

The project consists of both manual curation and bioinformatics algorithms. [3] Proteins are classified according to family (and subfamily), molecular function, biological process and pathway. It is one of the databases feeding into the European Bioinformatics Institute's InterPro database. [4] —Application of PANTHER—The most important application of PANTHER is to accurately infer the function of uncharacterized genes from any organism based on their evolutionary relationships to genes with known functions. [3] By combining gene function, ontology, pathways and statistical analysis tools, PANTHER enables biologists to analyze large-scale, genome-wide data obtained from the current advance technology including: sequencing, proteomics or gene expression experiments. [5] Shortly, using the data and tools on the PANTHER, users will be able to: [6]

PANTHER history

Phylogenetic tree

In PANTHER there is a phylogenetic tree for each of the protein families. The annotation of tree is done based on the following criteria:

To generate phylogenetic trees, PANTHER uses GIGA algorithm. GIGA uses species tree to develop tree construction. On every iteration it attempts to reconcile tree in event form of speciation and gene duplication.

PANTHER library data generation process

The process for data generation is divided into three steps:

  1. Family clustering
  2. Pythologentic tree building
  3. Annotation of tree nodes

Family clustering

Sequence set

PANTHER trees depicts gene family evolution from a broad selection of genomes which are fully sequenced. PANTHER have one sequence per gene so that the tree can represent event occurred over the course of evolution i.e duplication, speciation. PANTHER genomes set are selected based on the following criteria:

  • The set should include a major experimental model organism, this will assist in depicting functional information of the organism which are less studied.
  • The set should include a broad taxonomic range of other genomes, preferably fully sequenced and annotated, this will assist in relating experimental model organism.

Family clusters

Following are the requirements for being family clusters in PANTHER:

  1. The family must contain at least five members among which at least one gene has to be from a GO reference genome.
  2. In order to support phylogenetic inference, the family must contain a high quality sequence alignment.
  3. The assessment of multiple aligned sequence is done by assessing a length of the aligned sequence, at least 30 sites aligned across 75% or more of family members.

Phylogenetic tree building

For each family multiple sequence are aligned using a default setting of MAFFT, any column which is aligned less than 75% of the sequence is removed. This data is then used as an input for GIGA program. The output tree from GIGA are labelled. Each internal node is labelled as whether divergence event happened as speciation or gene duplication.

Annotation of tree nodes

Each node in PANTHER tree is annotated with heritable attribute. Heritable attribute can be of three types subfamily membership, gene function and protein class membership. These annotation of nodes applies to primary sequence which was used to construct tree. In applying these annotation to primary sequence simple evolutionary principle is used i.e. each node annotation is propagated by its decedent node. [3]

PANTHER components

PANTHER/LIB (PANTHER library): Library consists of collection of books. Each of these books represents a protein family. There are a Hidden Markov Model (HMM), a multiple sequence alignment (MSA) and a family tree for each protein family in the library. [1]

PANTHER/X (PANTEHR index): Index contains abbreviated ontology which assist in summarizing, navigating molecular function and biological function. Although PANTHER/X ontology has a hierarchical organization, it is a directed acyclic graph and so when it is biologically justified, child categories appear under more than one parent. PANTHER/X has been mapped to GO and arranged in a different way to facilitate large scale analysis of proteins. [1]

PANTHER pathways

PANTHER includes 176 pathway using CellDesigner tool. PANTHER pathways can be downloaded in the following file formats.

Recent versions of PANTHER and their statistics and updates

Version 6.0

Version 6 uses UniProt [11] sequences as training sequences. There are 19132 UniProt training sequences directly associated with the pathway components. This version has ~1500 reactions in 130 pathways, and the number of pathways associated with subfamilies were expanded. PANTHER became a member of the InterPro Consortium. The availability of PANTHER data was improved (the HMMs can be downloaded by FTP). The PANTHER/LIB version 6.1 contains 221609 UniProt sequences from 53 organisms, grouped into 5546 families and 24561 subfamilies. [12] (2006)

Version 7.0

In this version the phylogenetic trees represent speciation and gene duplication events. Identification of gene orthologs is possible. There are more support for alternative database identifiers for genes, proteins and microarray probes. PANTHER version 7 uses the SBGN standard to depict biological pathways. It includes 48 set of genomes. To define the new families and in collaboration with the European Bioinformatics Institute’s InterPro group, [4] approximately 1000 families of non-animal genomes were added in this version. The sources of gene sets included model organism databases, Ensembl [13] genome annotation and Entrez Gene. [14] Since this version, a stable identifier to each node in the tree is used. This stable identifier is a nine-digit number with the prefix PTN (stand for PANTHER Tree Node). [3] [15] (2009)

Version 8.0 (2012)

The reference proteome [16] set maintained by the UniProt resource is used in this version of PANTHER and so the source of gene sets is UniProt. It includes 82 set of genomes (approximately double compared with version 7) and 991985 protein coding genes from which 642319 genes (64.75%) have been used for family clusters. PANTHER website is redesigned to facilitate common user workflow. [3]

Version 9.0 (2014)

This version contains 7180 protein families, divided into 52,768 functionally distinct protein subfamilies. Version 9.0 has genomes of all 85 organisms. [17] [6]

Version 11.1 (2016)

This version contains 78442 subfamilies and 1,064,054 genes annotated.

PANTHER website

The home page of PANTHER website shows several folder tabs for major workflows, including: gene list analysis, browse, sequence search, cSNP scoring, and keyword search. The details about each of these workflow are provided below.

Gene list analysis

This tab is selected by default because this the most frequently used option. You can enter valid IDs in the box or upload a file, then select list type, choose organism of interest and select the type of analysis.

A practical example: Let's try this workflow using an example of a small gene list containing three genes AKT1, AKT2, AKT3. We first type these gene names within the box and separate them by comma (or space). We select "ID list" as list type, "Homo Sapiens" (human) as organism, and " Functional classification viewed in gene list" as the type of operation; then click submit. It gives you the information for all the three genes which are:

  1. Gene IDs from Ensembl and protein IDs from Uniprot: in terms of this example, you must see "ENSG00000142208" and "P31749".
  2. Mapped IDs: these are simply the names of the genes which have been mapped to your query (AKT1, AKT2 and AKT3)
  3. Gene names, gene symbols, and the orthologs: the orthologs are clickable and by clicking on them you can see the list of other organisms and their IDs as well as the type of orthologs ("LDO" for least diverged ortholog, "O" for other which are more diverged orthologs, and "P" for paralogs).
  4. PANTHER family and subfamily: This will give you the name of family and subfamily for your genes. There are some links, e.g. a link to the family tree, which is clickable. Finally you will have the genes from different species assigned to that subfamily. In this example you have the PANTHER subfamily "PTHR24352:SF30" for AKT1.
  5. GO molecular function: This tell you what are the functions of your query gene; e.g. AKT1 has protein kinase activity and can selectively and non-covalently interact with calcium ions, calmodulin, and phospholipids.
  6. GO biological process: By looking at this column, you will understand what biological processes the gene involved in; e.g. AKT1 has role in gamete generation, apoptosis, cell cycle, etc.
  7. GO cellular component: It tells you where in the cell you can find your query protein. In our example, the information is not available but if you try another examples (such as the gene p53), you will see some cellular components such as "nucleus", "cytoplasm", "chromosomes", etc.
  8. PANTHER protein class: this gives you the names and IDs of PANTHER protein class for each of the genes; e.g. AKT1 is under PANTHER protein class "non-receptor serine/threonine protein kinase" with class ID "PC00167". You can also see its parent and child lineage.
  9. Pathways: A list of clickable names of the pathways in which your query gene exists will be shown; e.g. AKT1 is involved in several pathways such as "Hypoxia response via HIF", "Apoptosis signaling pathway", "PI3 kinase pathway", etc.
  10. Species: This is the name of species you have chosen; in this case we chose "Homo sapiens".

Browse

Using this folder tab and by selecting the ontology you are interested in, you can browse different classification. It is also possible to select more than one ontology; in this case, the results will meet the criteria from all the selections. You are able to see the association between ontology terms and PANTHER families, subfamilies and training sequences.

By putting the protein sequence in the Sequence Search box, PANTHER will search against a library of family and subfamily HMMs, and return the subfamily that best matches the sequence. If you click on the subfamily name, it will give some details, e.g. the genes related to that subfamily and the ability to view the subfamily within larger family tree. By downloading the PANTHER scoring tool from download page, you will be able to score many sequences against PANTHER HMMs.

cSNP scoring

Using this folder tab, you are able to do evolution analysis of coding SNPs. You must enter a protein sequence in the first box and the substitutions relative to this protein sequence in the second box; this substitutions should be entered in the standard amino acid substitution format, e.g. L46P. PANTHER will use an alignment of evolutionarily related proteins, calculate the substitution position-specific evolutionary conservation (subPSEC) and estimate the likelihood of this nonsynonymous coding SNP to lead a functional effect on the protein. This tool uses data from PANTHER version 6.1 for technical reasons. One of the new features of PANTHER is that if you want to analyze a lot of SNPs, you can go to the download page and download the PANTHER Coding Snp Analysis tool.

Entering a search term in the keyword search box, PANTHER will give you the number of records matching your keyword for genes, families, pathways and ontology terms. You can filter them by determining the species of interest or by refining the search using other criteria. To view the details of the gene, you must click on the gene identifier.

Related Research Articles

<span class="mw-page-title-main">Sequence homology</span> Shared ancestry between DNA, RNA or protein sequences

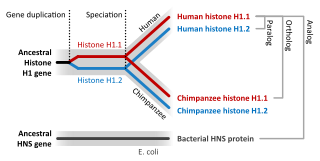
Sequence homology is the biological homology between DNA, RNA, or protein sequences, defined in terms of shared ancestry in the evolutionary history of life. Two segments of DNA can have shared ancestry because of three phenomena: either a speciation event (orthologs), or a duplication event (paralogs), or else a horizontal gene transfer event (xenologs).

<span class="mw-page-title-main">UniProt</span> Database of protein sequences and functional information

UniProt is a freely accessible database of protein sequence and functional information, many entries being derived from genome sequencing projects. It contains a large amount of information about the biological function of proteins derived from the research literature. It is maintained by the UniProt consortium, which consists of several European bioinformatics organisations and a foundation from Washington, DC, United States.

The Rat Genome Database (RGD) is a database of rat genomics, genetics, physiology and functional data, as well as data for comparative genomics between rat, human and mouse. RGD is responsible for attaching biological information to the rat genome via structured vocabulary, or ontology, annotations assigned to genes and quantitative trait loci (QTL), and for consolidating rat strain data and making it available to the research community. They are also developing a suite of tools for mining and analyzing genomic, physiologic and functional data for the rat, and comparative data for rat, mouse, human, and five other species.

<span class="mw-page-title-main">KEGG</span> Collection of bioinformatics databases

KEGG is a collection of databases dealing with genomes, biological pathways, diseases, drugs, and chemical substances. KEGG is utilized for bioinformatics research and education, including data analysis in genomics, metagenomics, metabolomics and other omics studies, modeling and simulation in systems biology, and translational research in drug development.

InterPro is a database of protein families, protein domains and functional sites in which identifiable features found in known proteins can be applied to new protein sequences in order to functionally characterise them.

The Saccharomyces Genome Database (SGD) is a scientific database of the molecular biology and genetics of the yeast Saccharomyces cerevisiae, which is commonly known as baker's or budding yeast. Further information is located at the Yeastract curated repository.

<span class="mw-page-title-main">PHI-base</span>

The Pathogen-Host Interactions database (PHI-base) is a biological database that contains manually curated information on genes experimentally proven to affect the outcome of pathogen-host interactions. The database has been maintained by researchers at Rothamsted Research and external collaborators since 2005. PHI-base has been part of the UK node of ELIXIR, the European life-science infrastructure for biological information, since 2016.

FlyBase is an online bioinformatics database and the primary repository of genetic and molecular data for the insect family Drosophilidae. For the most extensively studied species and model organism, Drosophila melanogaster, a wide range of data are presented in different formats.

<span class="mw-page-title-main">MicrobesOnline</span>

MicrobesOnline is a publicly and freely accessible website that hosts multiple comparative genomic tools for comparing microbial species at the genomic, transcriptomic and functional levels. MicrobesOnline was developed by the Virtual Institute for Microbial Stress and Survival, which is based at the Lawrence Berkeley National Laboratory in Berkeley, California. The site was launched in 2005, with regular updates until 2011.

SUPERFAMILY is a database and search platform of structural and functional annotation for all proteins and genomes. It classifies amino acid sequences into known structural domains, especially into SCOP superfamilies. Domains are functional, structural, and evolutionary units that form proteins. Domains of common Ancestry are grouped into superfamilies. The domains and domain superfamilies are defined and described in SCOP. Superfamilies are groups of proteins which have structural evidence to support a common evolutionary ancestor but may not have detectable sequence homology.

Protein function prediction methods are techniques that bioinformatics researchers use to assign biological or biochemical roles to proteins. These proteins are usually ones that are poorly studied or predicted based on genomic sequence data. These predictions are often driven by data-intensive computational procedures. Information may come from nucleic acid sequence homology, gene expression profiles, protein domain structures, text mining of publications, phylogenetic profiles, phenotypic profiles, and protein-protein interaction. Protein function is a broad term: the roles of proteins range from catalysis of biochemical reactions to transport to signal transduction, and a single protein may play a role in multiple processes or cellular pathways.

<span class="mw-page-title-main">DNA annotation</span> The process of describing the structure and function of a genome

In molecular biology and genetics, DNA annotation or genome annotation is the process of describing the structure and function of the components of a genome, by analyzing and interpreting them in order to extract their biological significance and understand the biological processes in which they participate. Among other things, it identifies the locations of genes and all the coding regions in a genome and determines what those genes do.

<span class="mw-page-title-main">OrthoDB</span>

OrthoDB presents a catalog of orthologous protein-coding genes across vertebrates, arthropods, fungi, plants, and bacteria. Orthology refers to the last common ancestor of the species under consideration, and thus OrthoDB explicitly delineates orthologs at each major radiation along the species phylogeny. The database of orthologs presents available protein descriptors, together with Gene Ontology and InterPro attributes, which serve to provide general descriptive annotations of the orthologous groups, and facilitate comprehensive orthology database querying. OrthoDB also provides computed evolutionary traits of orthologs, such as gene duplicability and loss profiles, divergence rates, sibling groups, and gene intron-exon architectures.

PhylomeDB is a public biological database for complete catalogs of gene phylogenies (phylomes). It allows users to interactively explore the evolutionary history of genes through the visualization of phylogenetic trees and multiple sequence alignments. Moreover, phylomeDB provides genome-wide orthology and paralogy predictions which are based on the analysis of the phylogenetic trees. The automated pipeline used to reconstruct trees aims at providing a high-quality phylogenetic analysis of different genomes, including Maximum Likelihood tree inference, alignment trimming and evolutionary model testing.

The human gene Chromosome 3 open reading frame 14 is a gene of uncertain function located at 3p14.2 near fragile site FRBA3—which falls between this gene and the centromere. Its protein is expected to localize to the nucleus and bind DNA. Orthologs have been identified in all of the major animal groups, minus amphibians and insects, tracing as far back as the sea anemone; indicating an origin of over 1000 mya, highlighting its importance in the animal genome.

DisProt is a manually curated biological database of intrinsically disordered proteins (IDPs) and regions (IDRs). DisProt annotations cover state information on the protein but also, when available, its state transitions, interactions and functional aspects of disorder detected by specific experimental methods. DisProt is hosted and maintained in the BioComputing UP laboratory.

dcGO is a comprehensive ontology database for protein domains. As an ontology resource, dcGO integrates Open Biomedical Ontologies from a variety of contexts, ranging from functional information like Gene Ontology to others on enzymes and pathways, from phenotype information across major model organisms to information about human diseases and drugs. As a protein domain resource, dcGO includes annotations to both the individual domains and supra-domains.

PomBase is a model organism database that provides online access to the fission yeast Schizosaccharomyces pombe genome sequence and annotated features, together with a wide range of manually curated functional gene-specific data. The PomBase website was redeveloped in 2016 to provide users with a more fully integrated, better-performing service.

Model organism databases (MODs) are biological databases, or knowledgebases, dedicated to the provision of in-depth biological data for intensively studied model organisms. MODs allow researchers to easily find background information on large sets of genes, plan experiments efficiently, combine their data with existing knowledge, and construct novel hypotheses. They allow users to analyse results and interpret datasets, and the data they generate are increasingly used to describe less well studied species. Where possible, MODs share common approaches to collect and represent biological information. For example, all MODs use the Gene Ontology (GO) to describe functions, processes and cellular locations of specific gene products. Projects also exist to enable software sharing for curation, visualization and querying between different MODs. Organismal diversity and varying user requirements however mean that MODs are often required to customize capture, display, and provision of data.

References

  1. 1 2 3 Thomas, PD.; Kejariwal, A.; Campbell, MJ.; Mi, H.; Diemer, K.; Guo, N.; Ladunga, I.; Ulitsky-Lazareva, B.; et al. (Jan 2003). "PANTHER: a browsable database of gene products organized by biological function, using curated protein family and subfamily classification". Nucleic Acids Res. 31 (1): 334–41. doi:10.1093/nar/gkg115. PMC   165562 . PMID   12520017.
  2. 1 2 "GO Reference Genome Annotation Project".
  3. 1 2 3 4 5 6 7 8 Mi, H.; Muruganujan, A.; Thomas, PD. (Jan 2013). "PANTHER in 2013: modeling the evolution of gene function, and other gene attributes, in the context of phylogenetic trees". Nucleic Acids Res. 41 (Database issue): D377–86. doi:10.1093/nar/gks1118. PMC   3531194 . PMID   23193289.
  4. 1 2 Hunter, S.; Jones, P.; Mitchell, A.; Apweiler, R.; Attwood, TK.; Bateman, A.; Bernard, T.; Binns, D.; et al. (Jan 2012). "InterPro in 2011: new developments in the family and domain prediction database". Nucleic Acids Res. 40 (Database issue): D306–12. doi:10.1093/nar/gkr948. PMC   3245097 . PMID   22096229.
  5. Mi, H.; Muruganujan, A.; Thomas, PD. (Aug 2013). "Large-scale gene function analysis with the PANTHER classification system". Nucleic Acids Res. 8 (8): 1551–66. doi:10.1038/nprot.2013.092. PMC   6519453 . PMID   23868073.
  6. 1 2 3 "PANTHERdb".
  7. Mi, H; Huang, X; Muruganujan, A; Tang, H; Mills, C; Kang, D; Thomas, PD (29 November 2016). "PANTHER version 11: expanded annotation data from Gene Ontology and Reactome pathways, and data analysis tool enhancements". Nucleic Acids Research. 45 (D1): D183–D189. doi:10.1093/nar/gkw1138. PMC   5210595 . PMID   27899595.
  8. The UniProt Consortium (Jan 2012). "Reorganizing the protein space at the Universal Protein Resource (UniProt)". Nucleic Acids Res. 40 (D1): D71–D75. doi:10.1093/nar/gkr981. PMC   3245120 . PMID   22102590.
  9. Gaudet, P.; Livstone, M.S.; Lewis, S.E.; Thomas, P.D. (Sep 2011). "Phylogenetic-based propagation of functional annotations within the Gene Ontology consortium". Brief Bioinform. 12 (5): 449–62. doi:10.1093/bib/bbr042. PMC   3178059 . PMID   21873635.
  10. Gene Ontology Consortium (Jan 2012). "The Gene Ontology: enhancements for 2011". Nucleic Acids Res. 40 (D1): D559–D564. doi:10.1093/nar/gkr1028. PMC   3245151 . PMID   22102568.
  11. Wu, C.H.; Apweiler, R.; Bairoch, A.; Natale, D.A.; Barker, W.C.; Boeckmann, B.; Ferro, S.; Gasteiger, E.; et al. (Jan 2006). "The Universal Protein Resource (UniProt): an expanding universe of protein information". Nucleic Acids Res. 34 (Database issue): D187–D191. doi:10.1093/nar/gkj161. PMC   1347523 . PMID   16381842.
  12. Mi, H.; Guo, N.; Thomas, P.D. (Jan 2007). "PANTHER version 6: protein sequence and function evolution data with expanded representation of biological pathways". Nucleic Acids Res. 35 (Database issue): D247–D252. doi:10.1093/nar/gkl869. PMC   1716723 . PMID   17130144.
  13. Flicek, P.; Amode, M.R.; Barrell, D.; Beal, K.; Brent, S.; Chen, Y.; Clapham, P.; Coates, G.; et al. (Jan 2011). "Ensembl". Nucleic Acids Res. 39 (Database issue): D800–D806. doi:10.1093/nar/gkq1064. PMC   3013672 . PMID   21045057.
  14. Maglott, D.; Ostell, J.; Pruitt, K.D.; Tatusova, T. (Jan 2011). "Entrez Gene: gene-centered information at NCBI". Nucleic Acids Res. 39 (Database issue): D52–D57. doi:10.1093/nar/gkq1237. PMC   3013746 . PMID   21115458.
  15. Mi, H.; Dong, Q.; Muruganujan, A.; Gaudet, P.; Lewis, S.; Thomas, P.D. (Jan 2010). "PANTHER version 7: improved phylogenetic trees, orthologs and collaboration with the Gene Ontology Consortium". Nucleic Acids Res. 38 (Database issue): D204–D210. doi:10.1093/nar/gkp1019. PMC   2808919 . PMID   20015972.
  16. "reference proteome".
  17. Details in PANTHER 9 statistics can be found here (http://www.pantherdb.org/panther/summaryStats.jsp)