Quantitative precipitation forecast

Last updated
Example of a five-day rainfall forecast from the Hydrometeorological Prediction Center Rita5dayqpf.png
Example of a five-day rainfall forecast from the Hydrometeorological Prediction Center

The quantitative precipitation forecast (abbreviated QPF) is the expected amount of melted precipitation accumulated over a specified time period over a specified area. [1] A QPF will be created when precipitation amounts reaching a minimum threshold are expected during the forecast's valid period. Valid periods of precipitation forecasts are normally synoptic hours such as 00:00, 06:00, 12:00 and 18:00  GMT. Terrain is considered in QPFs by use of topography or based upon climatological precipitation patterns from observations with fine detail. Starting in the mid-to-late 1990s, QPFs were used within hydrologic forecast models to simulate impact to rivers throughout the United States. Forecast models show significant sensitivity to humidity levels within the planetary boundary layer, or in the lowest levels of the atmosphere, which decreases with height. [2] QPF can be generated on a quantitative, forecasting amounts, or a qualitative, forecasting the probability of a specific amount, basis. [3] Radar imagery forecasting techniques show higher skill than model forecasts within 6 to 7 hours of the time of the radar image. The forecasts can be verified through use of rain gauge measurements, weather radar estimates, or a combination of both. Various skill scores can be determined to measure the value of the rainfall forecast.

Contents

Use of radar

Algorithms exist to forecast rainfall based on short term radar trends, within a matter of hours. Radar imagery forecasting techniques show higher skill than model forecasts within 6 to 7 hours of the time of the radar image. [4]

Use of forecast models

In the past, the forecaster was responsible for generating the entire weather forecast based upon available observations. [5] Today, meteorologists' input is generally confined to choosing a model based on various parameters, such as model biases and performance. [6] Using a consensus of forecast models, as well as ensemble members of the various models, can help reduce forecast error. [7] However, regardless how small the average error becomes with any individual system, large errors within any particularly piece of guidance are still possible on any given model run. [8] Professionals are required to interpret the model data into weather forecasts that are understandable to the lay person. Professionals can use knowledge of local effects which may be too small in size to be resolved by the model to add information to the forecast. As an example, terrain is considered in the QPF process by using topography or climatological precipitation patterns from observations with fine detail. [9] Using model guidance and comparing the various forecast fields to climatology, extreme events such as excessive precipitation associated with later flood events lead to better forecasts. [10] While increasing accuracy of forecast models implies that humans may no longer be needed in the forecast process at some point in the future, there is currently still a need for human intervention. [11]

Nowcasting

The forecasting of the precipitation within the next six hours is often referred to as nowcasting. [12] In this time range it is possible to forecast smaller features such as individual showers and thunderstorms with reasonable accuracy, as well as other features too small to be resolved by a computer model. A human given the latest radar, satellite and observational data will be able to make a better analysis of the small scale features present and so will be able to make a more accurate forecast for the following few hours. [13] However, there are now expert systems using those data and mesoscale numerical model to make better extrapolation, including evolution of those features in time.

Ensemble forecasting

The detail that can be given in a forecast increases with time as errors decrease. There comes a point when the errors are so large that the forecast has no correlation with the actual state of the atmosphere. Looking at a single forecast model does not indicate how likely that forecast is to be correct. Ensemble forecasting entails the production of many forecasts to reflect the uncertainty in the initial state of the atmosphere (due to errors in the observations and insufficient sampling). The range of different forecasts produced can then assess the uncertainty in the forecast. Ensemble forecasts are increasingly being used for operational weather forecasting (for example at European Centre for Medium-Range Weather Forecasts (ECMWF), National Centers for Environmental Prediction (NCEP), and the Canadian Forecasting Center). [6] Ensemble mean forecasts for precipitation have the same problems associated with their use in other fields, as they average out more extreme values, and therefore have limited usefulness for extreme events. In the case of the SREF ensemble mean, used within the United States, this decreasing usefulness starts with values as low as 0.50 inches (13 mm). [14]

Probability approach

Table showing probabilities of certain rainfall amounts in various blocks of time Osage pqpf.jpg
Table showing probabilities of certain rainfall amounts in various blocks of time

In addition to graphical rainfall forecasts showing quantitative amounts, rainfall forecasts can be made describing the probabilities of certain rainfall amounts being met. This allows the forecaster to assign the degree of uncertainty to the forecast. This technique is considered to be informative, relative to climatology. [15] This method has been used for years within National Weather Service forecasts, as a period's chance of rain equals the chance that 0.01 inches (0.25 mm) will fall in any particular spot. [16] In this case, it is known as probability of precipitation. These probabilities can be derived from a deterministic forecast using computer post-processing. [17]

Entities which generate rainfall forecasts

Australia

The Bureau of Meteorology began a method of forecasting rainfall using a combination, or ensemble, of different forecast models in 2006. It is termed The Poor Man's Ensemble (PME). Its forecasts are more accurate over time than any of the individual models composing the ensemble. The PME is quick to produce, and is available through their Water and the Land page on their website. [18]

Hong Kong

The Hong Kong Observatory generates short term rainstorm warnings for systems which are expected to accumulate a certain amount of rainfall per hour over the next few hours. They use three levels of warning. The amber warning indicates that a rainfall intensity of 30 millimetres (1.2 in) per hour is expected. The red warning indicates rainfall amounts of 50 millimetres (2.0 in) per hour are anticipated. The black warning indicates that rainfall rates of 70 millimetres (2.8 in) are possible. [19]

United States

Within the United States, the Hydrometeorological Prediction Center, [20] River Forecast Centers, [1] and local forecast offices within the National Weather Service create precipitation forecasts for up to five days in the future, [21] forecasting amounts equal to or greater than 0.01 inches (0.25 mm). Starting in the mid-to-late 1990s, QPFs were used within hydrologic forecast models to simulate impact of rainfall on river stages. [22]

Verification

24 hours rain accumulation on the Val d'Irene radar in Eastern Canada. Notice the zones without data in the East and Southwest caused by radar beam blocking from mountains. (Source: Environment Canada) Radar-accumulations eng.png
24 hours rain accumulation on the Val d'Irène radar in Eastern Canada. Notice the zones without data in the East and Southwest caused by radar beam blocking from mountains. (Source: Environment Canada)

Rainfall forecasts can be verified a number of ways. Rain gauge observations can be gridded into areal averages, which are then compared to the grids for the forecast models. Weather radar estimates can be used outright, or corrected for rain gauge observations. [4]

Several statistical scores can be based on the observed and forecast fields. One, known as a bias, compares the size of the forecast field to the observed field, with the goal of a score of 1. The threat score involves the intersection of the forecast and observed sets, with a maximum possible verification score of 1. [23] The probability of detection, or POD, is found by dividing the overlap between the forecast and observed fields by the size of the observed field: the goal here is a score of 1. The critical success index, or CSI, divides the overlap between the forecast and observed fields by the combined size of the forecast and observed fields: the goal here is a score of 1. The false alarm rate, or FAR, divides the area of the forecast which does not overlap the observed field by the size of the forecasted area. The goal value in this measure is zero. [4]

With tropical cyclones which impact the United States, the GFS global forecast model performed best in regards to its rainfall forecasts over the last few years, outperforming the NAM and ECMWF forecast models. [21]

See also

Related Research Articles

<span class="mw-page-title-main">Surface weather analysis</span> Type of weather map

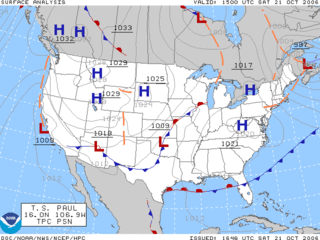
Surface weather analysis is a special type of weather map that provides a view of weather elements over a geographical area at a specified time based on information from ground-based weather stations.

<span class="mw-page-title-main">Weather forecasting</span> Science and technology application

Weather forecasting is the application of science and technology to predict the conditions of the atmosphere for a given location and time. People have attempted to predict the weather informally for millennia and formally since the 19th century.

<span class="mw-page-title-main">Precipitation</span> Product of the condensation of atmospheric water vapor that falls under gravity

In meteorology, precipitation is any product of the condensation of atmospheric water vapor that falls from clouds due to gravitational pull. The main forms of precipitation include drizzle, rain, sleet, snow, ice pellets, graupel and hail. Precipitation occurs when a portion of the atmosphere becomes saturated with water vapor, so that the water condenses and "precipitates" or falls. Thus, fog and mist are not precipitation but colloids, because the water vapor does not condense sufficiently to precipitate. Two processes, possibly acting together, can lead to air becoming saturated: cooling the air or adding water vapor to the air. Precipitation forms as smaller droplets coalesce via collision with other rain drops or ice crystals within a cloud. Short, intense periods of rain in scattered locations are called showers.

<span class="mw-page-title-main">National Weather Service</span> U.S. forecasting agency of the National Oceanic and Atmospheric Administration

The National Weather Service (NWS) is an agency of the United States federal government that is tasked with providing weather forecasts, warnings of hazardous weather, and other weather-related products to organizations and the public for the purposes of protection, safety, and general information. It is a part of the National Oceanic and Atmospheric Administration (NOAA) branch of the Department of Commerce, and is headquartered in Silver Spring, Maryland, within the Washington metropolitan area. The agency was known as the United States Weather Bureau from 1890 until it adopted its current name in 1970.

<span class="mw-page-title-main">Weather map</span> Table of weather elements

A weather map, also known as synoptic weather chart, displays various meteorological features across a particular area at a particular point in time and has various symbols which all have specific meanings. Such maps have been in use since the mid-19th century and are used for research and weather forecasting purposes. Maps using isotherms show temperature gradients, which can help locate weather fronts. Isotach maps, analyzing lines of equal wind speed, on a constant pressure surface of 300 or 250 hPa show where the jet stream is located. Use of constant pressure charts at the 700 and 500 hPa level can indicate tropical cyclone motion. Two-dimensional streamlines based on wind speeds at various levels show areas of convergence and divergence in the wind field, which are helpful in determining the location of features within the wind pattern. A popular type of surface weather map is the surface weather analysis, which plots isobars to depict areas of high pressure and low pressure. Cloud codes are translated into symbols and plotted on these maps along with other meteorological data that are included in synoptic reports sent by professionally trained observers.

<span class="mw-page-title-main">Weather Prediction Center</span> United States weather agency

The Weather Prediction Center (WPC), located in College Park, Maryland, is one of nine service centers under the umbrella of the National Centers for Environmental Prediction (NCEP), a part of the National Weather Service (NWS), which in turn is part of the National Oceanic and Atmospheric Administration (NOAA) of the U.S. Government. Until March 5, 2013 the Weather Prediction Center was known as the Hydrometeorological Prediction Center (HPC). The Weather Prediction Center serves as a center for quantitative precipitation forecasting, medium range forecasting, and the interpretation of numerical weather prediction computer models.

<span class="mw-page-title-main">Numerical weather prediction</span> Weather prediction using mathematical models of the atmosphere and oceans

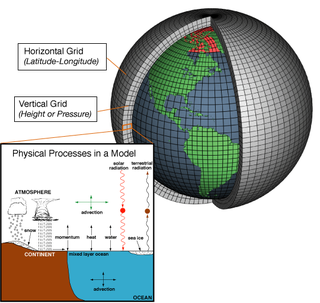
Numerical weather prediction (NWP) uses mathematical models of the atmosphere and oceans to predict the weather based on current weather conditions. Though first attempted in the 1920s, it was not until the advent of computer simulation in the 1950s that numerical weather predictions produced realistic results. A number of global and regional forecast models are run in different countries worldwide, using current weather observations relayed from radiosondes, weather satellites and other observing systems as inputs.

The National Severe Storms Laboratory (NSSL) is a National Oceanic and Atmospheric Administration (NOAA) weather research laboratory under the Office of Oceanic and Atmospheric Research. It is one of seven NOAA Research Laboratories (RLs).

<span class="mw-page-title-main">Ensemble forecasting</span> Multiple simulation method for weather forecasting

Ensemble forecasting is a method used in or within numerical weather prediction. Instead of making a single forecast of the most likely weather, a set of forecasts is produced. This set of forecasts aims to give an indication of the range of possible future states of the atmosphere. Ensemble forecasting is a form of Monte Carlo analysis. The multiple simulations are conducted to account for the two usual sources of uncertainty in forecast models: (1) the errors introduced by the use of imperfect initial conditions, amplified by the chaotic nature of the evolution equations of the atmosphere, which is often referred to as sensitive dependence on initial conditions; and (2) errors introduced because of imperfections in the model formulation, such as the approximate mathematical methods to solve the equations. Ideally, the verified future atmospheric state should fall within the predicted ensemble spread, and the amount of spread should be related to the uncertainty (error) of the forecast. In general, this approach can be used to make probabilistic forecasts of any dynamical system, and not just for weather prediction.

<span class="mw-page-title-main">Tropical cyclone forecast model</span> Computer program that uses meteorological data to forecast tropical cyclones

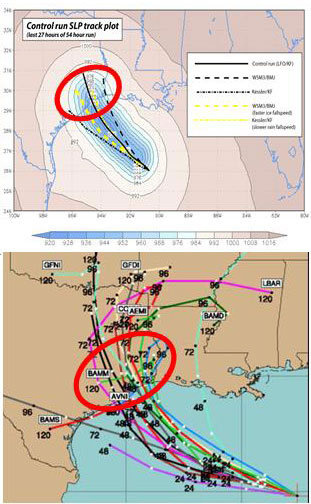
A tropical cyclone forecast model is a computer program that uses meteorological data to forecast aspects of the future state of tropical cyclones. There are three types of models: statistical, dynamical, or combined statistical-dynamic. Dynamical models utilize powerful supercomputers with sophisticated mathematical modeling software and meteorological data to calculate future weather conditions. Statistical models forecast the evolution of a tropical cyclone in a simpler manner, by extrapolating from historical datasets, and thus can be run quickly on platforms such as personal computers. Statistical-dynamical models use aspects of both types of forecasting. Four primary types of forecasts exist for tropical cyclones: track, intensity, storm surge, and rainfall. Dynamical models were not developed until the 1970s and the 1980s, with earlier efforts focused on the storm surge problem.

<span class="mw-page-title-main">Hydrometeorology</span> Branch of meteorology and hydrology

Hydrometeorology is a branch of meteorology and hydrology that studies the transfer of water and energy between the land surface and the lower atmosphere for academic research, commercial gain or operational forecasting purposes.

<span class="mw-page-title-main">Tropical cyclone rainfall forecasting</span>

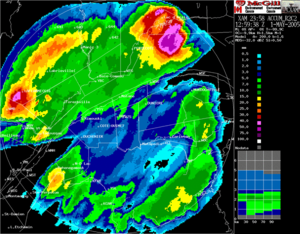
Tropical cyclone rainfall forecasting involves using scientific models and other tools to predict the precipitation expected in tropical cyclones such as hurricanes and typhoons. Knowledge of tropical cyclone rainfall climatology is helpful in the determination of a tropical cyclone rainfall forecast. More rainfall falls in advance of the center of the cyclone than in its wake. The heaviest rainfall falls within its central dense overcast and eyewall. Slow moving tropical cyclones, like Hurricane Danny and Hurricane Wilma, can lead to the highest rainfall amounts due to prolonged heavy rains over a specific location. However, vertical wind shear leads to decreased rainfall amounts, as rainfall is favored downshear and slightly left of the center and the upshear side is left devoid of rainfall. The presence of hills or mountains near the coast, as is the case across much of Mexico, Haiti, the Dominican Republic, much of Central America, Madagascar, Réunion, China, and Japan act to magnify amounts on their windward side due to forced ascent causing heavy rainfall in the mountains. A strong system moving through the mid latitudes, such as a cold front, can lead to high amounts from tropical systems, occurring well in advance of its center. Movement of a tropical cyclone over cool water will also limit its rainfall potential. A combination of factors can lead to exceptionally high rainfall amounts, as was seen during Hurricane Mitch in Central America.

<span class="mw-page-title-main">United States tropical cyclone rainfall climatology</span>

The United States tropical cyclone rainfall climatology concerns the amount of precipitation, primarily in the form of rain, which occurs during tropical cyclones and their extratropical cyclone remnants across the United States. Typically, five tropical cyclones and their remnants impact the country each year, contributing between a tenth and a quarter of the annual rainfall across the southern tier of the country. The highest rainfall amounts appear close to the coast, with lesser amounts falling farther inland. Obstructions to the precipitation pattern, such as the Appalachian mountains, focus higher amounts from northern Georgia through New England. While most impacts occur with systems moving in from the Atlantic Ocean or Gulf of Mexico, some emanate from the eastern Pacific Ocean, with a few crossing Mexico before impacting the Southwest. Those making landfall within the Southeast portion of the country tend to have the greatest potential for heavy rains.

<span class="mw-page-title-main">Tropical cyclone track forecasting</span> Predicting where a tropical cyclone is going to track over the next five days, every 6 to 12 hours

Tropical cyclone track forecasting involves predicting where a tropical cyclone is going to track over the next five days, every 6 to 12 hours. The history of tropical cyclone track forecasting has evolved from a single-station approach to a comprehensive approach which uses a variety of meteorological tools and methods to make predictions. The weather of a particular location can show signs of the approaching tropical cyclone, such as increasing swell, increasing cloudiness, falling barometric pressure, increasing tides, squalls and heavy rainfall.

The history of surface weather analysis concerns the timetable of developments related to surface weather analysis. Initially a tool of study for the behavior of storms, surface weather analyses became a work in progress to explain current weather and as an aid for short term weather forecasting. Initial efforts to create surface weather analyses began in the mid-19th century by using surface weather observations to analyze isobars, isotherms, and display temperature and cloud cover. By the mid-20th century, much more information was being placed upon the station models plotted on weather maps and surface fronts, per the Norwegian cyclone model, were being analyzed worldwide. Eventually, observation plotting went from a manual exercise to an automated task for computers and plotters. Surface analysis remains a manual and partially subjective exercise, whether it be via hand and paper, or via a workstation.

<span class="mw-page-title-main">Rain</span> Precipitation in the form of water droplets

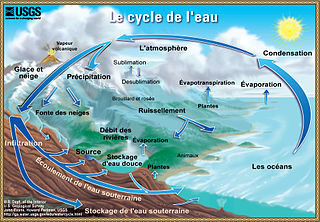
Rain is water droplets that have condensed from atmospheric water vapor and then fall under gravity. Rain is a major component of the water cycle and is responsible for depositing most of the fresh water on the Earth. It provides water for hydroelectric power plants, crop irrigation, and suitable conditions for many types of ecosystems.

<span class="mw-page-title-main">Ocean Prediction Center</span> One of the National Centers for Environmental Predictions service centers

The Ocean Prediction Center (OPC), established in 1995, is one of the National Centers for Environmental Prediction's (NCEP's) original six service centers. Until 2003, the name of the organization was the Marine Prediction Center. Its origins are traced back to the sinking of the RMS Titanic in 1912. The OPC issues forecasts up to five days in advance for ocean areas north of 31° north latitude and west of 35° west longitude in the Atlantic, and across the northeast Pacific north of 30° north latitude and east of 160° east longitude. Until recently, the OPC provided forecast points for tropical cyclones north of 20° north latitude and east of the 60° west longitude to the National Hurricane Center. OPC is composed of two branches: the Ocean Forecast Branch and the Ocean Applications Branch.

<span class="mw-page-title-main">Nowcasting (meteorology)</span>

Nowcasting is weather forecasting on a very short term mesoscale period of up to 2 hours, according to the World Meteorological Organization, and up to six hours, according to other authors in the field. This forecast is an extrapolation in time of known weather parameters, including those obtained by means of remote sensing, using techniques that take into account a possible evolution of the air mass. This type of forecast therefore includes details that cannot be solved by numerical weather prediction (NWP) models running over longer forecast periods.

The flash flood guidance system (FFGS) was designed and developed by the Hydrologic Research Center, a non-profit public-benefit corporation located in San Diego, CA, US, for use by meteorological and hydrologic forecasters throughout the world. The primary purpose of the FFGS is to provide operational forecasters and disaster management agencies with real-time information pertaining to the threat of small-scale flash flooding throughout a specified region.

3D nowcasting refers to an experimental technology of nowcasting in meteorology that uses a rapid phased-array radar to predict precipitation several minutes in advance. The phased-array radar takes a scan of the sky in anywhere from 10–30 seconds, viewing 100 vertical levels in a range of 60 km. thus providing inputs every 30 seconds. It divides the sky into several "layers" and uses a new algorithm for forecasting very quickly. The models use the K computer, requiring a large amount of observational data, and a large amount of computational power. The radar produces 100 times more data than the conventional parabolic antenna radar.

References

  1. 1 2 Bushong, Jack S (2005). "Quantitative Precipitation Forecast: Its Generation and Verification at the Southeast River Forecast Center" (PDF). Georgia Institute of Technology. Archived from the original (PDF) on 2009-02-05. Retrieved 2008-12-31.
  2. Christian Keil, Andreas Röpnack, George C. Craig, and Ulrich Schumann (2008). Sensitivity of quantitative precipitation forecast to height dependent changes in humidity Archived 2011-06-06 at the Wayback Machine . Geophysical Research Letters. Retrieved on 2008-12-31.
  3. P. Reggiani and A. H. Weerts (2008). Probabilistic Quantitative Precipitation Forecast for Flood Prediction: An Application. Journal of Hydrometeorology, February 2008, pp. 76–95. Retrieved on 2008-12-31.
  4. 1 2 3 Charles Lin (2005). Quantitative Precipitation Forecast (QPF) from Weather Prediction Models and Radar Nowcasts, and Atmospheric Hydrological Modelling for Flood Simulation. Archived 2009-02-05 at the Wayback Machine ACTIF. Retrieved on 2009-01-01.
  5. Goddard Space Flight Center (2007). Weather Forecasting Through the Ages via Internet Archive Wayback Machine. NASA. Retrieved on 2008-05-25.
  6. 1 2 Klaus Weickmann, Jeff Whitaker, Andres Roubicek and Catherine Smith (2008). The Use of Ensemble Forecasts to Produce Improved Medium Range (3-15 days) Weather Forecasts. Earth Systems Research Laboratory. Retrieved on 2007-02-16.
  7. Todd Kimberlain (2007). Tropical cyclone motion and intensity talk. Hydrometeorological Prediction Center. Retrieved on 2007-07-21.
  8. Robbie Berg (2009). Tropical Cyclone Report: Hurricane Ike. National Hurricane Center. Retrieved on 2009-02-08.
  9. Daniel Weygand (2008). Optimizing Output From QPF Helper. Archived February 5, 2009, at the Wayback Machine National Weather Service Western Region Headquarters. Retrieved on 2008-12-31.
  10. Neil A. Stuart, Richard H. Grumm, John Cannon, and Walt Drag (2007). The Use Of Eensemble and Anomaly Data to Anticipate Extreme Flood Events in the Northeastern U.S. Archived October 7, 2008, at the Wayback Machine National Weather Service Eastern Region Headquarters. Retrieved on 2009-01-01.
  11. Roebber P. J. and Bosart L. F. (1996) The complex relationship between forecast skill and forecast value : A real-world analysis. Weather and forecasting, pp. 554-559. Retrieved on 2008-05-25.
  12. Glossary of Meteorology. Retrieved on 2015-05-26.
  13. E-notes.com. Weather and Climate | What Is Nowcasting? Archived 2011-09-05 at the Wayback Machine Retrieved on 2011-09-08.
  14. Environmental Modeling Center (2008). SREF Precipitation Verification. National Centers for Environmental Prediction. Retrieved on 2008-12-31.
  15. American Geophysical Union (1995). Probabilistic QPF for River Basins. Retrieved on 2009-01-01.
  16. National Weather Service (2007). Is It Going to Rain Today? Understanding The Weather Forecast. University of Texas. Retrieved on 2009-01-01.
  17. Steve Amburn (2008). Probabilistic QPF Detailed Definition. Archived October 14, 2008, at the Wayback Machine National Weather Service Office, Tulsa, Oklahoma. Retrieved on 2009-01-01.
  18. Executive and International Affairs Branch (2007). Meteorological and Related Research. Bureau of Meteorology. Retrieved on 2009-02-08.
  19. Edwin S.T. Lai & Ping Cheung (2001). Short-range rainfall forecast in Hong Kong. Hong Kong Observatory. Retrieved on 2009-02-08.
  20. J. Im, Ed Danaher, Keith Brill (2004). Development of Quantitative Precipitation Forecast (QPF) Confidence Factor Using Short Range Ensemble Forecasts. American Geophysical Union. Retrieved on 2008-12-31.
  21. 1 2 Michael J. Brennan, Jessica L. Clark, and Mark Klein (2008). Verification of Quantitative Precipitation Forecast Guidance From NWP Models and the Hydrometeorological Prediction Center For 2005–2007 Tropical Cyclones With Continental U.S. Rainfall Impacts. American Meteorological Society. Retrieved on 2008-12-31.
  22. Noreen O. Schwein (2009). Optimization of quantitative precipitation forecast time horizons used in river forecasts. Archived 2011-06-09 at the Wayback Machine 23rd Conference on Hydrology. Retrieved on 2008-12-31.
  23. Michael J. Brennan, Jessica L. Clark, and Mark Klein. VERIFICATION OF QUANTITATIVE PRECIPITATION FORECAST GUIDANCE FROM NWP MODELS AND THE HYDROMETEOROLOGICAL PREDICTION CENTER FOR 2005–2007 TROPICAL CYCLONES WITH CONTINENTAL U.S. RAINFALL IMPACTS. Retrieved on 2008-12-31.