Reference atmospheric model

Last updated

A reference atmospheric model describes how the ideal gas properties (namely: pressure, temperature, density, and molecular weight) of an atmosphere change, primarily as a function of altitude, and sometimes also as a function of latitude, day of year, etc. A static atmospheric model has a more limited domain, excluding time. A standard atmosphere is defined by the World Meteorological Organization as "a hypothetical vertical distribution of atmospheric temperature, pressure and density which, by international agreement, is roughly representative of year-round, midlatitude conditions."

Contents

Typical usages are as a basis for pressure altimeter calibrations, aircraft performance calculations, aircraft and rocket design, ballistic tables, and meteorological diagrams." [1]

For example, the U.S. Standard Atmosphere derives the values for air temperature, pressure, and mass density, as a function of altitude above sea level.

Other static atmospheric models may have other outputs, or depend on inputs besides altitude.

Basic assumptions

The gas which comprises an atmosphere is usually assumed to be an ideal gas, which is to say:

Where ρ is mass density, M is average molecular weight, P is pressure, T is temperature, and R is the ideal gas constant.

The gas is held in place by so-called "hydrostatic" forces. That is to say, for a particular layer of gas at some altitude: the downward (towards the planet) force of its weight, the downward force exerted by pressure in the layer above it, and the upward force exerted by pressure in the layer below, all sum to zero. Mathematically this is:

Finally, these variables describing the system do not change with time; i.e. it is a static system.

g_0, gravitational acceleration is used here as a constant, with same value as standard gravity (average acceleration due to gravity on the surface of the Earth or other big body). For the basis of simplicity it doesn't vary with latitude, altitude or location. The variation due to all these factors is about 1% up to 50km. More complex models, account for this variations.

Some examples

Depending on the model, some gas properties may be treated as constant with respect to altitude.

Ocean example

If the density of a gas is persistent, then it isn't really behaving like a gas. Instead it is behaving like an incompressible fluid, or liquid, and this situation looks more like an ocean. Assuming density is constant, then a graph of pressure vs altitude will have a retained slope, since the weight of the ocean over head is directly proportional to its depth.

Liquid ocean atmosphere model.png

Isothermal-barotropic approximation and scale height

This atmospheric model assumes both molecular weight and temperature are constant over a wide range of altitude. Such a model may be called isothermal (constant temperature). Inserting constant molecular weight and constant temperature into the equation for the ideal gas law produces the result that density and pressure, the two remaining variables, depend only on each other. For this reason, this model may also be called barotropic (density depends only on pressure).

For the isothermal-barotropic model, density and pressure turn out to be exponential functions of altitude. The increase in altitude necessary for P or ρ to drop to 1/e of its initial value is called the scale height:

where R is the ideal gas constant, T is temperature, M is average molecular weight, and g0 is the gravitational acceleration at the planet's surface. Using the values T=273 K and M=29 g/mol as characteristic of the Earth's atmosphere, H = RT/Mg = (8.315*273)/(29*9.8) = 7.99, or about 8 km, which coincidentally is approximate height of Mt. Everest.

For an isothermal atmosphere, or about 63% of the total mass of the atmosphere exists between the planet's surface and one scale height. (The total air mass below a certain altitude is calculated by integrating over the density function.)

For the ocean example there was a sharp transition in density at the top or "surface" of the ocean. However, for atmospheres made of gas there is no equivalent sharp transition or edge. Gas atmospheres simply get less and less dense until they're so thin that they're space.

Isothermal-barotropic atmosphere model.png

The U.S. Standard Atmosphere

The U.S. Standard Atmosphere model starts with many of the same assumptions as the isothermal-barotropic model, including ideal gas behavior, and constant molecular weight, but it differs by defining a more realistic temperature function, consisting of eight data points connected by straight lines; i.e. regions of constant temperature gradient. (See graph.) Of course the real atmosphere does not have a temperature distribution with this exact shape. The temperature function is an approximation. Values for pressure and density are then calculated based on this temperature function, and the constant temperature gradients help to make some of the maths easier.

Us standard atmosphere model.png

NASA Global Reference Atmospheric Model

The NASA Earth Global Reference Atmospheric Model (Earth-GRAM) was developed by the Marshall Space Flight Center to provide a design reference atmosphere that, unlike the standard atmospheres, allows for geographical variability, a wide range of altitudes (surface to orbital altitudes), and different months and times of day. It can also simulate spatial and temporal perturbations in atmospheric parameters due to turbulence and other atmospheric perturbation phenomena. It is available [2] in computer code written in Fortran. [3] The GRAM series also includes atmospheric models for the planets Venus, Mars and Neptune and the Saturnian moon, Titan. [4]

Geopotential altitude

Gravitational acceleration, g(z), decreases with altitude since moving up means moving away from the planet's center.

This problem of decreasing g can be dealt with by defining a transformation from real geometric altitude z to an abstraction called "geopotential altitude" h, defined:

h has the property

where

Which basically says the amount of work done lifting a test mass m to height z through an atmosphere where gravity decreases with altitude, is the same as the amount of work done lifting that same mass to a height h through an atmosphere where g magically remains equal to g0, its value at sea level.

This geopotential altitude h is then used instead of geometric altitude z in the hydrostatic equations.

Common models

See also

Related Research Articles

<span class="mw-page-title-main">Mach number</span> Ratio of speed of an object moving through fluid and local speed of sound

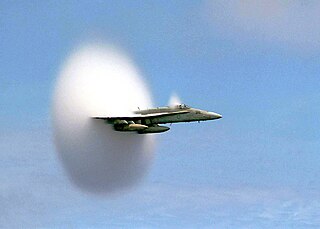
The Mach number, often only Mach, is a dimensionless quantity in fluid dynamics representing the ratio of flow velocity past a boundary to the local speed of sound. It is named after the Austrian physicist and philosopher Ernst Mach.

<span class="mw-page-title-main">Troposphere</span> Lowest layer of Earths atmosphere

The troposphere is the lowest layer of the atmosphere of Earth. It contains 75% of the total mass of the planetary atmosphere and 99% of the total mass of water vapor and aerosols, and is where most weather phenomena occur. From the planetary surface of the Earth, the average height of the troposphere is 18 km in the tropics; 17 km in the middle latitudes; and 6 km in the high latitudes of the polar regions in winter; thus the average height of the troposphere is 13 km.

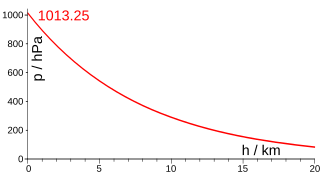
Atmospheric pressure, also known as air pressure or barometric pressure, is the pressure within the atmosphere of Earth. The standard atmosphere is a unit of pressure defined as 101,325 Pa (1,013.25 hPa), which is equivalent to 1,013.25 millibars, 760 mm Hg, 29.9212 inches Hg, or 14.696 psi. The atm unit is roughly equivalent to the mean sea-level atmospheric pressure on Earth; that is, the Earth's atmospheric pressure at sea level is approximately 1 atm.

<span class="mw-page-title-main">Hydrostatic equilibrium</span> State of balance between external forces on a fluid and internal pressure gradient

In fluid mechanics, hydrostatic equilibrium is the condition of a fluid or plastic solid at rest, which occurs when external forces, such as gravity, are balanced by a pressure-gradient force. In the planetary physics of Earth, the pressure-gradient force prevents gravity from collapsing the planetary atmosphere into a thin, dense shell, whereas gravity prevents the pressure-gradient force from diffusing the atmosphere into outer space.

<span class="mw-page-title-main">Speed of sound</span> Speed of sound wave through elastic medium

The speed of sound is the distance travelled per unit of time by a sound wave as it propagates through an elastic medium. At 20 °C (68 °F), the speed of sound in air is about 343 metres per second, or one kilometre in 2.91 s or one mile in 4.69 s. It depends strongly on temperature as well as the medium through which a sound wave is propagating. At 0 °C (32 °F), the speed of sound in air is about 331 m/s. More simply, the speed of sound is how fast vibrations travel.

Geopotential height or geopotential altitude is a vertical coordinate referenced to Earth's mean sea level that represents the work done by lifting one unit mass one unit distance through a region in which the acceleration of gravity is uniformly 9.80665 m/s2. Geopotential height (altitude) differs from geometric (tapeline) height but remains a historical convention in aeronautics as the altitude used for calibration of aircraft barometric altimeters.

<span class="mw-page-title-main">Compressibility</span> Measure of the relative volume change of a fluid or solid as a response to a pressure change

In thermodynamics and fluid mechanics, the compressibility is a measure of the instantaneous relative volume change of a fluid or solid as a response to a pressure change. In its simple form, the compressibility may be expressed as

<span class="mw-page-title-main">Lapse rate</span> Vertical rate of change of temperature in atmosphere

The lapse rate is the rate at which an atmospheric variable, normally temperature in Earth's atmosphere, falls with altitude. Lapse rate arises from the word lapse, in the sense of a gradual fall. In dry air, the adiabatic lapse rate is 9.8 °C/km. The saturated air lapse rate (SALR), or moist adiabatic lapse rate (MALR), is the decrease in temperature of a parcel of water-saturated air that rises in the atmosphere. It varies with the temperature and pressure of the parcel and is often in the range 3.6 to 9.2 °C/km, as obtained from the International Civil Aviation Organization (ICAO). The environmental lapse rate is the decrease in temperature of air with altitude for a specific time and place. It can be highly variable between circumstances.

The primitive equations are a set of nonlinear partial differential equations that are used to approximate global atmospheric flow and are used in most atmospheric models. They consist of three main sets of balance equations:

  1. A continuity equation: Representing the conservation of mass.
  2. Conservation of momentum: Consisting of a form of the Navier–Stokes equations that describe hydrodynamical flow on the surface of a sphere under the assumption that vertical motion is much smaller than horizontal motion (hydrostasis) and that the fluid layer depth is small compared to the radius of the sphere
  3. A thermal energy equation: Relating the overall temperature of the system to heat sources and sinks

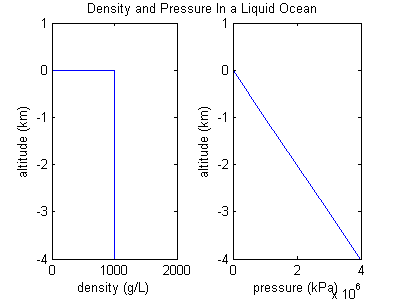
The density of air or atmospheric density, denoted ρ, is the mass per unit volume of Earth's atmosphere. Air density, like air pressure, decreases with increasing altitude. It also changes with variations in atmospheric pressure, temperature and humidity. At 101.325 kPa (abs) and 20 °C, air has a density of approximately 1.204 kg/m3 (0.0752 lb/cu ft), according to the International Standard Atmosphere (ISA). At 101.325 kPa (abs) and 15 °C (59 °F), air has a density of approximately 1.225 kg/m3 (0.0765 lb/cu ft), which is about 1800 that of water, according to the International Standard Atmosphere (ISA). Pure liquid water is 1,000 kg/m3 (62 lb/cu ft).

<span class="mw-page-title-main">International Standard Atmosphere</span> Atmospheric model

The International Standard Atmosphere (ISA) is a static atmospheric model of how the pressure, temperature, density, and viscosity of the Earth's atmosphere change over a wide range of altitudes or elevations. It has been established to provide a common reference for temperature and pressure and consists of tables of values at various altitudes, plus some formulas by which those values were derived. The International Organization for Standardization (ISO) publishes the ISA as an international standard, ISO 2533:1975. Other standards organizations, such as the International Civil Aviation Organization (ICAO) and the United States Government, publish extensions or subsets of the same atmospheric model under their own standards-making authority.

In astronomy, air mass or airmass is a measure of the amount of air along the line of sight when observing a star or other celestial source from below Earth's atmosphere. It is formulated as the integral of air density along the light ray.

The barometric formula is a formula used to model how the pressure of the air changes with altitude.

<span class="mw-page-title-main">Barotropic fluid</span> Fluid whose density is a function of pressure only

In fluid dynamics, a barotropic fluid is a fluid whose density is a function of pressure only. The barotropic fluid is a useful model of fluid behavior in a wide variety of scientific fields, from meteorology to astrophysics.

<span class="mw-page-title-main">Scale height</span>

In atmospheric, earth, and planetary sciences, a scale height, usually denoted by the capital letter H, is a distance over which a physical quantity decreases by a factor of e.

In atmospheric dynamics, oceanography, asteroseismology and geophysics, the Brunt–Väisälä frequency, or buoyancy frequency, is a measure of the stability of a fluid to vertical displacements such as those caused by convection. More precisely it is the frequency at which a vertically displaced parcel will oscillate within a statically stable environment. It is named after David Brunt and Vilho Väisälä. It can be used as a measure of atmospheric stratification.

<span class="mw-page-title-main">U.S. Standard Atmosphere</span> Static atmospheric model

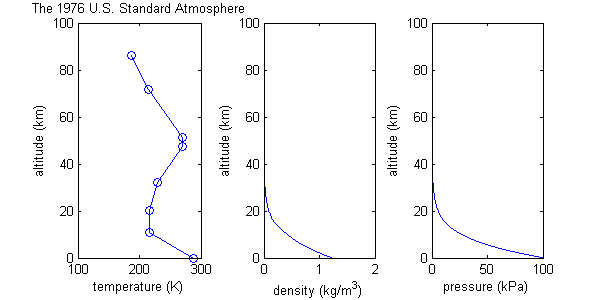
The U.S. Standard Atmosphere is a static atmospheric model of how the pressure, temperature, density, and viscosity of the Earth's atmosphere change over a wide range of altitudes or elevations. The model, based on an existing international standard, was first published in 1958 by the U.S. Committee on Extension to the Standard Atmosphere, and was updated in 1962, 1966, and 1976. It is largely consistent in methodology with the International Standard Atmosphere, differing mainly in the assumed temperature distribution at higher altitudes.

Atmospheric tides are global-scale periodic oscillations of the atmosphere. In many ways they are analogous to ocean tides. Atmospheric tides can be excited by:

Vertical pressure variation is the variation in pressure as a function of elevation. Depending on the fluid in question and the context being referred to, it may also vary significantly in dimensions perpendicular to elevation as well, and these variations have relevance in the context of pressure gradient force and its effects. However, the vertical variation is especially significant, as it results from the pull of gravity on the fluid; namely, for the same given fluid, a decrease in elevation within it corresponds to a taller column of fluid weighing down on that point.

<span class="mw-page-title-main">Emden–Chandrasekhar equation</span>

In astrophysics, the Emden–Chandrasekhar equation is a dimensionless form of the Poisson equation for the density distribution of a spherically symmetric isothermal gas sphere subjected to its own gravitational force, named after Robert Emden and Subrahmanyan Chandrasekhar. The equation was first introduced by Robert Emden in 1907. The equation reads

References

  1. National Oceanic and Atmospheric Administration; National Aeronautics and Space Administration; United States Air Force (October 1976), U. S. Standard Atmosphere, 1976 (PDF), Washington, D.C.: U. S. Government Printing Office, p. xiv
  2. "Earth Global Reference Atmospheric Model (Earth-Gram) 2010", Software Catalog 2015–2016, NASA – Technology Transfer Program, retrieved 16 August 2016
  3. Leslie, F.W.; Justus, C.G. (June 2011), The NASA Marshall Space Flight Center Earth Global Reference Atmospheric Model—2010 Version (PDF), NASA/TM—2011–216467, Marshall Space Flight Center, Alabama: National Aeronautics and Space Administration, retrieved 15 August 2016
  4. Justh, Hilary L.; Justus, C. G.; Keller, Vernon W. (2006), "Global Reference Atmospheric Models, Including Thermospheres, for Mars, Venus and Earth", AIAA/AAS Astrodynamics Specialists Conference; 21–24 Aug. 2006; Keystone, CO; United States, doi:10.2514/6.2006-6394, hdl: 2060/20060048492