
A planetarium is a theatre built primarily for presenting educational and entertaining shows about astronomy and the night sky, or for training in celestial navigation.

The geoid is the shape that the ocean surface would take under the influence of the gravity of Earth, including gravitational attraction and Earth's rotation, if other influences such as winds and tides were absent. This surface is extended through the continents. According to Gauss, who first described it, it is the "mathematical figure of the Earth", a smooth but irregular surface whose shape results from the uneven distribution of mass within and on the surface of Earth. It can be known only through extensive gravitational measurements and calculations. Despite being an important concept for almost 200 years in the history of geodesy and geophysics, it has been defined to high precision only since advances in satellite geodesy in the late 20th century.

The instrumental temperature record is a record of temperatures within Earth's climate based on direct measurement of air temperature and ocean temperature, using thermometers and other thermometry devices. Instrumental temperature records are distinguished from indirect reconstructions using climate proxy data such as from tree rings and ocean sediments. Instrument-based data are collected from thousands of meteorological stations, buoys and ships around the globe. Whilst many heavily-populated areas have a high density of measurements, observations are more widely spread in sparsely populated areas such as polar regions and deserts, as well as over many parts of Africa and South America. Measurements were historically made using mercury or alcohol thermometers which were read manually, but are increasingly made using electronic sensors which transmit data automatically. Records of global average surface temperature are usually presented as anomalies rather than as absolute temperatures. A temperature anomaly is measured against a reference value. For example, a commonly used baseline period is the time period 1951-1980.

The Goddard Space Flight Center (GSFC) is a major NASA space research laboratory located approximately 6.5 miles (10.5 km) northeast of Washington, D.C. in Greenbelt, Maryland, United States. Established on May 1, 1959 as NASA's first space flight center, GSFC employs about 10,000 civil servants and contractors. Named for American rocket propulsion pioneer Robert H. Goddard, it is one of ten major NASA field centers. GSFC is partially within the former Goddard census-designated place; it has a Greenbelt mailing address.
Stellarium is a free and open-source planetarium, licensed under the terms of the GNU General Public License version 2, available for Linux, Windows, and macOS. A port of Stellarium called Stellarium Mobile is available for Android, iOS, and Symbian as a paid version, being developed by Noctua Software. These have a limited functionality, lacking some features of the desktop version. All versions use OpenGL to render a realistic projection of the night sky in real time.

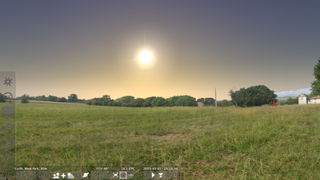
Xplanet is a renderer for planetary and Solar System images, capable of producing various types of graphics depicting the Solar System. It is normally used to create computer wallpapers, which may be updated with the latest cloud maps or the regions of Earth which are in sunlight. Xplanet is free software released under the GNU GPL.

Generic Mapping Tools (GMT) are an open-source collection of computer software tools for processing and displaying xy and xyz datasets, including rasterization, filtering and other image processing operations, and various kinds of map projections. The software stores 2-D grids as COARDS-compliant netCDF files and comes with a comprehensive collection of free GIS data, such as coast lines, rivers, political borders and coordinates of other geographic objects. Users convert further data from other sources and import them. GMT stores the resulting maps and diagrams in PostScript (PS) or Encapsulated PostScript (EPS) format.

The equirectangular projection, and which includes the special case of the plate carrée projection, is a simple map projection attributed to Marinus of Tyre, who Ptolemy claims invented the projection about AD 100.
Fulldome refers to immersive dome-based video display environments. The dome, horizontal or tilted, is filled with real-time (interactive) or pre-rendered (linear) computer animations, live capture images, or composited environments.
The Discovery Science Center and Planetarium is a hands-on science center in Bridgeport, Connecticut, that serves as both a tourist destination and an educational resource for area schools. The Discovery Science Center provides dynamic, hands-on STEM experiences designed to resonate with the innate curiosity, learning desire, and spirit of exploration of visitors, encouraging young learners to ask questions, solve problems, and engineer solutions today so they are better prepared to embrace the challenges of tomorrow.

The National Museum of Emerging Science and Innovation, simply known as the Miraikan, is a museum created by Japan's Science and Technology Agency.
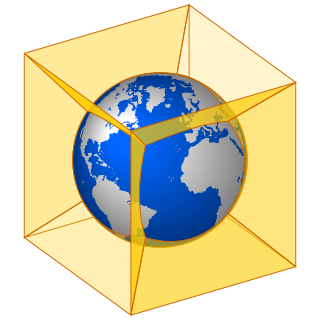
In mapmaking, a quadrilateralized spherical cube, or quad sphere for short, is an equal-area polyhedral map projection and discrete global grid scheme for data collected on a spherical surface. It was first proposed in 1975 by Chan and O'Neill for the Naval Environmental Prediction Research Facility. This scheme is also often called the COBE sky cube, because it was designed to hold data from the Cosmic Background Explorer (COBE) project.
Computational geophysics is the field of study that uses any type of numerical computations to generate and analyze models of complex geophysical systems. It can be considered an extension, or sub-field, of both computational physics and geophysics. In recent years, computational power, data availability, and modelling capabilities have all improved exponentially, making computational geophysics a more populated discipline. Due to the large computational size of many geophysical problems, high-performance computing can be required to handle analysis. Modeling applications of computational geophysics include atmospheric modelling, oceanic modelling, general circulation models, and geological modelling. In addition to modelling, some problems in remote sensing fall within the scope of computational geophysics such as tomography, inverse problems, and 3D reconstruction.
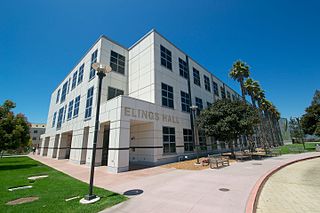
The AlloSphere is a research facility in a theatre-like pavilion in a spherical shape, of opaque material, used to project computer-generated imagery and sounds. Included are GIS, scientific, artistic, and other information. Located at the University of California, Santa Barbara (UCSB) the AlloSphere grew out of the schools of electrical engineering and computer science, and the Media Arts & Technology program at UCSB.
GIS Live DVD is a type of the thematic Live CD containing GIS/RS applications and related tutorials, and sample data sets. The general sense of a GIS Live DVD is to demonstrate the power of FLOSS GIS and encourage users to start on FLOSS GIS. However, a disc can be used for GIS data processing and training, too. A disc usually includes some selected Linux-based or Wine (software)-enabled Windows applications for GIS and Remote Sensing use. Using this disc the end users can execute GIS functions to get experience in free and open source software solutions or solve some simple business operations. The set-up and the operating behaviour of the applications can also be studied prior to building real FLOSS GIS-based systems. Recently a LiveDVD image is stored and booted from USB.

B. M. Birla Planetarium is a large planetarium in Chennai, India. The fifth B. M. Birla planetarium in the country, it is located at Kotturpuram in the Periyar Science and Technology Centre campus which houses eight galleries, namely, Physical Science, Electronics and Communication, Energy, Life Science, Innovation, Transport, International Dolls and Children and Materials Science, with over 500 exhibits. Built in 1988 in the memory of the great industrialist and visionary of India B. M. Birla, it is considered the most modern planetarium in India, providing a virtual tour of the night sky and holding cosmic shows on a specially perforated hemispherical aluminium inner dome. Other Birla planetariums in India include the M. P. Birla Planetarium in Kolkata, the Birla Planetarium in Hyderabad, and the planetariums in Tiruchirapalli and Coimbatore.

HEALPix, an acronym for Hierarchical Equal Area isoLatitude Pixelisation of a 2-sphere, is an algorithm for pixelisation of the 2-sphere based on subdivision of a distorted rhombic dodecahedron, and the associated class of map projections. The pixelisation algorithm was devised in 1997 by Krzysztof M. Górski at the Theoretical Astrophysics Center in Copenhagen, Denmark, and first published as a preprint in 1998.

Web Mercator, Google Web Mercator, Spherical Mercator, WGS 84 Web Mercator or WGS 84/Pseudo-Mercator is a variant of the Mercator map projection and is the de facto standard for Web mapping applications. It rose to prominence when Google Maps adopted it in 2005. It is used by virtually all major online map providers, including Google Maps, CARTO, Mapbox, Bing Maps, OpenStreetMap, Mapquest, Esri, and many others. Its official EPSG identifier is EPSG:3857, although others have been used historically.

The National Centers for Environmental Information (NCEI) is a U.S. government agency that manages one of the world’s largest archives of atmospheric, coastal, geophysical, and oceanic data. The current director is Derek Arndt.

Warming stripes are data visualization graphics that use a series of coloured stripes chronologically ordered to visually portray long-term temperature trends. Warming stripes reflect a "minimalist" style, conceived to use colour alone to avoid technical distractions to intuitively convey global warming trends to non-scientists.


