SigmaStat is a statistical software package, which was originally developed by Jandel Scientific Software in the 1980s. As of October 1996, Systat Software is now based in San Jose, California. SigmaStat can compare effects among groups, conduct survival analysis, analyze rates and proportions, perform regression and correlation analysis and calculate power and sample size. The program uses a wizard based interface which asks the user questions about the project and its data. After a test is run, the user receives a detailed report that interprets the results.
If installed with SigmaPlot, SigmaStat integrated with SigmaPlot and SigmaPlot gained advanced statistical analysis capabilities from version 11. SigmaStat is available both as a separate product or is available integrated with SigmaPlot.
On February 1, 2016 SigmaStat version 4 was relaunched as a separate Advisory Statistics Software by Systat Software Inc.
Version history
Version 1.0: 1994
Version 2.0: 1997
Version 3.0: 2003
Version 3.1: 2005
Version 3.5: 2007 (integrated with SigmaPlot 10)
Version 4.0: 2008 (integrated with SigmaPlot 11)
Version 4.00: Relaunched as SigmaStat version 4.00 on February 1, 2016.
SPSS Statistics is a statistical software suite developed by IBM for data management, advanced analytics, multivariate analysis, business intelligence, and criminal investigation. Long produced by SPSS Inc., it was acquired by IBM in 2009. Versions of the software released since 2015 have the brand name IBM SPSS Statistics.
R is a programming language for statistical computing and graphics supported by the R Core Team and the R Foundation for Statistical Computing. Created by statisticians Ross Ihaka and Robert Gentleman, R is used among data miners, bioinformaticians and statisticians for data analysis and developing statistical software. The core R language is augmented by a large number of extension packages containing reusable code and documentation.
SAS is a statistical software suite developed by SAS Institute for data management, advanced analytics, multivariate analysis, business intelligence, criminal investigation, and predictive analytics.
Stata is a general-purpose statistical software package developed by StataCorp for data manipulation, visualization, statistics, and automated reporting. It is used by researchers in many fields, including biomedicine, economics, epidemiology, and sociology.
JMP is a suite of computer programs for statistical analysis developed by JMP, a subsidiary of SAS Institute. It was launched in 1989 to take advantage of the graphical user interface introduced by the Macintosh operating systems. It has since been significantly rewritten and made available also for the Windows operating system. JMP is used in applications such as Six Sigma, quality control, and engineering, design of experiments, as well as for research in science, engineering, and social sciences.
Statistica is an advanced analytics software package originally developed by StatSoft and currently maintained by TIBCO Software Inc. Statistica provides data analysis, data management, statistics, data mining, machine learning, text analytics and data visualization procedures.
In statistics, kernel density estimation (KDE) is the application of kernel smoothing for probability density estimation, i.e., a non-parametric method to estimate the probability density function of a random variable based on kernels as weights. KDE answers a fundamental data smoothing problem where inferences about the population are made, based on a finite data sample. In some fields such as signal processing and econometrics it is also termed the Parzen–Rosenblatt window method, after Emanuel Parzen and Murray Rosenblatt, who are usually credited with independently creating it in its current form. One of the famous applications of kernel density estimation is in estimating the class-conditional marginal densities of data when using a naive Bayes classifier, which can improve its prediction accuracy.
A heat map is a 2-dimensional data visualization technique that represents the magnitude of individual values within a dataset as a color. The variation in color may be by hue or intensity.
Origin is a proprietary computer program for interactive scientific graphing and data analysis. It is produced by OriginLab Corporation, and runs on Microsoft Windows. It has inspired several platform-independent open-source clones and alternatives like LabPlot and SciDAVis.
SigmaScan Pro is an Image analysis package for scientists, engineers, and technicians that provides a method to measure distances across any object that can be photographed or scanned.
SigmaPlot is a proprietary software package for scientific graphing and data analysis. It runs on Microsoft Windows.
TableCurve 2D is a linear and non-linear Curve fitting software package for engineers and scientists that automates the curve fitting process and in a single processing step instantly fits and ranks 3,600+ built-in frequently encountered equations enabling users to easily find the ideal model to their 2D data within seconds.
TableCurve 3D is a linear and non-linear surface fitting software package for engineers and scientists that automates the surface fitting process and in a single processing step, fits and ranks about 36,000 out of over 450 million built-in frequently encountered equations, enabling users to find the ideal model to their 3D data.
PeakFit is an automated nonlinear peak separation and analysis software package for scientists performing spectroscopy, chromatography and electrophoresis.
Psychometric software is software that is used for psychometric analysis of data from tests, questionnaires, or inventories reflecting latent psychoeducational variables. While some psychometric analyses can be performed with standard statistical software like SPSS, most analyses require specialized tools.
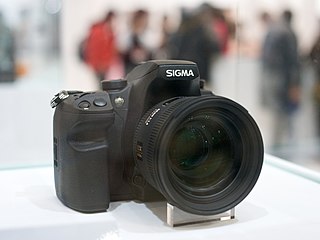
The Sigma SD1 is a digital SLR camera produced by the Sigma Corporation of Japan. The camera uses a Foveon X3 sensor, which comprises 3 layers of 4800 x 3200 pixels, giving much higher chromatic resolution than the equivalent Bayer array. It uses a Milbeaut image processor. The Foveon sensor does not use an aliasing filter, thus further improving the resolution.
ggplot2 is an open-source data visualization package for the statistical programming language R. Created by Hadley Wickham in 2005, ggplot2 is an implementation of Leland Wilkinson's Grammar of Graphics—a general scheme for data visualization which breaks up graphs into semantic components such as scales and layers. ggplot2 can serve as a replacement for the base graphics in R and contains a number of defaults for web and print display of common scales. Since 2005, ggplot2 has grown in use to become one of the most popular R packages.
Design–Expert is a statistical software package from Stat-Ease Inc. that is specifically dedicated to performing design of experiments (DOE). Design–Expert offers comparative tests, screening, characterization, optimization, robust parameter design, mixture designs and combined designs. Design–Expert provides test matrices for screening up to 50 factors. Statistical significance of these factors is established with analysis of variance (ANOVA). Graphical tools help identify the impact of each factor on the desired outcomes and reveal abnormalities in the data.
This page is based on this Wikipedia article Text is available under the CC BY-SA 4.0 license; additional terms may apply. Images, videos and audio are available under their respective licenses.