Seismic inversion involves the set of methods which seismologists use to infer properties through physical measurements.[1]Surface-wave inversion is the method by which elastic properties, density, and thickness of layers in the subsurface are obtained through analysis of surface-wavedispersion.[2] The entire inversion process requires the gathering of seismic data, the creation of dispersion curves, and finally the inference of subsurface properties.
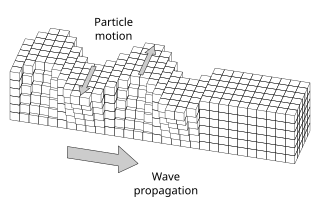
Figure 1. Rayleigh vs Love Waves. The small arrows show particle motion. Particle motion in Love waves is parallel to the surface and normal to the direction of propagation. Displacement in Rayleigh waves occurs in a retrograde elliptical motion normal to the surface and parallel to the direction of wave propagation.
Surface waves
Surface waves are seismic waves that travel at the surface of the earth, along the air/earth boundary.[3] Surface waves are slower than P-waves(compressional waves) and S-waves(transverse waves). Surface waves are classified into two basic types, Rayleigh waves and Love waves. Rayleigh waves travel in a longitudinal manner (the wave motion is parallel to the direction of wave propagation) with particle motion in a retrograde elliptical motion (Figure 1). The Rayleigh waves result from the interaction between P-waves and vertically polarized S-waves.[2] Conversely, Love waves travel in a traverse manner (Figure 1) (the wave motion is perpendicular to the direction of wave propagation), consisting of horizontally polarized S-waves. In seismology, surface waves are collected along with other seismic data, but are traditionally considered noise and an impedance in interpreting deeper reflection and refraction information. Seismologists usually modify seismic equipment and experimental procedures to remove surface wave information from the data. Earthquake seismologists however require the information seismic surface waves provide and thus design their equipment to amplify and gather as much information on these waves as possible. The work by early earthquake seismologists to extract substantial information from surface wave data was the basis for surface wave inversion theory.[3]
Figure 2. Wavelength vs depth. Longer wavelength penetrates deeper.
Dispersion
The usefulness of surface waves in determining subsurface elastic properties arises from the way in which they disperse. Dispersion (geology) is the way in which surface waves spread out as they travel across the surface of the earth. Basically, if ten waves travel along the surface of the earth at the same speed, there is no dispersion. If several of the waves start to travel faster than the others, dispersion is occurring. Surface waves of varying wavelengths penetrate to different depths (Figure 2) and travel at the velocity of the mediums they are travelling through. Figure 2 was generated by plotting the amplitude of surface waves against depth. This was done for two different wavelengths. Both waves have the same total energy, but the longer wavelength has its energy spread out over a larger interval. If earth materials’ elastic parameters yield higher velocities with depth, longer wavelength surface waves will travel faster than those with shorter wavelengths. The variation of velocities with wavelength makes it possible to infer critical information about the subsurface. Dobrin (1951)[3] uses a water disturbance example to illustrate the phenomenon that longer wavelengths tend to travel faster. This increase in speed with wavelength is seen for both group velocities and phase velocities. A wave group consists of waves at varying wavelengths and frequencies. Individual waves of a wave group are usually generated at the same time, but tend to spread out within the group because each wavelet travels at a different speed. A group velocity is basically the speed at which a wave group travels. A phase velocity is the speed at which an individual wave travels, having its own characteristic wavelength and frequency. Fourier theory tells us that a sharp impulse is made up of infinite frequency content in phase at one point. If each frequency travels at the same speed, that peak will remain intact. If each frequency travels at a different speed, that peak will spread out (Figure 3). This spreading out is dispersion. Phase and group velocity are both dependent on wavelength and are related by the equation
where Vgroup is the group velocity, Vphase is the phase velocity, and λ is the wavelength. When attempting surface wave inversion, phase velocities are used more often than group velocities because it is easier to create a dispersion curve of phase velocities. A dispersion curve is a plot of velocity versus frequency or wavelength. After the dispersion curve has been generated, a surface wave inversion process is performed to calculate the subsurface elastic properties. The accuracy of the dispersion curve is crucial in obtaining the correct subsurface elastic parameters from inversion.
Figure 3. Wavelengths of different frequencies spread out over time.
Elastic Properties
Elastic properties of the earth are those properties which affect the propagation of elastic waves. These properties are Lamé parameters and are used to relate stress to strain in isotropic media through Hooke’s law. Density is also related to elastic parameters through velocity equations for compressional and shear waves.
Data Gathering
Two main data gathering techniques are employed in gathering surface wave information. The two methods are spectral analysis of surface waves (SASW)[4] and multi-channel analysis of surface waves (MASW).[5] These techniques use either passive or active sources. Passive sources are simply ambient noise, while active sources include traditional seismic sources such as an explosive device or a steel plate being hit with a hammer. Overall, passive energy sources usually require more time when data gathering than active energy. Ambient noise is also more useful when it comes from random directions. The spectral analysis surface wave (SASW) technique requires the use of a spectral analyzer and at least two geophones. The spectral analyzer is used to study the frequency and phase of signals being recorded by the geophones. An expanding spread array is useful in minimizing the near field effects of surface waves. An increase in offset distance will result in more time for the waves to reach each geophone, giving the longer wavelengths more time to disperse. The shot gather is modified to minimize the influence of body waves. As the data is gathered, the spectral analyzer is able to generate the dispersion curves for the survey area in real time. The multi-channel analysis of surface waves (MASW) technique can be performed similar to a traditional seismic acquisition whereby there is a geophone spread that is acquiring seismic data. The resulting data is processed by picking out the surface wave arrivals from the acquired distance vs. time plot. Based on the distance vs. time plot, the dispersion curve is created.
Dispersion curves
The process of creating dispersion curves from raw surface wave data (distance vs. time plot) can be performed using five transformation processes. The first is known as the wave-field transformation (τ-p transformation), first performed by McMechan and Yedlin (1981).[6] The second is a 2-dimensional wave-field transform (f-k transformation) performed by Yilmaz (1987).[7] The third is a wave-field transform base on phase shift, performed by Park et al. (1998).[8] The fourth is a modified wave-field transform base on frequency decomposition and slant stacking, performed by Xia et al. (2007).[9] The fifth is a high-resolution Linear Radon transformation performed by Luo et al. (2008).[10] In performing a wave-field transformation, a slant stack is done, followed by a Fourier transform. The way in which a Fourier transform changes x-t data into x-ω (ω is angular frequency) data shows why phase velocity dominates surface wave inversion theory. Phase velocity is the velocity of each wave with a given frequency. The modified wavefield transform is executed by doing a Fourier transform first before a slant stack. Slant stacking is a process by which x-t (where x is the offset distance, and t is the time) data is transformed into slowness versus time space. A linear move (similar to normal move out (NMO)) out is applied to the raw data. For each line on a seismic plot, there will be a move out that can be applied that will make that line horizontal. Distances are integrated for each slowness and time composition. This is known as a slant stack because each value for slowness represents a slant in x-t space and the integration stacks these values for each slowness.
Modified wavefield transform
A Fourier transform is applied to raw surface wave data plotted x-t. u(x,t) represents the entire shot gather, and the Fourier transformation results in U(x,ω).
U(x,ω) is then deconvolved and can be expressed in terms of phase and amplitude.
where P(x,ω) is the phase portion of the equation that holds information containing the waves’ dispersion properties, including arrival time information and A(x,ω) is the amplitude portion that contains data pertaining to the attenuation and spherical divergence properties of the wave. Spherical divergence is the idea that as a wave spreads out, the energy in the wave spreads out over the surface of the waveform. Since P(x,ω) contains the dispersion property information,
where Φ=ω/cω, ω is the frequency in radians, and cω is the phase velocity for frequency ω. This data can then be transformed to give velocity as a function of frequency:
This will yield a dispersion curve showing a variety of frequencies travelling at different phase velocities.
The surface wave inversion process is the act of inferring elastic properties such as density, shear wave velocity profile, and thickness from dispersion curves created. There are many methods (algorithms) that have been utilized to perform inversion including:
Multilayer dispersion computation
Least squares curve fitting program
Knopoff’s method
Direct search algorithm
High frequency Rayleigh wave inversion
Refraction microtremor method
Figure 4. Example of a dispersion curve where velocity increases with depth. The blue area represents experimental data, while the red line represents an experimental curve fit to the data.
Multilayer dispersion computation
Haskell (1953)[2] first performed the multilayer dispersion computation. Haskell’s work has been the basis for much of the current surface wave inversion theory. Since Rayleigh waves are composed of P and S-waves and Love waves are composed of only S waves, Haskell derived the elastic wave equations for both P and S-waves. These equations were modified to show Rayleigh wave motion. After assuming a free surface boundary where no stresses or strains cross, the Rayleigh wave equation is simplified. Inputting different values for layer thicknesses, densities, and elastic parameters in the form of P and S wave velocities into the equation will yield a dispersion curve. Parameters can be modified to fit the derived dispersion curve to actual data (Figure 4).
Least squares curve fitting program
Dorman and Ewing (1962)[11] came up with an algorithm based on Haskell’s earlier work. Their method used an iterative technique that enabled the user to input parameters and the computer to find which exact parameters best fit the experimental data.
Knopoff’s method
Knopoff’s method [12] also uses Haskell’s equations to perform the surface wave data inversion, but it simplifies the equations for the fastest computation. The increased speed is mostly accomplished in programming as well as the lack of complex numbers in the calculations. In this algorithm, approximate layer thicknesses, compressional and shear velocities, as well as density values must be input for the model.
Direct search algorithm
The direct search algorithm matches a data driven model to the synthetic dispersion curve (Wathelet et al., 2004).[13] This algorithm creates a theoretical dispersion curve by guessing parameters such as shear wave velocity, compressional wave velocity, density, and thickness. After the theoretical curve is created, the computer then attempts to match this theoretical curve with the actual (experimental) dispersion curve. The values of the parameters are picked at random, with different permutations, and repeated continuously until matching curves are achieved. In some cases, while running the algorithm, different values of shear and compressional velocities, density, and thickness might produce the same dispersion curve. The algorithm calculates a value known as the misfit value as it generates each theoretical dispersion curve. The misfit value is simply a measure of how the generated model stacks up to a true solution. Misfit is given by,
where xdi is the velocity of data curve at frequency fi, xci is the velocity of the calculated curve at frequency fi, σi is the uncertainty of the frequency samples considered and nF is the number of frequency samples considered. If no uncertainty is provided, σi is replaced by xdi.
High frequency Rayleigh wave inversion
The high frequency Rayleigh wave inversion performed by Xia et al. (1999)[14] analyzed the earth using Knopoff’s method. By varying different properties used in creating the dispersion curve, it was discovered that different earth properties had significantly different effects on phase velocities. Changing the S-wave velocity input has a dramatic impact on Rayleigh wave phase velocities at high frequencies (greater than 5Hz). A change in S-wave velocity of 25% changes the Rayleigh wave velocity by 39%. Conversely, P-wave velocity and density have a relatively small impact on Rayleigh wave phase velocity. A change in density of 25% will cause a less than 10% change in surface wave velocity. A change in P-wave velocity will have even less effect (3%).
Microtremor method
The final inversion method, the refraction microtremor (ReMi) technique, makes use of a computer algorithm that forward models normal mode dispersion data obtained from a survey. This method uses regular P-wave and simple refraction acquisition equipment, and does not require an active source, hence the name. Pullammanapellil et al. (2003)[15] used this method to accurately match the S-wave profile of the ROSRINE borehole drilled. The ReMi method accurately matched the overall shear wave velocity profile, but cannot match the detail provided by the shear velocity well log. The discrepancy in overall detail should have no effect in evaluating the subsurface.
Advantages/Disadvantages of Surface Wave Inversion
There are many advantages to using surface waves to image the subsurface. For one, surface wave inversion readily images low-velocity zones. Refraction methods cannot see low-velocity zones because such a zone would bend the traversing wave deeper instead of towards the surface. Surface wave inversion is also non-invasive as well as cost effective. There are a few disadvantages to this method as well. The resolution of the surface wave inversion method is not nearly as resolved as a seismic collection done in a wellbore. There is also the possibility for non-unique solutions to dispersion curves (several sets of parameters can yield the same dispersion curve). Additionally, the presence of multiple modes may exist and leak into the targeted mode that is being inverted for.
Conclusion
Surface wave inversion is becoming a valuable tool in evaluating the near subsurface. Surface waves found on seismograms can now be a useful by product of seismic exploration surveys instead of a waste product. Furthermore, it is more budget friendly because the use of an active energy source is not needed. Also, it is useful in detecting low velocity zones in the subsurface that are undetectable by refraction methods. It is most effective in estimating shear velocity, density, and thickness of subsurface profiles.
The phase velocity of a wave is the rate at which the wave propagates in any medium. This is the velocity at which the phase of any one frequency component of the wave travels. For such a component, any given phase of the wave will appear to travel at the phase velocity. The phase velocity is given in terms of the wavelength λ (lambda) and time period T as
In physics, mathematics, and related fields, a wave is a propagating dynamic disturbance of one or more quantities. Waves can be periodic, in which case those quantities oscillate repeatedly about an equilibrium (resting) value at some frequency. When the entire waveform moves in one direction, it is said to be a traveling wave; by contrast, a pair of superimposed periodic waves traveling in opposite directions makes a standing wave. In a standing wave, the amplitude of vibration has nulls at some positions where the wave amplitude appears smaller or even zero. Waves are often described by a wave equation or a one-way wave equation for single wave propagation in a defined direction.
Seismic waves are waves of energy that travel through Earth's layers, and are a result of earthquakes, volcanic eruptions, magma movement, large landslides and large man-made explosions that give out low-frequency acoustic energy. Many other natural and anthropogenic sources create low-amplitude waves commonly referred to as ambient vibrations. Seismic waves are studied by geophysicists called seismologists. Seismic wave fields are recorded by a seismometer, hydrophone, or accelerometer.
In optics, and by analogy other branches of physics dealing with wave propagation, dispersion is the phenomenon in which the phase velocity of a wave depends on its frequency; sometimes the term chromatic dispersion is used for specificity to optics in particular.
Seismic tomography is a technique for imaging the subsurface of the Earth with seismic waves produced by earthquakes or explosions. P-, S-, and surface waves can be used for tomographic models of different resolutions based on seismic wavelength, wave source distance, and the seismograph array coverage. The data received at seismometers are used to solve an inverse problem, wherein the locations of reflection and refraction of the wave paths are determined. This solution can be used to create 3D images of velocity anomalies which may be interpreted as structural, thermal, or compositional variations. Geoscientists use these images to better understand core, mantle, and plate tectonic processes.
In the physical sciences and electrical engineering, dispersion relations describe the effect of dispersion on the properties of waves in a medium. A dispersion relation relates the wavelength or wavenumber of a wave to its frequency. Given the dispersion relation, one can calculate the phase velocity and group velocity of waves in the medium, as a function of frequency. In addition to the geometry-dependent and material-dependent dispersion relations, the overarching Kramers–Kronig relations describe the frequency dependence of wave propagation and attenuation.
In fluid dynamics, dispersion of water waves generally refers to frequency dispersion, which means that waves of different wavelengths travel at different phase speeds. Water waves, in this context, are waves propagating on the water surface, with gravity and surface tension as the restoring forces. As a result, water with a free surface is generally considered to be a dispersive medium.
In elastodynamics, Love waves, named after Augustus Edward Hough Love, are horizontally polarized surface waves. The Love wave is a result of the interference of many shear waves (S-waves) guided by an elastic layer, which is welded to an elastic half space on one side while bordering a vacuum on the other side. In seismology, Love waves are surface seismic waves that cause horizontal shifting of the Earth during an earthquake. Augustus Edward Hough Love predicted the existence of Love waves mathematically in 1911. They form a distinct class, different from other types of seismic waves, such as P-waves and S-waves, or Rayleigh waves. Love waves travel with a lower velocity than P- or S- waves, but faster than Rayleigh waves. These waves are observed only when there is a low velocity layer overlying a high velocity layer/ sub–layers.
Exploration geophysics is an applied branch of geophysics and economic geology, which uses physical methods, such as seismic, gravitational, magnetic, electrical and electromagnetic at the surface of the Earth to measure the physical properties of the subsurface, along with the anomalies in those properties. It is most often used to detect or infer the presence and position of economically useful geological deposits, such as ore minerals; fossil fuels and other hydrocarbons; geothermal reservoirs; and groundwater reservoirs.
Wave propagation is any of the ways in which waves travel. Single wave propagation can be calculated by 2nd order wave equation or 1st order one-way wave equation.
Seismic migration is the process by which seismic events are geometrically re-located in either space or time to the location the event occurred in the subsurface rather than the location that it was recorded at the surface, thereby creating a more accurate image of the subsurface. This process is necessary to overcome the limitations of geophysical methods imposed by areas of complex geology, such as: faults, salt bodies, folding, etc.
Lamb waves propagate in solid plates or spheres. They are elastic waves whose particle motion lies in the plane that contains the direction of wave propagation and the plane normal. In 1917, the English mathematician Horace Lamb published his classic analysis and description of acoustic waves of this type. Their properties turned out to be quite complex. An infinite medium supports just two wave modes traveling at unique velocities; but plates support two infinite sets of Lamb wave modes, whose velocities depend on the relationship between wavelength and plate thickness.
In fluid dynamics, Airy wave theory gives a linearised description of the propagation of gravity waves on the surface of a homogeneous fluid layer. The theory assumes that the fluid layer has a uniform mean depth, and that the fluid flow is inviscid, incompressible and irrotational. This theory was first published, in correct form, by George Biddell Airy in the 19th century.
Rayleigh waves are a type of surface acoustic wave that travel along the surface of solids. They can be produced in materials in many ways, such as by a localized impact or by piezo-electric transduction, and are frequently used in non-destructive testing for detecting defects. Rayleigh waves are part of the seismic waves that are produced on the Earth by earthquakes. When guided in layers they are referred to as Lamb waves, Rayleigh–Lamb waves, or generalized Rayleigh waves.
In geophysics, seismic inversion is the process of transforming seismic reflection data into a quantitative rock-property description of a reservoir. Seismic inversion may be pre- or post-stack, deterministic, random or geostatistical; it typically includes other reservoir measurements such as well logs and cores.
A synthetic seismogram is the result of forward modelling the seismic response of an input earth model, which is defined in terms of 1D, 2D or 3D variations in physical properties. In hydrocarbon exploration this is used to provide a 'tie' between changes in rock properties in a borehole and seismic reflection data at the same location. It can also be used either to test possible interpretation models for 2D and 3D seismic data or to model the response of the predicted geology as an aid to planning a seismic reflection survey. In the processing of wide-angle reflection and refraction (WARR) data, synthetic seismograms are used to further constrain the results of seismic tomography. In earthquake seismology, synthetic seismograms are used either to match the predicted effects of a particular earthquake source fault model with observed seismometer records or to help constrain the Earth's velocity structure. Synthetic seismograms are generated using specialized geophysical software.
A seismic metamaterial, is a metamaterial that is designed to counteract the adverse effects of seismic waves on artificial structures, which exist on or near the surface of the earth. Current designs of seismic metamaterials utilize configurations of boreholes, trees or proposed underground resonators to act as a large scale material. Experiments have observed both reflections and bandgap attenuation from artificially induced seismic waves. These are the first experiments to verify that seismic metamaterials can be measured for frequencies below 100 Hz, where damage from Rayleigh waves is the most harmful to artificial structures.
In geophysics, geology, civil engineering, and related disciplines, seismic noise is a generic name for a relatively persistent vibration of the ground, due to a multitude of causes, that is often a non-interpretable or unwanted component of signals recorded by seismometers.
Resonant ultrasound spectroscopy (RUS) is a laboratory technique used in geology and material science to measure fundamental material properties involving elasticity. This technique relies on the fact that solid objects have natural frequencies at which they vibrate when mechanically excited. The natural frequency depends on the elasticity, size, and shape of the object—RUS exploits this property of solids to determine the elastic tensor of the material. The great advantage of this technique is that the entire elastic tensor is obtained from a single crystal sample in a single rapid measurement. At lower or more general frequencies, this method is known as acoustic resonance spectroscopy.
Seismic site effects are related to the amplification of seismic waves in superficial geological layers. The surface ground motion may be strongly amplified if the geological conditions are unfavorable. Therefore, the study of local site effects is an important part of the assessment of strong ground motions, seismic hazard and engineering seismology in general. Damage due to an earthquake may thus be aggravated as in the case of the 1985 Mexico City earthquake. For alluvial basins, we may shake a bowl of jelly to model the phenomenon at a small scale.
References
↑ Menke, W., 1989, Geophysical data analysis: Discrete inverse theory. San Diego, Academic Press.
1 2 3 Haskell, N.A., 1953, Dispersion of surface waves on multilayered media: Bulletin of the Seismological Society of America, v. 43, p. 17-34.
1 2 3 Dobrin, M., 1951, Dispersion in seismic surface waves: Geophysics, v. 16, p. 63-80.
↑ Brown., L.T., Boore, D.M., Stokoe II, K.H., 2002, Comparison of Shear-Wave Slowness Profiles at 10 Strong-Motion Sites from Noninvasive SASW Measurements and Measurements Made in Boreholes: Bulletin of the Seismological Society of America, v. 92, p. 3116-3133.
↑ Park, C. B., Xia, J., and Miller, R. D., 1998, Imaging dispersion curves of surface waves on multichannel record: 68th Annual International Meeting, Society of Exploration Geophysics, Expanded Abstracts, p. 1377-1380.
↑ McMechan, G. A., and Yedlin, M. J., 1981. Analysis of dispersive waves by wave-field transformation: Geophysics, v. 46, p. 869-874.
↑ Yilmaz, Ö., 1987. Seismic Data Processing. Society of Exploration Geophysicists, Tulsa, OK, p. 526.
↑ Park, C.B., Miller, R.D., Xia, J., 1998. Imaging dispersion curves of surface waves on multichannel record. Technical Programwith Biographies, SEG, 68th Annual Meeting, New Orleans, Louisiana, pp. 1377–1380.
↑ Xia, J., 2014. Estimation of near-surface shear-wave velocities and quality factors, using multichannel analysis of surface-wave methods. J. Appl. Geophys. 103, 140–151.
↑ Luo, Y., Xia, J., Miller, R.D., et al., 2008. Rayleigh-wave dispersive energy imaging by highresolution linear Radon transform. Pure Appl. Geophys. 165 (5), 903–922.
↑ Dorman, J., Ewing, M., 1962, Numerical Inversion of Seismic Surface Wave Dispersion Data and Crust-Mantle Structure in the New York-Pennsylvania Area: Journal of Geophysical Research, v. 16, p. 5227-5241.
↑ Schwab, F., Knopoff, L., 1970, Surface-wave dispersion computations: Bulletin of the Seismological Society of America, v. 60, p. 321-344.
↑ Wathelet, M., Jongmans, D., Ornberger, M., 2004, Surface-wave inversion using a direct search algorithm and its application to ambient vibration measurements: Near Surface Geophysics, p. 211-221.
↑ Xia, J., Miller, R.D., Park, C.B., Estimation of near-surface shear-wave velocity by inversion of Rayleigh waves: Geophysics, v. 64, p. 691-700.
↑ Pullammanappallil, S., Honjas, B., and Louie J., 2003, Determination of 1-D shear wave velocities using the refraction microtremor method: Proceedings of the third international conference on the application of geophysical methodologies and NDT to transportation and infrastructure.
Uncited References
Foti, S., Comina, C., Boiero, D., Socco, L. V., 2009, Non-uniqueness in surface-wave inversion and consequences on seismic site response analyses: Soil Dynamics and Earthquake Engineering, v. 29, p.982-993.
Kennett, B.L.N., 1976, The inversion of surface wave data: Pure and Applied Geophysics, v. 114, p 747-751.
Luke, B., Calderon-Macias, C., 2007, Inversion of seismic surface wave data to resolve complex profiles: Journal of Geotechnical and Geoenvironmental Engineering, v. 133, p.155-165.
Lai, C. G., Foti, S., and Rix, G. J., 2005, Propagation of data uncertainty in surface wave inversion: Journal of Environmental & Engineering Geophysics, v. 10, p.219-228.
Park, C., Miller, R., Laflen, D., Neb, C., Ivanov, J., Bennet, B., Huggins, R., 2004, Imaging dispersion curves of passive surface waves: SEG Expanded Abstracts, v. 23.
Supranata, Y. E., Kalinski M. E., Ye, Q., 2007, Improving the uniqueness of surface wave inversion using multiple-mode dispersion data: International Journal of Geomechanics, v. 7, p.333-343.
Xia, J., Miller, R.D., Yixian, X., Yinhe, L., Chao, C., Jiangping, L., Ivanov, J., Zeng, C., 2009, High Frequency Rayleigh-Wave Method: Journal of Earth Science, v. 20, p.563-579.
Yamanaka, H., Ishida, H., (1996). Application of genetic algorithms to an inversion of surface dispersion data: Bulletin of the Seismological Society of America, v. 86, p.436-444.
Kallivokas, L.F., Fathi, A., Kucukcoban, S., Stokoe II, K.H., Bielak, J., Ghattas, O., (2013). Site characterization using full waveform inversion: Soil Dynamics and Earthquake Engineering, v. 47, p.62-82.
This page is based on this Wikipedia article Text is available under the CC BY-SA 4.0 license; additional terms may apply. Images, videos and audio are available under their respective licenses.