Tropical cyclone tracking chart

Last updated
Atlantic hurricane tracking chart 2017AtlanticHurricaneTrackingChart.png
Atlantic hurricane tracking chart

A tropical cyclone tracking chart is used by those within hurricane-threatened areas to track tropical cyclones worldwide. In the north Atlantic basin, they are known as hurricane tracking charts. New tropical cyclone information is available at least every six hours in the Northern Hemisphere and at least every twelve hours in the Southern Hemisphere. Charts include maps of the areas where tropical cyclones form and track within the various basins, include name lists for the year, basin-specific tropical cyclone definitions, rules of thumb for hurricane preparedness, emergency contact information, and numbers for figuring out where tropical cyclone shelters are open.

Contents

In paper form originally, computer programs were developed in the 1980s for personal home and use by professional weather forecasters. Those used by weather forecasters saved preparation times, allowing tropical cyclone advisories to be sent an hour earlier. With the advent of the internet in the 1990s, digitally-prepared charts began to include other information along with storm position and past track, including forecast track, areas of wind impact, and related watches and warnings. Geographic information system (GIS) software allows end users to underlay other layered files onto forecast storm tracks to anticipate future impacts.

History

Cape Verde hurricane tracks Cape Verde hurricane track.jpg
Cape Verde hurricane tracks
Chart with concurrent information for Hurricane Arlene and Tropical Storm Bret logged and plotted ArleneBret1987HurricaneTrackingChart.jpg
Chart with concurrent information for Hurricane Arlene and Tropical Storm Bret logged and plotted

Tropical cyclone tracking charts were initially used for tropical cyclone forecasting and towards the end of the year for post season summaries of the season's activity. Their use led to a north Atlantic-based term still in use today: Cape Verde hurricane. Prior to the early 1940s, the term Cape Verde hurricane referred to August and early September storms that formed to the east of the surface plotting charts in use at the time. [1] By October 1955, charts used for tropical cyclone tracking and forecasting operationally, such as United States Weather Bureau Form 770-17 and National Weather Service Chart HU-1, extended eastward to the African coast. [2]

Within the United States since at least 1956, [3] during the Atlantic hurricane season, those within threatened states were provided hurricane tracking charts in order to follow tropical storms and hurricanes during the season for situational awareness. This was more popular along sections of the southern Eastern Seaboard and Gulf Coast of the United States than the coast of California due to their increased danger of a landfalling tropical cyclone. The maps would include place names, latitude and longitude lines, [4] names of the storms on that year's list, [5] along with hurricane preparedness information. [6] Newspapers, [3] television stations, [4] radio stations, [7] banks, [4] restaurants, [8] grocery stores, insurance companies, [5] gas stations, the American Red Cross, the Federal Emergency Management Agency, state departments of emergency management, [9] the National Weather Service, [4] and its subagency the National Hurricane Center were the main suppliers of these charts. Companies would distribute these for free as they were considered good advertising. [4] Some would have a table where you could enter data prior to plotting the storm's position, [10] usually using an associated tropical cyclone symbol: open circle for tropical depression, open circle with curved lines on opposite sides of the circle for tropical storms, and a closed circle with curved lines on opposite sides of the circle for hurricanes. [11] The Vanuatu Meteorology and Geo-Hazards Department started preparing special tropical cyclone tracking charts for its archipelago in the 1980s. [12]

Initially, the charts were in paper form. Magnetic charts appeared in 1956. [13] By 1974, laminated paper was used, and by 1977 maps were placed under glass, [4] so that grease pencil, washable marker, or dry erase marker could be used and that the map could be used for multiple seasons. [14] Starting in the 1980s with the increasing popularity of personal computers, programs were available to track the storms digitally, [15] and databases of past storms could be maintained. However, computational space requirements did not allow access to the entire hurricane database for a related basin until the 1990s, with the advent of more powerful computers with megabytes of storage and file quantities became less limited in computer directory structures. Starting in the mid 1990s, with the popularity of the World Wide Web, web sites kept images of old hurricane tracks and interactive web sites allowed you to specify parameters for the storms you wished to display. [16] Ongoing storms have tracking charts with forecast track overlaid. [17] Since 2004, GIS software has been available for hurricane tracking. [18]

Move away from paper use operationally

Forecast model tracks within ATCF. The NHC official forecast for Ernesto (2006) is light blue, while the storm's actual track is the white line over Florida. Ernesto2006modelspread.png
Forecast model tracks within ATCF. The NHC official forecast for Ernesto (2006) is light blue, while the storm's actual track is the white line over Florida.

Historically, tropical cyclone tracking charts were used to include the past track and prepare future forecasts at Regional Specialized Meteorological Centers and Tropical Cyclone Warning Centers. The need for a more modernized method for forecasting tropical cyclones had become apparent to operational weather forecasters by the mid-1980s. At that time the United States Department of Defense was using paper maps, acetate, grease pencils, and disparate computer programs to forecast tropical cyclones. [19] The Automated Tropical Cyclone Forecasting System (ATCF) software was developed by the Naval Research Laboratory for the Joint Typhoon Warning Center (JTWC) beginning in 1986, [20] and used since 1988. During 1990 the system was adapted by the National Hurricane Center (NHC) for use at the NHC, National Centers for Environmental Prediction and the Central Pacific Hurricane Center. [20] [21] This provided the NHC with a multitasking software environment which allowed them to improve efficiency and cut the time required to make a forecast by 25% or 1 hour. [21] ATCF was originally developed for use within DOS, before later being adapted to Unix and Linux. [20] Despite ATCF's introduction, into the late 1990s, a National Hurricane Center forecaster stated that the most important tools available were "a pair of dividers to measure distance, a ruler, a brush for eraser dirt, three sharp pencils colored red, black, and blue, and a large paper plotting chart". [22]

Markings used

Tropical cyclone symbols used by the National Hurricane Center TCsymbolsNHC.png
Tropical cyclone symbols used by the National Hurricane Center
A JTWC image of the track of Cyclone Quang from April 2015 CycloneQuangApr2015.png
A JTWC image of the track of Cyclone Quang from April 2015
Track of Hurricane Irma from 2017 with colored dots representing Saffir-Simpson scale intensities Irma 2017 track.png
Track of Hurricane Irma from 2017 with colored dots representing Saffir-Simpson scale intensities

Symbols used within the charts vary by basin, by center, and by individual preference. Simple dots or circles can be used for each position. The National Hurricane Center uses a variety of symbols composed of overlapping 6's and 9's for tropical storms and hurricanes to emulate their circulation pattern, and a circle for tropical depressions. [23] Other Northern Hemisphere centers used the overlapping 6 and 9 symbols for all tropical cyclones of tropical storm strength, with L's reserved for tropical depressions or general low pressure areas in the tropics. Southern Hemisphere versions would use backward overlapping 6's and 9's. The World Meteorological Organization uses an unfilled symbol to depict tropical storms, a filled symbol to depict systems of cyclone/hurricane/typhoon strength, and a circle to depict a tropical low or tropical convective cluster. [24] Colors of the symbols may be representative of the cyclone's intensity. [25]

An example of a chart for Matthew showing its five-day forecast track Matthew cone of uncertainty and forecast projection.gif
An example of a chart for Matthew showing its five-day forecast track
A black and white track chart for Hurricane Floyd (1999) using a conic projection HurricaneFloyd1999TrackBW.png
A black and white track chart for Hurricane Floyd (1999) using a conic projection

Lines or dots connecting symbols can be varying colors, solid, dashed, or symbols between the points depending on the intensity and type of the system being tracked. [26] Different colors could also be used to differentiate storms from one other within the same map. [27] If black and white markings are used, tropical depression track portions can be indicated by dots, with tropical storms indicated by dashes, systems of cyclone/hurricane/typhoon strength using a solid line, intermittent triangles for the subtropical cyclone stage, and intermittent plus signs for the extratropical cyclone phase. [28] Systems of category 3 strength or greater on the Saffir–Simpson scale can be depicted with a thicker line. [29]

Sources of information

In order to use a hurricane tracking chart, one needs access to latitude/longitude pairs of the cyclone's center and maximum sustained wind information in order to know which symbol to depict. New tropical cyclone information is available at least every twelve hours in the Southern Hemisphere and at least every six hours in the Northern Hemisphere from Regional Specialized Meteorological Centers and Tropical Cyclone Warning Centers. [30] [31] [32] [33] [34]

In decades past, newspaper, television, and radio (including weather radio) were primary sources for this information. Local television stations within threatened markets would advertise tropical cyclone positions within the morning, evening, and nightly news during their weather segments. The Weather Channel includes the information within their tropical updates every hour during the Atlantic and Pacific hurricane seasons. Starting in the mid 1990s, the World Wide Web allowed for the development of ftp and web sites by the Bureau of Meteorology in Australia, [35] Canadian Hurricane Centre, [36] Central Pacific Hurricane Center, [37] the Nadi Tropical Cyclone Centre/Fiji Meteorological Service, [38] Japan Meteorological Agency, [39] Joint Typhoon Warning Center, [40] Météo-France La Réunion, National Hurricane Center, [33] and the Philippine Atmospheric, Geophysical and Astronomical Services Administration which allows the end user to get their information from their official products. [41]

Use

The maps either use a mercator projection if restricted to the tropics and subtropics, but can use a Lambert conformal conic projection if the maps reach towards the arctic for the North Atlantic basin where tropical cyclones move more poleward. Meteorologists use these maps to estimate a system's initial position based on aircraft, satellite, and surface data within surface weather analyses. The data is then analyzed to determine recent storm motion and create and convey forecast tracks, wind swaths, uncertainty, related watches, and related warnings to end users of tropical cyclone forecasts.

Hurricane tracking charts allow people to track ongoing systems to form their own opinions regarding where the storms are going and whether or not they need to prepare for the system being tracked, including possible evacuation. This continues to be encouraged by the National Oceanic and Atmospheric Administration and National Hurricane Center. [11] Some agencies provide track storms in their immediate vicinity, [42] while others cover entire ocean basins. One can choose to track one storm per map, use the map until the table is filled, or use one map per season. Some tracking charts have important contact information in case of an emergency or to locate nearby hurricane shelters. [9] Tracking charts allow tropical cyclones to be better understood by the end user. [43]

Hurricane tracker apps

A number of Hurricane tracker apps are also available online to install directly over a smartphone. By using these apps, one can easily track the current activity of the Hurricanes. Red Cross has also launched several applications for this purpose. [44]

Related Research Articles

<span class="mw-page-title-main">National Hurricane Center</span> Division of the United States National Weather Service

The National Hurricane Center (NHC) is the division of the United States' NOAA/National Weather Service responsible for tracking and predicting tropical weather systems between the Prime Meridian and the 140th meridian west poleward to the 30th parallel north in the northeast Pacific Ocean and the 31st parallel north in the northern Atlantic Ocean. The agency, which is co-located with the Miami branch of the National Weather Service, is situated on the campus of Florida International University in University Park, Miami, Florida.

<span class="mw-page-title-main">Tropical cyclone naming</span> Tables of names for tropical cyclones

Tropical cyclones and subtropical cyclones are named by various warning centers to simplify communication between forecasters and the general public regarding forecasts, watches and warnings. The names are intended to reduce confusion in the event of concurrent storms in the same basin. Once storms develop sustained wind speeds of more than 33 knots, names are generally assigned to them from predetermined lists, depending on the basin in which they originate. Some tropical depressions are named in the Western Pacific, while tropical cyclones must contain a significant amount of gale-force winds before they are named in the Southern Hemisphere.

<span class="mw-page-title-main">Tropical cyclone warnings and watches</span> Levels of alert issued to areas threatened by a tropical cyclone

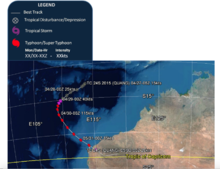
Tropical cyclone warnings and watches are alerts issued by national weather forecasting bodies to coastal areas threatened by the imminent approach of a tropical cyclone of tropical storm or hurricane intensity. They are notices to the local population and civil authorities to make appropriate preparation for the cyclone, including evacuation of vulnerable areas where necessary. It is important that interests throughout the area of an alert make preparations to protect life and property, and do not disregard it on the strength of the detailed forecast track.

<span class="mw-page-title-main">Joint Typhoon Warning Center</span> Joint United States Navy – United States Air Force command

The Joint Typhoon Warning Center (JTWC) is a joint United States Navy – United States Air Force command in Pearl Harbor, Hawaii. The JTWC is responsible for the issuing of tropical cyclone warnings in the North-West Pacific Ocean, South Pacific Ocean, and Indian Ocean for all branches of the U.S. Department of Defense and other U.S. government agencies. Their warnings are intended primarily for the protection of US military ships and aircraft, as well as military installations jointly operated with other countries around the world.

<span class="mw-page-title-main">Pacific hurricane</span> Mature tropical cyclone that develops within the eastern and central Pacific Ocean

A Pacific hurricane is a tropical cyclone that develops within the northeastern and central Pacific Ocean to the east of 180°W, north of the equator. For tropical cyclone warning purposes, the northern Pacific is divided into three regions: the eastern, central, and western, while the southern Pacific is divided into 2 sections, the Australian region and the southern Pacific basin between 160°E and 120°W. Identical phenomena in the western north Pacific are called typhoons. This separation between the two basins has a practical convenience, however, as tropical cyclones rarely form in the central north Pacific due to high vertical wind shear, and few cross the dateline.

<span class="mw-page-title-main">Tropical cyclone forecast model</span> Computer program that uses meteorological data to forecast tropical cyclones

A tropical cyclone forecast model is a computer program that uses meteorological data to forecast aspects of the future state of tropical cyclones. There are three types of models: statistical, dynamical, or combined statistical-dynamic. Dynamical models utilize powerful supercomputers with sophisticated mathematical modeling software and meteorological data to calculate future weather conditions. Statistical models forecast the evolution of a tropical cyclone in a simpler manner, by extrapolating from historical datasets, and thus can be run quickly on platforms such as personal computers. Statistical-dynamical models use aspects of both types of forecasting. Four primary types of forecasts exist for tropical cyclones: track, intensity, storm surge, and rainfall. Dynamical models were not developed until the 1970s and the 1980s, with earlier efforts focused on the storm surge problem.

<span class="mw-page-title-main">James Franklin (meteorologist)</span> Former weather forecaster with NOAA

James Louis Franklin is a former weather forecaster encompassing a 35-year career with National Oceanic and Atmospheric Administration (NOAA). He served as the first branch chief of the newly formed Hurricane Specialist Unit (HSU) before his retirement in 2017.

<span class="mw-page-title-main">Tropical cyclone observation</span>

Tropical cyclone observation has been carried out over the past couple of centuries in various ways. The passage of typhoons, hurricanes, as well as other tropical cyclones have been detected by word of mouth from sailors recently coming to port or by radio transmissions from ships at sea, from sediment deposits in near shore estuaries, to the wiping out of cities near the coastline. Since World War II, advances in technology have included using planes to survey the ocean basins, satellites to monitor the world's oceans from outer space using a variety of methods, radars to monitor their progress near the coastline, and recently the introduction of unmanned aerial vehicles to penetrate storms. Recent studies have concentrated on studying hurricane impacts lying within rocks or near shore lake sediments, which are branches of a new field known as paleotempestology. This article details the various methods employed in the creation of the hurricane database, as well as reconstructions necessary for reanalysis of past storms used in projects such as the Atlantic hurricane reanalysis.

<span class="mw-page-title-main">Tropical cyclone forecasting</span> Science of forecasting how a tropical cyclone moves and its effects

Tropical cyclone forecasting is the science of forecasting where a tropical cyclone's center, and its effects, are expected to be at some point in the future. There are several elements to tropical cyclone forecasting: track forecasting, intensity forecasting, rainfall forecasting, storm surge, tornado, and seasonal forecasting. While skill is increasing in regard to track forecasting, intensity forecasting skill remains unchanged over the past several years. Seasonal forecasting began in the 1980s in the Atlantic basin and has spread into other basins in the years since.

<span class="mw-page-title-main">Invest (meteorology)</span> Area of weather monitored for cyclones

An invest in meteorology is a designated area of disturbed weather that is being monitored for potential tropical cyclone development. Invests are designated by three separate United States forecast centers: the National Hurricane Center, the Central Pacific Hurricane Center, and the Joint Typhoon Warning Center.

<span class="mw-page-title-main">Ocean Prediction Center</span> One of the National Centers for Environmental Predictions service centers

The Ocean Prediction Center (OPC), established in 1995, is one of the National Centers for Environmental Prediction's (NCEP's) original six service centers. Until 2003, the name of the organization was the Marine Prediction Center. Its origins are traced back to the sinking of the RMS Titanic in 1912. The OPC issues forecasts up to five days in advance for ocean areas north of 31° north latitude and west of 35° west longitude in the Atlantic, and across the northeast Pacific north of 30° north latitude and east of 160° east longitude. Until recently, the OPC provided forecast points for tropical cyclones north of 20° north latitude and east of the 60° west longitude to the National Hurricane Center. OPC is composed of two branches: the Ocean Forecast Branch and the Ocean Applications Branch.

The following outline is provided as an overview of and topical guide to tropical cyclones:

<span class="mw-page-title-main">History of tropical cyclone naming</span>

The practice of using names to identify tropical cyclones goes back several centuries, with storms named after places, saints or things they hit before the formal start of naming in each basin. Examples of such names are the 1928 Okeechobee hurricane and the 1938 New England hurricane. The system currently in place provides identification of tropical cyclones in a brief form that is easily understood and recognized by the public. The credit for the first usage of personal names for weather systems is given to the Queensland Government Meteorologist Clement Wragge, who named tropical cyclones and anticyclones between 1887 and 1907. This system of naming fell into disuse for several years after Wragge retired, until it was revived in the latter part of World War II for the Western Pacific. Over the following decades formal naming schemes were introduced for several tropical cyclone basins, including the North and South Atlantic, Eastern, Central, Western and Southern Pacific basins as well as the Australian region and Indian Ocean.

<span class="mw-page-title-main">Glossary of tropical cyclone terms</span>

The following is a glossary of tropical cyclone terms.

<span class="mw-page-title-main">History of Atlantic hurricane warnings</span> Aspect of meteorological history

The history of Atlantic tropical cyclone warnings details the progress of tropical cyclone warnings in the North Atlantic Ocean. The first service was set up in the 1870s from Cuba with the work of Father Benito Viñes. After his death, hurricane warning services were assumed by the US Army Signal Corps and United States Weather Bureau over the next few decades, first based in Jamaica and Cuba before shifting to Washington, D.C. The central office in Washington, which would evolve into the National Meteorological Center and the Weather Prediction Center, assumed the responsibilities by the early 20th century. This responsibility passed to regional hurricane offices in 1935, and the concept of the Atlantic hurricane season was established to keep a vigilant lookout for tropical cyclones during certain times of the year. Hurricane advisories issued every 12 hours by the regional hurricane offices began at this time.

<span class="mw-page-title-main">Automated Tropical Cyclone Forecasting System</span> Software used to predict and forecast tropical cyclogenesis and to track tropical cyclones

The Automated Tropical Cyclone Forecasting System (ATCF) is a piece of software originally developed to run on a personal computer for the Joint Typhoon Warning Center (JTWC) in 1988, and the National Hurricane Center (NHC) in 1990. ATCF remains the main piece of forecasting software used for the United States Government, including the JTWC, NHC, and Central Pacific Hurricane Center. Other tropical cyclone centers in Australia and Canada developed similar software in the 1990s. The data files with ATCF lie within three decks, known as the a-, b-, and f-decks. The a-decks include forecast information, the b-decks contain a history of center fixes at synoptic hours, and the f-decks include the various fixes made by various analysis center at various times. In the years since its introduction, it has been adapted to Unix and Linux platforms.

<span class="mw-page-title-main">Tropical cyclones in 2008</span>

Throughout 2008, 124 tropical cyclones have formed in bodies of water known as tropical cyclone basins. Of these, 83 have been named, by various weather agencies when they attained maximum sustained winds of 35 knots. The strongest storm of the year was Typhoon Jangmi in the Western Pacific Ocean. The deadliest storm of the year was Cyclone Nargis, which caused devastating and castatrophic destruction in Myanmar with 138,373 fatalities. The costliest storm of the year was Hurricane Ike, which wreaked havoc thorough Cuba and Texas, with $38 billion in damage. Throughout the year, 24 Category 3 tropical cyclones formed, including one Category 5 tropical cyclone in the year.

References

  1. Gordon E. Dunn; Banner I. Miller (1960). Atlantic Hurricanes . Louisiana State University Press. p.  54. ASIN   B0006BM85S.
  2. George W. Cry, Willam H. Haggard, and Hugh S. White (1959). Technical Paper 36: North Atlantic Tropical Cyclones Tracks and Frequencies of Hurricanes and Tropical Storms 1886-1958. United States Department of Commerce. p. 22.{{cite book}}: CS1 maint: multiple names: authors list (link)
  3. 1 2 The Corpus Christi Caller-Times (1956-07-29). "Here's the Plotting Map; Be Your Own 'Hurricane Hunter'". pp. 8B–9B.
  4. 1 2 3 4 5 6 United Press International (1977-06-03). "Hurricane Maps Popular". Vol. 83, no. 58. Ruston Daily Leader. p. 16.
  5. 1 2 The Travelers Insurance Company (1957). Hurricane Information and Tracking Chart.
  6. Florida Division of Emergency Management (February 2011). "Hurricane Tracking Map" (PDF). Retrieved 2017-06-03.
  7. Navasota Examiner (1964-08-27). "Hurricane Tracking Charts Available At Radio Station". Vol. 68, no. 51. p. 3.
  8. Library of Congress Copyright Office (July–December 1977). "Catalog of Copyright Entries. Third Series: 1977: July–December: Index". p. 907. Retrieved 2017-06-29.
  9. 1 2 East Baton Rouge Parish Office of Emergency Management (2000). "East Baton Rouge Parish Hurricane Response Map" (PDF). Louisiana Section of the United States Geological Survey . Retrieved 2017-06-04.
  10. City of Biloxi, Mississippi (2006). "Hurricane Tracking Map" (PDF). pp. 6–7. Retrieved 2017-06-19.
  11. 1 2 National Ocean Service (2016-09-07). "Follow That Hurricane!" (PDF). National Oceanic and Atmospheric Administration . Retrieved 2017-06-02.
  12. Rita Narayan (2016-07-04). "Illustrated [Beufort Scale] Vanuatu Tropical Cyclone Tracking Map". Vanuatu Meteorology and Geo-Hazards Department. Retrieved 2017-06-19.
  13. Panama City Herald (1956-07-31). "80: New Merchandise HURRICANE CHART". Vol. 40, no. 151. p. 14.
  14. Corpus Christi Times (1974-09-30). "The Trading Post". Vol. 66, no. 69.
  15. Climate Assessment Technology (1982). The Hurricane Tracker: Users Guide for the IBM Personal Computer.
  16. National Weather Service Office Brownsville, Texas. "Create Your Own Tropical Cyclone Track History" (PDF). National Weather Service. Retrieved 2017-06-17.
  17. National Hurricane Center. "ERIKA Graphics Archive". National Oceanic and Atmospheric Administration. Retrieved 2017-06-17.
  18. ESRI (2004). "ArcGIS 9: Using ArcGIS Tracking Software" (PDF). TASC, Inc. Retrieved 2017-06-17.
  19. Ronald J. Miller; Ann J. Schrader; Charles R. Sampson & Ted L. Tsui (December 1990). "The Automated Tropical Cyclone Forecasting System (ATCF)". Weather and Forecasting. 5 (4): 653–600. Bibcode:1990WtFor...5..653M. doi:10.1175/1520-0434(1990)005<0653:TATCFS>2.0.CO;2.
  20. 1 2 3 Sampson, Charles R; Schrader, Ann J (June 2000). "The Automated Tropical Cyclone Forecasting System (Version 3.2)". Bulletin of the American Meteorological Society. 81 (6): 1231–1240. Bibcode:2000BAMS...81.1231S. doi: 10.1175/1520-0477(2000)081<1231:tatcfs>2.3.co;2 .
  21. 1 2 Rappaport, Edward N; Franklin, James L; Avila, Lixion A; Baig, Stephen R; Beven II, John L; Blake, Eric S; Burr, Christopher A; Jiing, Jiann-Gwo; Juckins, Christopher A; Knabb, Richard D; Landsea, Christopher W; Mainelli, Michelle; Mayfield, Max; McAdie, Colin J; Pasch, Richard J; Sisko, Christopher; Stewart, Stacy R; Tribble, Ahsha N (April 2009). "Advances and Challenges at the National Hurricane Center". Weather and Forecasting. 24 (2): 409. Bibcode:2009WtFor..24..395R. CiteSeerX   10.1.1.207.4667 . doi:10.1175/2008WAF2222128.1. S2CID   14845745.
  22. William A. Sherden (1998). The Fortune Sellers: The Big Business of Buying and Selling Predictions. John Wiley & Sons, Inc. p. 39. ISBN   978-0-471-18178-1 . Retrieved 2017-08-06.
  23. National Hurricane Center (2017). "National Hurricane Center web site" . Retrieved 2017-06-04.
  24. Robert P. Pearce, Royal Meteorological Society, ed. (2002). Meteorology at the Millennium. Vol. 83. Academic Press. p. 103. ISBN   978-0-12-548035-2 . Retrieved 2017-06-04.
  25. Steven P. Sopko and Robert J. Falvey (2015). "Annual Tropical Cyclone Report 2015" (PDF). Joint Typhoon Warning Center. p. 91. Archived from the original (PDF) on 2016-08-16. Retrieved 2017-06-04.
  26. National Hurricane Center (2017). "2016 Atlantic Hurricane Tracks". National Oceanic and Atmospheric Administration . Retrieved 2017-06-04.
  27. John Ingargiola, Clifford Oliver, James Gilpin, and Shabbar Saifee (2013-07-26). "Mitigation Assessment Team Report: Hurricane Charley in Florida. Appendix E: The History of Hurricanes in Southwest Florida" (PDF). Federal Emergency Management Agency. p. E-2. Retrieved 2017-06-04.{{cite web}}: CS1 maint: multiple names: authors list (link)
  28. Richard J. Pasch, Todd B. Kimberlain, and Stacey R. Stewart (2014-09-09). "Preliminary Report Hurricane Floyd 7–17 September, 1999" (PDF). National Hurricane Center. p. 24. Retrieved 2017-06-04.{{cite web}}: CS1 maint: multiple names: authors list (link)
  29. Colin J. McAidie, Christopher W. Landsea, Charles J. Newmann, Joan E. David, and Eric S. Blake (July 2009). Historical Climatological Series 6-2: Tropical Cyclones of the North Atlantic Ocean 1851–2006 (PDF). National Climatic Data Center. p. 202. ISBN   978-0-387-09409-0 . Retrieved 2017-06-04.{{cite book}}: CS1 maint: multiple names: authors list (link)
  30. "Regional Specialized Meteorological Center". Tropical Cyclone Program (TCP). World Meteorological Organization. April 25, 2006. Retrieved November 5, 2006.
  31. Fiji Meteorological Service (2017). "Services" . Retrieved 2017-06-04.
  32. Joint Typhoon Warning Center (2017). "Products and Service Notice". United States Navy. Retrieved 2017-06-04.
  33. 1 2 National Hurricane Center (March 2016). "National Hurricane Center Product Description Document: A User's Guide to Hurricane Products" (PDF). National Oceanic and Atmospheric Administration. Retrieved 2017-06-03.
  34. Japan Meteorological Agency (2017). "Notes on RSMC Tropical Cyclone Information" . Retrieved 2017-06-04.
  35. Bureau of Meteorology. Tropical Cyclone Advices Archived 2009-03-11 at the Wayback Machine , Bureau of Meteorology, 2009.
  36. Canadian Hurricane Centre (2004). Canadian Hurricane Centre's Responsibilities. Environment Canada. Retrieved on 2009-02-16. Archived May 15, 2007, at the Wayback Machine
  37. National Weather Service Honolulu, Hawai'i (2017). "Central Pacific Hurricane Center". Pacific Region Headquarters. Retrieved 2017-06-04.
  38. Fiji Meteorological Service. "Fiji Meteorological Service" . Retrieved 2017-06-04.
  39. "Japan Meteorological Agency: The national meteorological service of Japan" (PDF). Japan Meteorological Agency. Retrieved 2011-02-07.
  40. Joint Typhoon Warning Center. "Joint Typhoon Warning Center Mission Statement". Archived from the original on August 12, 2009. Retrieved July 17, 2013.
  41. Locsin, Joel (November 1, 2014). "For improved response? PAGASA to adopt 'super typhoon' category in 2015". GMA News Online. Retrieved 2 November 2014.
  42. Vanuatu Meteorology & Geo-Hazards Department (2017). "Vanuatu Cyclone Tracking Map" . Retrieved 2017-06-04.
  43. Tiffany Means (2016-05-18). "How to Use a Hurricane Tracking Chart". Thought Co. Retrieved 2017-06-03.
  44. "Hurricane Tracker Apps".