The Dow Jones Industrial Average (DJIA), Dow Jones, or simply the Dow, is a stock market index of 30 prominent companies listed on stock exchanges in the United States.
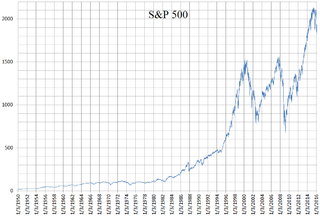
The Standard and Poor's 500, or simply the S&P 500, is a stock market index tracking the stock performance of 500 of the largest companies listed on stock exchanges in the United States. It is one of the most commonly followed equity indices and includes approximately 80% of the total market capitalization of U.S. public companies, with an aggregate market cap of more than $43 trillion as of January 2024.
The Dow Jones Transportation Average is a U.S. stock market index from S&P Dow Jones Indices of the transportation sector, and is the most widely recognized gauge of the American transportation sector. It is the oldest stock index still in use, even older than its better-known relative, the Dow Jones Industrial Average (DJIA).

The Korea Composite Stock Price Index or KOSPI (Korean: 한국종합주가지수) is the index of all common stocks traded on the Stock Market Division—previously, Korea Stock Exchange—of the Korea Exchange. It is the representative stock market index of South Korea, analogous to the S&P 500 in the United States.
This article is a summary of the closing milestones of the Dow Jones Industrial Average, a United States stock market index. Since first closing at 62.76 on February 16, 1885, the Dow Jones Industrial Average has increased, despite several periods of decline.
The October 27, 1997, mini-crash is a global stock market crash that was caused by an economic crisis in Asia, the "Asian contagion", or Tom Yum Goong crisis. The point loss that the Dow Jones Industrial Average suffered on this day currently ranks as the 18th biggest percentage loss since the Dow's creation in 1896. This crash is considered a "mini-crash" because the percentage loss was relatively small compared to some other notable crashes. After the crash, the markets still remained positive for 1997, but the "mini-crash" may be considered as the beginning of the end of the 1990s economic boom in the United States and Canada, as both consumer confidence and economic growth were mildly reduced during the winter of 1997–1998, and when both returned to pre-October levels, they began to grow at an even slower pace than before the crash.
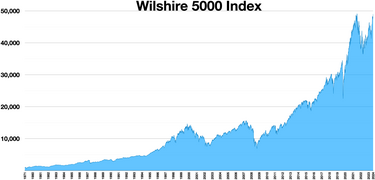
The Wilshire 4500 Completion Index, more commonly the Wilshire 4500, is a capitalization-weighted index of all stocks actively traded in the United States with the exception of the stocks included in the S&P 500 index. The index is created by removing the stocks in the S&P 500 Index from the Wilshire 5000.
The EURO STOXX 50 is a stock index of Eurozone stocks designed by STOXX, an index provider owned by Deutsche Börse Group. The index is composed of 50 stocks from 11 countries in the Eurozone.
The S&P/ASX 200 index is a market-capitalisation weighted and float-adjusted stock market index of stocks listed on the Australian Securities Exchange. The index is maintained by Standard & Poor's and is considered the benchmark for Australian equity performance. It is based on the 200 largest ASX listed stocks, which together account for about 82% of Australia's share market capitalisation.

Ho Chi Minh Stock Exchange, formerly the HCMC Securities Trading Center (HoSTC), is a stock exchange in Ho Chi Minh City, Vietnam. It was established in 1998 under Decision No. 127/1998/QD-TTg of the Prime Minister of Vietnam. HCM Securities Trading Center officially opened on July 20, 2000, and had its first trading session on July 28, 2000, with two listed companies and six security company members.
A capitalization-weightedindex, also called a market-value-weighted index is a stock market index whose components are weighted according to the total market value of their outstanding shares. Every day an individual stock's price changes and thereby changes a stock index's value. The impact that individual stock's price change has on the index is proportional to the company's overall market value, in a capitalization-weighted index. In other types of indices, different ratios are used.
The Nasdaq Composite is a stock market index that includes almost all stocks listed on the Nasdaq stock exchange. Along with the Dow Jones Industrial Average and S&P 500, it is one of the three most-followed stock market indices in the United States. The composition of the NASDAQ Composite is heavily weighted towards companies in the information technology sector. The Nasdaq-100, which includes 100 of the largest non-financial companies in the Nasdaq Composite, accounts for over 90% of the movement of the Nasdaq Composite.
The NYSE Composite (^NYA) is a stock market index covering all common stock listed on the New York Stock Exchange, including American depositary receipts, real estate investment trusts, tracking stocks, and foreign listings. It includes corporations in each of the ten industries listed in the Industry Classification Benchmark. It uses free-float market cap weighting.
The S&P/ASX 300, or simply, ASX 300, is a stock market index of Australian stocks listed on the Australian Securities Exchange (ASX). The index is market-capitalisation weighted, meaning each company included is in proportion to the indexes total market value, and float-adjusted, meaning the index only considers shares available to public investors.

In finance, a stock index, or stock market index, is an index that measures the performance of a stock market, or of a subset of a stock market. It helps investors compare current stock price levels with past prices to calculate market performance.

The Hang Seng Index (HSI) is a freefloat-adjusted market-capitalization-weighted stock-market index in Hong Kong. It is used to record and monitor daily changes of the largest companies of the Hong Kong stock market and is the main indicator of the overall market performance in Hong Kong. These 82 constituent companies represent about 58% of the capitalisation of the Hong Kong Stock Exchange.
The August 2011 stock markets fall was the sharp drop in stock prices in August 2011 in stock exchanges across the United States, Middle East, Europe and Asia. This was due to fears of contagion of the European sovereign debt crisis to Spain and Italy, as well as concerns over France's current AAA rating, concerns over the slow economic growth of the United States and its credit rating being downgraded. Severe volatility of stock market indexes continued for the rest of the year.
This article is a summary of the closing milestones of the S&P 500 Index, a United States stock market index.
VN30 Equal Weight Index tracks the total performance of the top 30 large-cap, liquid stocks listed on the Ho Chi Minh City stock exchange along with two popular indices in Vietnam: VN Index and VN30 Index. All index constituents are equal-weighted to help investors deal with liquidity, foreign ownership and state-owned enterprise constraints when investing in Vietnam.