World energy supply and consumption

Last updated

Global energy consumption, measured in exajoules per year: Coal, oil, and natural gas remain the primary global energy sources even as renewables have begun rapidly increasing. Global Energy Consumption.svg
Global energy consumption, measured in exajoules per year: Coal, oil, and natural gas remain the primary global energy sources even as renewables have begun rapidly increasing.
Primary energy consumption by source (worldwide) from 1965 to 2020 World energy mix.svg
Primary energy consumption by source (worldwide) from 1965 to 2020

World energy supply and consumption refers to the global supply of energy resources and its consumption. Throughout its lifecycle, global energy supplies have multiple different stages such as initial production, refinement activities, trade of energy resources, and final consumption of the energy. [3]

Contents

Energy supplies may exist in various forms, such as raw resources (coal, unprocessed oil & gas, uranium), or more processed and refined forms of energy (refined oil that becomes fuel, electricity, etc.). Energy resources may be used in various different ways, depending on the specific resource (e.g. coal), and intended end use (industrial, residential, etc.). Energy production and consumption play a significant role in the global economy, enabling industrial manufacturing processes or global transportation. A significant lack of energy supplies is called an energy crisis. The total energy supply chain, from initial production and final consumption, involves many different activities that causes a loss of useful energy ultimately, [4] a thermodynamic concept known as exergy.

An important problem concerning energy production and consumption is greenhouse gas emissions and environmental pollution. Of about 50 billion tonnes worldwide annual total greenhouse gas emissions, [5] 36 billion tonnes of carbon dioxide was a result of energy use (almost all from fossil fuels) in 2021. [6] The goal set in the Paris Agreement to limit climate change will be difficult to achieve. [7] Many scenarios have been envisioned to reduce greenhouse gas emissions, usually by the name of net zero by 2050.

As of 2022, energy consumption is still about 80% from fossil fuels. [8] The Gulf States and Russia are major energy exporters, with notable customers being the European Union and China, where domestically not enough energy is produced in order to satisfy energy demand. Total energy consumption generally increases about 1–2% per year. [9] More recently, renewable energy has been growing rapidly, averaging about 20% per year in the 2010s. [10] [11]

Per capita, energy consumption in North America is very high, while in less developed countries it is low and usually more renewable. [12] [13] There is a clear connection between energy consumption per capita, and GDP per capita. [14]

Primary energy production

World total primary energy consumption by type in 2020 [15]

  Oil (31.2%)
  Coal (27.2%)
  Natural Gas (24.7%)
  Hydro (renewables) (6.9%)
  Nuclear (4.3%)
  Others (renewables) (5.7%)
World map with primary energy use per person in 2021 Energy use per person.svg
World map with primary energy use per person in 2021

Primary Energy refers to first form of energy encountered, as raw resources collected directly from energy production, before any conversion or transformation of the energy occurs.

Energy production is usually classified as:

Primary energy assessment by IEA follows certain rules [note 1] to ease measurement of different kinds of energy. These rules are controversial. Water and air flow energy that drives hydro and wind turbines, and sunlight that powers solar panels, are not taken as PE, which is set at the electric energy produced. But fossil and nuclear energy are set at the reaction heat, which is about three times the electric energy. This measurement difference can lead to underestimating the economic contribution of renewable energy. [17]

Enerdata displays data for "Total energy / production: Coal, Oil, Gas, Biomass, Heat and Electricity" and for "Renewables / % in electricity production: Renewables, non-renewables". [8]

The table lists worldwide PE and the countries producing most (76%) of that in 2021, using Enerdata. The amounts are rounded and given in million tonnes of oil equivalent per year (1 Mtoe = 11.63 TWh (3.23 megajoules), where 1 TWh = 109 kWh) and % of Total. Renewable is Biomass plus Heat plus renewable percentage of Electricity production (hydro, wind, solar). Nuclear is nonrenewable percentage of Electricity production. The above-mentioned underestimation of hydro, wind and solar energy, compared to nuclear and fossil energy, applies also to Enerdata.

The 2021 world total energy production of 14,800 MToe corresponds to a little over 172 PWh / year, or about 19.6 TW of power generation.

Largest Primary Energy producers (76% of world production) as of 2021, given in million tonnes of oil equivalent per year
Total (MToe)CoalOil & GasRenewableNuclear
China2,95071%13%10%6%
United States2,21013%69%8%10%
Russia1,51616%78%2%4%
Saudi Arabia6100100%00
Iran354099%01%
United Arab Emirates218099%01%
India61550%11%33%6%
Canada5365%81%10%4%
Indonesia45169%17%14%0
Australia42364%33%3%0
Brazil3251%55%42%2%
Nigeria249047%53%0
Algeria1500100%00
South Africa15191%1%8%0
Norway214093%7%0
France12801%34%65%
Germany10227%3%47%23%
World1480027%53%13%7%

2021 world electricity generation by source. Total generation was 28 petawatt-hours. [18]

  Coal (36%)
  Natural gas (23%)
  Hydro (15%)
  Nuclear (10%)
  Wind (7%)
  Solar (4%)
  Other (5%)

Energy conversion

NationExport minus Import in 2021 (MToe) [19]
Russia682
Saudi Arabia388
Australia296
Canada245
Indonesia226
Norway185
Italy-114
Turkey-118
Germany-187
South Korea-239
India-323
Japan-357
China-803
Primary energy sources are transformed by the energy sector to generate energy carriers. Different energy forms (PES).png
Primary energy sources are transformed by the energy sector to generate energy carriers.

Energy resources must be processed in order to make it suitable for final consumption. For example, there may be various impurities in raw coal mined or raw natural gas that was produced from an oil well that may make it unsuitable to be burned in a power plant.

Primary energy is converted in many ways to energy carriers, also known as secondary energy: [20]

Electricity generators are driven by steam or gas turbines in a thermal plant, or water turbines in a hydropower station, or wind turbines, usually in a wind farm. The invention of the solar cell in 1954 started electricity generation by solar panels, connected to a power inverter. Mass production of panels around the year 2000 made this economic.

Energy trade

Much primary and converted energy is traded among countries. The table lists countries with large difference of export and import in 2021, expressed in Mtoe. A negative value indicates that much energy import is needed for the economy. [19] Russian gas exports were reduced a lot in 2022, [21] as pipelines to Asia plus LNG export capacity is much less than the gas no longer sent to Europe. [22]

Transport of energy carriers is done by tanker ship, tank truck, LNG carrier, rail freight transport, pipeline and by electric power transmission.

Total energy supply

Total Energy Supply and Primary Energy (in MToe)
TESPE
China3,6502,950
India927615
Russia8111,516
Japan40052
South Korea298151
Canada289536
Germany286102
Saudi Arabia219610
World TES history (in Million Tons of Energy Equivalent)
YearTES
19908,700
20009,900
201012,600
201914,400
202013,800
202114,500

Total energy supply (TES) indicates the sum of production and imports subtracting exports and storage changes. [23] For the whole world TES nearly equals primary energy PE because imports and exports cancel out, but for countries TES and PE differ in quantity, and also in quality as secondary energy is involved, e.g., import of an oil refinery product. TES is all energy required to supply energy for end users.

The tables list TES and PE for some countries where these differ much, both in 2021 and TES history. Most growth of TES since 1990 occurred in Asia. The amounts are rounded and given in Mtoe. Enerdata labels TES as Total energy consumption. [24]

25% of worldwide primary production is used for conversion and transport, and 6% for non-energy products like lubricants, asphalt and petrochemicals. [25] In 2019 TES was 606 EJ and final consumption was 418 EJ, 69% of TES. [26] Most of the energy lost by conversion occurs in thermal electricity plants and the energy industry own use.

Discussion about energy loss

There are different qualities of energy. Heat, especially at a relatively low temperature, is low-quality energy, whereas electricity is high-quality energy. It takes around 3 kWh of heat to produce 1 kWh of electricity. But by the same token, a kilowatt-hour of this high-quality electricity can be used to pump several kilowatt-hours of heat into a building using a heat pump. Electricity can be used in many ways in which heat cannot. So the loss of energy incurred in thermal electricity plants is not comparable to a loss due to, say, resistance in power lines, because of quality differences.

In fact, the loss in thermal plants is due to poor conversion of chemical energy of fuel to electricity by combustion. Chemical energy of fuel is not low-quality because conversion to electricity in fuel cells can theoretically approach 100%. So energy loss in thermal plants is real loss.

Final consumption

World total final consumption of 9,717 Mtoe by region in 2017 (IEA, 2019) [27]

   OECD (38.2%)
  Middle East (5.1%)
  Non-OECD Eurasia (7.5%)
  China (20.6%)
  Rest of Asia (13.5%)
  Non-OECD Americas (4.8%)
  Africa (6.1%)
  International aviation and marine bunkers (4.2%)

Total final consumption (TFC) is the worldwide consumption of energy by end-users (whereas primary energy consumption (Eurostat) [28] or total energy supply (IEA) is total energy demand and thus also includes what the energy sector uses itself and transformation and distribution losses). This energy consists of fuel (78%) and electricity (22%). The tables list amounts, expressed in million tonnes of oil equivalent per year (1 Mtoe = 11.63 TWh) and how much of these is renewable energy. Non-energy products are not considered here. The data are of 2018. [25] [29] The world's renewable share of TFC was 18% in 2018: 7% traditional biomass, 3.6% hydropower and 7.4% other renewables. [30]

In the period 2005–2017 worldwide final consumption of coal increased by 23%, of oil and gas increased by 18%, and that of electricity increased by 41%. [25]

Fuel comes in three types: Fossil fuel is natural gas, fuel derived from petroleum (LPG, gasoline, kerosene, gas/diesel, fuel oil), or from coal (anthracite, bituminous coal, coke, blast furnace gas). Secondly, there is renewable fuel (biofuel and fuel derived from waste). And lastly, the fuel used for district heating.

The amounts of fuel in the tables are based on lower heating value.

The first table lists final consumption in the countries/regions which use most (85%), and per person as of 2018. In developing countries fuel consumption per person is low and more renewable. Canada, Venezuela and Brazil generate most electricity with hydropower.

Final consumption in most using countries and per person (as of 2018) [25] [29]
Fuel
Mtoe
of which
renewable
Electricity
Mtoe
of which
renewable
TFC pp
toe
China1,4366%55530%1.4
United States1,1068%33919%4.4
Europe98211%30939%2.5
Africa53158%5723%0.5
India48732%10425%0.4
Russia3691%6526%3.0
Japan2013%8119%2.2
Brazil16638%4578%1.0
Indonesia12621%2214%0.6
Canada1398%4583%5.0
Iran1470%226%2.1
Mexico957%2518%1.0
South Korea855%465%2.6
Australia607%1821%3.2
Argentina427%1127%1.2
Venezuela203%688%0.9
World705014%197030%1.2

The next table shows countries consuming most (85%) in Europe.

Countries consuming most (85%) in Europe as of 2018.
CountryFuel
Mtoe
of which
renewable
Electricity
Mtoe
of which
renewable
Germany15610%4546%
France10012%3821%
United Kingdom955%2640%
Italy879%2539%
Spain6010%2143%
Poland5812%1216%
Ukraine385%1012%
Netherlands364%916%
Belgium268%723%
Sweden2035%1172%
Austria2019%586%
Romania1920%457%
Finland1834%739%
Portugal1120%467%
Denmark1115%371%
Norway816%10100%

Energy for energy

Some fuel and electricity is used to construct, maintain and demolish/recycle installations that produce fuel and electricity, such as oil platforms, uranium isotope separators and wind turbines. For these producers to be economical the ratio of energy returned on energy invested (EROEI) or energy return on investment (EROI) should be large enough.

If the final energy delivered for consumption is E and the EROI equals R, then the net energy available is E-E/R. The percentage available energy is 100-100/R. For R>10 more than 90% is available but for R=2 only 50% and for R=1 none. This steep decline is known as the net energy cliff. [31]

Availability of data

Many countries publish statistics on the energy supply and consumption of either their own country, of other countries of interest, or of all countries combined in one chart. One of the largest organizations in this field, the International Energy Agency (IEA), sells yearly comprehensive energy data which makes this data paywalled and difficult to access for internet users. [25] The organization Enerdata on the other hand publishes a free Yearbook, making the data more accessible. [8] Another trustworthy organization that provides accurate energy data, mainly referring to the USA, is the U.S. Energy Information Administration.

Due to the COVID-19 pandemic, there was a significant decline in energy usage worldwide in 2020, but total energy demand worldwide had recovered by 2021, and has hit a record high in 2022. [32]

IEA scenarios

In World Energy Outlook 2023 the IEA notes that "We are on track to see all fossil fuels peak before 2030". [33] :18 The IEA presents three scenarios: [33] :17

  1. The Stated Policies Scenario (STEPS) provides an outlook based on the latest policy settings. The share of fossil fuel in global energy supply – stuck for decades around 80% – starts to edge downwards and reaches 73% by 2030. [33] :18 This undercuts the rationale for any increase in fossil fuel investment. [33] :19 Renewables are set to contribute 80% of new power capacity to 2030, with solar PV alone accounting for more than half. [33] :20 The STEPS sees a peak in energy-related CO2 emissions in the mid-2020s but emissions remain high enough to push up global average temperatures to around 2.4 °C in 2100. [33] :22 Total energy demand continues to increase through to 2050. [33] :23 Total energy investment remains at about US$3 trillion per year. [33] :49
  2. The Announced Pledges Scenario (APS) assumes all national energy and climate targets made by governments are met in full and on time. The APS is associated with a temperature rise of 1.7 °C in 2100 (with a 50% probability). [33] :92 Total energy investment rises to about US$4 trillion per year after 2030. [33] :49
  3. The Net Zero Emissions by 2050 (NZE) Scenario limits global warming to 1.5 °C. [33] :17 The share of fossil fuel reaches 62% in 2030. [33] :101 Methane emissions from fossil fuel supply cuts by 75% in 2030. [33] :45 Total energy investment rises to almost US$5 trillion per year after 2030. [33] :49 Clean energy investment needs to rise everywhere, but the steepest increases are needed in emerging market and developing economies other than China, requiring enhanced international support. [33] :46 The share of electricity in final consumption exceeds 50% by 2050 in NZE. The share of nuclear power in electricity generation remains broadly stable over time in all scenarios, about 9%. [33] :106

The IEA's "Electricity 2024" report details a 2.2% growth in global electricity demand for 2023, forecasting an annual increase of 3.4% through 2026, with notable contributions from emerging economies like China and India, despite a slump in advanced economies due to economic and inflationary pressures. The report underscores the significant impact of data centers, AI, and cryptocurrency, projecting a potential doubling of electricity consumption to 1,000 TWh by 2026, which is on par with Japan's current usage. Notably, 85% of the additional demand is expected to originate from China and India, with India's demand alone predicted to grow over 6% annually until 2026, driven by economic expansion and increasing air conditioning use. Southeast Asia's electricity demand is also forecasted to climb by 5% annually through 2026. In stark contrast, Africa's per capita electricity consumption has stalled, with no expected significant growth until the end of 2026. In the United States, a decrease was seen in 2023, but a moderate rise is anticipated in the coming years, largely fueled by data centers. The European Union experienced a significant drop in consumption in 2023 to a two-decade low, with only a gradual recovery expected. The report also anticipates that a surge in electricity generation from low-emissions sources will meet the global demand growth over the next three years, with renewable energy sources predicted to surpass coal by early 2025. [34] [35]

Alternative scenarios

Alternative scenarios for achieving the Paris Climate Agreement Goals have been developed, using IEA data but proposing transition to nearly 100% renewables by mid-century, along with steps such as reforestation. Nuclear power and carbon capture are excluded in these scenarios. [36] The researchers say the costs will be far less than the $5 trillion per year governments currently spend subsidizing the fossil fuel industries responsible for climate change. [36] :ix

In the +2.0 C (global warming) Scenario total primary energy demand in 2040 can be 450 EJ = 10,755 Mtoe, or 400 EJ = 9560 Mtoe in the +1.5 Scenario, well below the current production. Renewable sources can increase their share to 300 EJ in the +2.0 C Scenario or 330 EJ in the +1.5 Scenario in 2040. In 2050 renewables can cover nearly all energy demand. Non-energy consumption will still include fossil fuels. [36] :xxvii Fig. 5

Global electricity generation from renewable energy sources will reach 88% by 2040 and 100% by 2050 in the alternative scenarios. "New" renewables—mainly wind, solar and geothermal energy—will contribute 83% of the total electricity generated. [36] :xxiv The average annual investment required between 2015 and 2050, including costs for additional power plants to produce hydrogen and synthetic fuels and for plant replacement, will be around $1.4 trillion. [36] :182

Shifts from domestic aviation to rail and from road to rail are needed. Passenger car use must decrease in the OECD countries (but increase in developing world regions) after 2020. The passenger car use decline will be partly compensated by strong increase in public transport rail and bus systems. [36] :xxii Fig.4

CO2 emission can reduce from 32 Gt in 2015 to 7 Gt (+2.0 Scenario) or 2.7 Gt (+1.5 Scenario) in 2040, and to zero in 2050. [36] :xxviii

See also

Lists

Notes

  1. IEA Primary energy assessment: See Archived 11 June 2021 at the Wayback Machine , chapter 7

    Related Research Articles

    <span class="mw-page-title-main">International Energy Agency</span> Autonomous intergovernmental organisation

    The International Energy Agency (IEA) is a Paris-based autonomous intergovernmental organisation, established in 1974, that provides policy recommendations, analysis and data on the global energy sector. The 31 member countries and 13 association countries of the IEA represent 75% of global energy demand.

    <span class="mw-page-title-main">Electric energy consumption</span> Worldwide consumption of electricity

    Electric energy consumption is energy consumption in the form of electrical energy. About a fifth of global energy is consumed as electricity: for residential, industrial, commercial, transportation and other purposes. Quickly increasing this share by further electrification is extremely important to limit climate change, because most other energy is consumed by burning fossil fuels thus emitting greenhouse gases which trap heat.

    The energy policy of India is to increase the locally produced energy in India and reduce energy poverty, with more focus on developing alternative sources of energy, particularly nuclear, solar and wind energy. Net energy import dependency was 40.9% in 2021-22.

    <span class="mw-page-title-main">Energy in Denmark</span> Energy and electricity production, consumption, import and export in Denmark

    Denmark has considerable sources of oil and natural gas in the North Sea and ranked as number 32 in the world among net exporters of crude oil in 2008. Denmark expects to be self-sufficient with oil until 2050. However, gas resources are expected to decline, and production may decline below consumption in 2020, making imports necessary. Denmark imports around 12% of its energy.

    <span class="mw-page-title-main">Energy policy of Australia</span> Overview of the energy policy of Australia

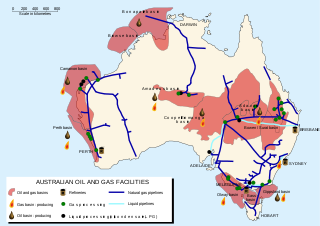
    The energy policy of Australia is subject to the regulatory and fiscal influence of all three levels of government in Australia, although only the State and Federal levels determine policy for primary industries such as coal. Federal policies for energy in Australia continue to support the coal mining and natural gas industries through subsidies for fossil fuel use and production. Australia is the 10th most coal-dependent country in the world. Coal and natural gas, along with oil-based products, are currently the primary sources of Australian energy usage and the coal industry produces over 30% of Australia's total greenhouse gas emissions. In 2018 Australia was the 8th highest emitter of greenhouse gases per capita in the world.

    <span class="mw-page-title-main">Energy policy of China</span> Energy sources used and produced by China

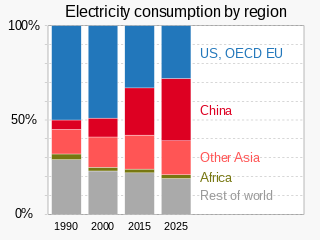
    China is both the world's largest energy consumer and the largest industrial country, and ensuring adequate energy supply to sustain economic growth has been a core concern of the Chinese Government since the founding of the People's Republic of China in 1949. Since the country's industrialization in the 1960s, China is currently the world's largest emitter of greenhouse gases, and coal in China is a major cause of global warming. However, from 2010 to 2015 China reduced energy consumption per unit of GDP by 18%, and CO2 emissions per unit of GDP by 20%. On a per-capita basis, China was only the world's 51st largest emitter of greenhouse gases in 2016. China is also the world's largest renewable energy producer, and the largest producer of hydroelectricity, solar power and wind power in the world. The energy policy of China is connected to its industrial policy, where the goals of China's industrial production dictate its energy demand managements.  

    <span class="mw-page-title-main">Fossil fuel phase-out</span> Gradual reduction of the use and production of fossil fuels

    Fossil fuel phase-out is the gradual reduction of the use and production of fossil fuels to zero, to reduce deaths and illness from air pollution, limit climate change, and strengthen energy independence. It is part of the ongoing renewable energy transition, but is being hindered by fossil fuel subsidies.

    <span class="mw-page-title-main">Energy in India</span> Overview of the production, consumption, import and export of energy and electricity in India

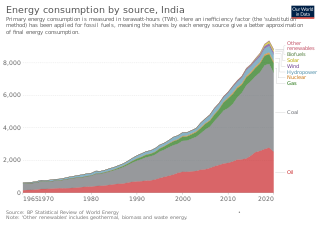
    Since 2013, total primary energy consumption in India has been the third highest in the world after China and United States. India is the second-top coal consumer in the year 2017 after China. India ranks third in oil consumption with 22.1 crore tons in 2017 after United States and China. India is net energy importer to meet nearly 47% of its total primary energy in 2019.

    <span class="mw-page-title-main">Energy in New Zealand</span>

    Despite abundant natural resources and a relatively small population, New Zealand is a net importer of energy, in the form of petroleum products. The ratio of non-renewable and renewable energy sources was fairly consistent from 1975 to 2008, with about 70 per cent of primary energy supply coming from hydrocarbon fuels. This ratio decreased to about 60 per cent in 2018. The proportion of non-renewable energy varies annually, depending on water flows into hydro-electricity lakes and demand for energy. In 2018, approximately 60% of primary energy was from non-renewable hydrocarbon fuels and 40% was from renewable sources. In 2007 energy consumption per capita was 120 gigajoules. Per capita energy consumption had increased 8 per cent since 1998. New Zealand uses more energy per capita than 17 of 30 OECD countries. New Zealand is one of 13 OECD countries that does not operate nuclear power stations.

    <span class="mw-page-title-main">Energy in Finland</span> Overview of the production, consumption, import and export of energy and electricity in Finland

    Energy in Finland describes energy and electricity production, consumption and import in Finland. Energy policy of Finland describes the politics of Finland related to energy. Electricity sector in Finland is the main article regarding electricity in Finland.

    <span class="mw-page-title-main">Energy in Switzerland</span> Overview of energy in Switzerland

    Energy in Switzerland is transitioning towards sustainability, targeting net zero emissions by 2050 and a 50% reduction in greenhouse gas emissions by 2030.

    <span class="mw-page-title-main">Energy mix</span>

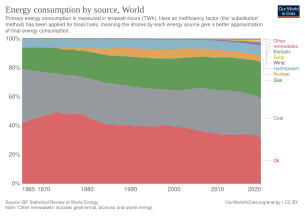
    The energy mix is a group of different primary energy sources from which secondary energy for direct use - such as electricity - is produced. Energy mix refers to all direct uses of energy, such as transportation and housing, and should not be confused with power generation mix, which refers only to generation of electricity, as electricity only accounts for 20 % of the world's final energy consumption.

    <span class="mw-page-title-main">Energy in Italy</span> Overview of the production, consumption, import and export of energy and electricity in Italy

    Energy in Italy comes mostly from fossil fuels. Among the most used resources are petroleum, natural gas, coal and renewables. Italy has few energy resources, and most supplies are imported.

    <span class="mw-page-title-main">Energy in Australia</span> Overview of the production, consumption, import and export of energy and electricity in Australia

    Energy in Australia is the production in Australia of energy and electricity, for consumption or export. Energy policy of Australia describes the politics of Australia as it relates to energy.

    <span class="mw-page-title-main">Energy in Indonesia</span> Overview of the production, consumption, import and export of energy and electricity in Indonesia

    In 2019, the total energy production in Indonesia is 450.79 Mtoe, with a total primary energy supply is 231.14 Mtoe and electricity final consumption is 263.32 TWh. Energy use in Indonesia has been long dominated by fossil resources. Once a major oil exporter in the world and joined OPEC in 1962, the country has since become a net oil importer despite still joined OPEC until 2016, making it the only net oil importer member in the organization. Indonesia is also the fourth-largest biggest coal producer and one of the biggest coal exporter in the world, with 24,910 million tons of proven coal reserves as of 2016, making it the 11th country with the most coal reserves in the world. In addition, Indonesia has abundant renewable energy potential, reaching almost 417,8 gigawatt (GW) which consisted of solar, wind, hydro, geothermal energy, ocean current, and bioenergy, although only 2,5% have been utilized. Furthermore, Indonesia along with Malaysia, have two-thirds of ASEAN's gas reserves with total annual gas production of more than 200 billion cubic meters in 2016.

    <span class="mw-page-title-main">Energy in Turkey</span> Energy used and produced in Turkey

    Energy consumption per person in Turkey is similar to the world average, and over 85 per cent is from fossil fuels. From 1990 to 2017 annual primary energy supply tripled, but then remained constant to 2019. In 2019, Turkey's primary energy supply included around 30 per cent oil, 30 per cent coal, and 25 per cent gas. These fossil fuels contribute to Turkey's air pollution and its above average greenhouse gas emissions. Turkey mines its own lignite but imports three-quarters of its energy, including half the coal and almost all the oil and gas it requires, and its energy policy prioritises reducing imports.

    <span class="mw-page-title-main">Energy in Slovenia</span> Overview of the production, consumption, import and export of energy and electricity in Slovenia

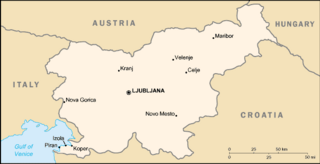
    Total primary energy supply (TPES) in Slovenia was 6.80 Mtoe in 2019. In the same year, electricity production was 16.1 TWh, consumption was 14.9 TWh.

    <span class="mw-page-title-main">Energy transition</span> Significant structural change in an energy system

    An energy transition is a significant structural change in an energy system regarding supply and consumption. Currently, a transition to sustainable energy is underway to limit climate change. It is also called renewable energy transition. The current transition is driven by a recognition that global greenhouse-gas emissions must be drastically reduced. This process involves phasing-down fossil fuels and re-developing whole systems to operate on low carbon electricity. A previous energy transition took place during the industrial revolution and involved an energy transition from wood and other biomass to coal, followed by oil and most recently natural gas.

    Denmark is a leading country in renewable energy production and usage. Renewable energy sources collectively produced 81% of Denmark's electricity generation in 2022, and are expected to provide 100% of national electric power production from 2030. Including energy use in the heating/cooling and transport sectors, Denmark is expected to reach 100% renewable energy in 2050, up from the 34% recorded in 2021.

    <span class="mw-page-title-main">Climate change in Malaysia</span> Impact of global warming on the south-east Asian country and mitigating and adaptating to it

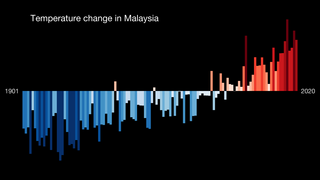
    Climate change is having a considerable impact in Malaysia. Increasing temperatures are likely to greatly increase the number of heatwaves occurring annually. Variations in precipitation may increase the frequency of droughts and floods in various local areas. Sea level rise may inundate some coastal areas. These impacts are expected to have numerous environmental and socioeconomic effects, exacerbating existing environmental issues and reinforcing inequality.

    References

    1. Jackson RB, et al. (2022). "Global fossil carbon emissions rebound near pre-COVID-19 levels". Environmental Research Letters. 17 (3): 031001. arXiv: 2111.02222 . Bibcode:2022ERL....17c1001J. doi:10.1088/1748-9326/ac55b6. S2CID   241035429 . Retrieved 22 May 2022.
    2. "Energy consumption by source". Our World in Data. Retrieved 12 January 2024.
    3. "Glossary:Final energy consumption". ec.europa.eu. Retrieved 7 April 2024.
    4. "Energy definitions". Archived from the original on 5 July 2023. Retrieved 16 August 2023.
    5. Ritchie, Hannah; Roser, Max; Rosado, Pablo (11 May 2020). "CO₂ and Greenhouse Gas Emissions". Our World in Data. Archived from the original on 3 August 2020. Retrieved 5 September 2022.
    6. "Global CO2 emissions rebounded to their highest level in history in 2021 - News". IEA. Archived from the original on 15 August 2022. Retrieved 5 September 2022.
    7. "The Truth Behind the Climate Pledges – FEU-US". Archived from the original on 21 August 2022. Retrieved 1 September 2022.
    8. 1 2 3 "World Energy Statistics | Enerdata". Yearbook.enerdata.net. Archived from the original on 23 August 2022. Retrieved 26 August 2022.
    9. Ritchie, Hannah; Roser, Max; Rosado, Pablo (28 November 2020). "Energy". Our World in Data. Archived from the original on 16 April 2023. Retrieved 16 September 2022. Global energy consumption continues to grow, but it does seem to be slowing – averaging around 1% to 2% per year.
    10. "Global wind and solar growth on track to meet climate targets". Reuters. 31 March 2022. Archived from the original on 16 April 2023. Retrieved 16 September 2022.
    11. "Global Electricity Review 2022". Ember. 29 March 2022. Archived from the original on 2 April 2022. Retrieved 16 September 2022.
    12. "Energy use per person". Archived from the original on 28 November 2020. Retrieved 9 September 2022.
    13. "Renewable energy consumption (% of total final energy consumption) | Data".
    14. "Energy use per person vs. GDP per capita, 2021". Our World in Data.
    15. "Statistical Review of World Energy (2021)" (PDF). p. 13. Archived (PDF) from the original on 15 August 2021. Retrieved 19 August 2021.
    16. “Data Page: Primary energy consumption per capita”, part of the following publication: Hannah Ritchie, Pablo Rosado and Max Roser (2023) - “Energy”. Data adapted from U.S. Energy Information Administration, Energy Institute, Various sources. Retrieved from https://ourworldindata.org/grapher/per-capita-energy-use [online resource]
    17. Sauar, Erik (31 August 2017). "IEA underreports contribution solar and wind by a factor of three compared to fossil fuels". energypost.eu. Energy Post. Archived from the original on 22 April 2018. Retrieved 22 April 2018.
    18. "Yearly electricity data". ember-climate.org. 6 December 2023. Retrieved 23 December 2023.
    19. 1 2 "Balance of world energy trade | Global Energy Trading | Enerdata". Archived from the original on 13 August 2022. Retrieved 27 August 2022.
    20. Encyclopaedia Britannica, vol.18, Energy Conversion, 15th ed., 1992
    21. Attinasi, Maria Grazia; Doleschel, Julia; Gerinovics, Rinalds; Gunnella, Vanessa; Mancini, Michele (4 August 2022). "Trade flows with Russia since the start of its invasion of Ukraine". Archived from the original on 29 August 2022. Retrieved 29 August 2022.
    22. Tsafos, Nikos (4 May 2022). "Can Russia Execute a Gas Pivot to Asia?". www.csis.org. Archived from the original on 29 August 2022. Retrieved 29 August 2022.
    23. "International recommendations for energy statistics (IRES)" (PDF). UN Department of Economic and Social Affairs. 2018. p. 105. Archived (PDF) from the original on 11 June 2021. Retrieved 17 March 2022.
    24. "World Energy Consumption Statistics | Enerdata". Archived from the original on 31 August 2022. Retrieved 31 August 2022.
    25. 1 2 3 4 5 Data and Statistics. 2018. International Energy Agency. Archived 6 August 2021 at the Wayback Machine
    26. Key world energy statistics 2021 Archived 6 July 2022 at the Wayback Machine p.6,34
    27. "Key World Energy Statistics 2019". International Energy Agency. 26 September 2019. pp. 6, 36. Archived from the original on 31 December 2019. Retrieved 7 December 2019.
    28. "Energy consumption in 2018" (PDF). Eurostat. Archived (PDF) from the original on 10 June 2021. Retrieved 10 June 2021.
    29. 1 2 "Data tables – Data & Statistics". Archived from the original on 3 February 2021. Retrieved 8 June 2021.
    30. GSR 2020 report Archived 23 September 2020 at the Wayback Machine Fig.1 p.32
    31. "Is There Such a Thing as a "Net Energy Cliff?"". 8 May 2017. Archived from the original on 20 September 2022. Retrieved 20 September 2022.
    32. "Global primary energy consumption by source". Our World in Data.
    33. 1 2 3 4 5 6 7 8 9 10 11 12 13 14 15 16 https://www.iea.org/reports/world-energy-outlook-2023 Download pdf
    34. "Electricity 2024 – Analysis". IEA. 24 January 2024. Retrieved 8 April 2024.
    35. IEA (2024), Electricity 2024, IEA, Paris https://www.iea.org/reports/electricity-2024, Licence: CC BY 4.0
    36. 1 2 3 4 5 6 7 Teske, Sven, ed. (2019). Achieving the Paris Climate Agreement Goals: Global and Regional 100% Renewable Energy Scenarios with Non-energy GHG Pathways for +1.5°C and +2°C. Springer International Publishing. p. 3. doi:10.1007/978-3-030-05843-2. ISBN   9783030058425. S2CID   198078901. Archived from the original on 15 April 2021. Retrieved 8 June 2021.