Elections for North West Leicestershire District Council took place on 3 May 2007, [1] with the previous election taking place in 2003 and with the next to be held on 5 May 2011. The election took place across all 20 electoral wards and a total of 38 councillors were elected. This election was a landslide win for the Conservatives who gained an absolute majority in the council for the first time since its creation in 1973.
Party | Seats | Gains | Losses | Net gain/loss | Seats % | Votes % | Votes | +/− | |
---|---|---|---|---|---|---|---|---|---|
Conservative | 27 | 15 | 0 | +15 | 71.1 | 45.3 | 24,670 | +13.4 | |
Labour | 5 | 1 | 16 | −15 | 13.2 | 31.4 | 17,097 | −19.2 | |
Liberal Democrats | 3 | 0 | 1 | −1 | 7.9 | 14.4 | 7,839 | +1.0 | |
BNP | 2 | 2 | 0 | +2 | 5.3 | 4.9 | 2,665 | New | |
Independent | 1 | 0 | 1 | −1 | 2.6 | 3.2 | 1,734 | −0.9 | |
UKIP | 0 | 0 | 0 | ±0 | 0 | 0.8 | 411 | New |
In wards that are represented by more than one councillor, electors were given more than one vote each, hence the voter turnout may not match the number of votes cast.
Party | Candidate | Votes | % | ±% | |
---|---|---|---|---|---|
Conservative | Richard Blunt | 722 | 77.5 | +5.2 | |
Labour | Maureen Palmer | 210 | 22.5 | −5.2 | |
Turnout | 932 | ||||
Conservative hold | Swing | ||||
Party | Candidate | Votes | % | ±% | |
---|---|---|---|---|---|
Conservative | John Geoffrey Coxon | 633 | 66.5 | −6.6 | |
Labour | Gerry Pointon | 167 | 17.5 | −9.4 | |
Liberal Democrats | Michael Geoffrey Cort | 152 | 16.0 | N/A | |
Turnout | 952 | ||||
Conservative hold | Swing | ||||
Party | Candidate | Votes | % | ±% | |
---|---|---|---|---|---|
Conservative | Roger David Bayliss | 668 | 25.6 | +3.8 | |
Conservative | Graham Arthur Allman | 583 | 22.3 | +4.4 | |
Labour | Martin Hilary Mabey | 383 | 14.7 | −3.1 | |
Labour | Gordon Tacey | 351 | 13.4 | −6.4 | |
Liberal Democrats | David John Price | 320 | 12.3 | +0.4 | |
Liberal Democrats | Geoffrey Ronald Cort | 307 | 11.7 | +0.8 | |
Turnout | 1,306 | ||||
Conservative hold | Swing | ||||
Conservative gain from Labour | Swing | ||||
Party | Candidate | Votes | % | ±% | |
---|---|---|---|---|---|
Conservative | James Hoult | 905 | 28.6 | +6.3 | |
Conservative | David Geraint Jones | 883 | 27.9 | +5.5 | |
Labour | David Paul Whetton | 603 | 19.1 | −10.1 | |
Labour | Sean David Sheahan | 507 | 16.0 | −10.0 | |
Liberal Democrats | Lee James Windram | 265 | 8.4 | N/A | |
Turnout | 1,582 | ||||
Conservative gain from Labour | Swing | ||||
Party | Candidate | Votes | % | ±% | |
---|---|---|---|---|---|
Conservative | Ted Purver | 388 | 57.1 | −4.6 | |
Labour | Rodney Peter Storer | 170 | 25.0 | −13.3 | |
Liberal Democrats | Sheila Maureen Wyatt | 122 | 17.9 | N/A | |
Turnout | 680 | ||||
Conservative hold | Swing | ||||
Party | Candidate | Votes | % | ±% | |
---|---|---|---|---|---|
Conservative | Nicholas James Rushton | 729 | 80.2 | +11.7 | |
Labour | Yvonne Smith | 180 | 19.8 | +5.6 | |
Turnout | 909 | ||||
Conservative hold | Swing | ||||
Party | Candidate | Votes | % | ±% | |
---|---|---|---|---|---|
Conservative | Gerald Dalby | 1360 | 24.5 | +4.3 | |
Conservative | Tony Saffell | 1243 | 22.4 | +5.5 | |
Conservative | Charles Meynell | 1087 | 19.6 | +3.3 | |
Labour | Derek Henry Wintle | 734 | 13.2 | −4.5 | |
Labour | Patrick David Lynch | 679 | 12.3 | −2.8 | |
Labour | Robert Allan Haskins | 442 | 8.0 | −5.7 | |
Turnout | 1,848 | ||||
Conservative hold | Swing | ||||
Conservative gain from Labour | Swing | ||||
Conservative hold | Swing | ||||
Party | Candidate | Votes | % | ±% | |
---|---|---|---|---|---|
Independent | Philip Holland | 509 | 23.8 | −4.6 | |
Labour | John Legrys | 501 | 23.4 | −0.6 | |
BNP | Sean Martyn Lee | 483 | 22.6 | N/A | |
Conservative | Rebecca Harding | 325 | 15.2 | N/A | |
Conservative | Paul Richard Oakden | 321 | 15.0 | N/A | |
Turnout | 1,069 | ||||
Independent hold | Swing | ||||
Labour gain from Independent | Swing | ||||
Party | Candidate | Votes | % | ±% | |
---|---|---|---|---|---|
Liberal Democrats | Michael Barry Wyatt | 873 | 13.9 | −8.5 | |
Liberal Democrats | Julie Anne Roberts | 749 | 11.9 | −6.3 | |
Liberal Democrats | Dominic John McGill | 713 | 11.4 | −7.1 | |
Labour | Jim Collins | 601 | 9.6 | −5.2 | |
Labour | Adi Freeman | 541 | 8.6 | −5.1 | |
BNP | Gavin Sharpe | 515 | 8.2 | N/A | |
Conservative | Keith Merrie | 472 | 7.5 | N/A | |
Labour | Jim Roberts | 470 | 7.5 | −4.9 | |
Conservative | Paul Bridgen | 468 | 7.5 | N/A | |
Independent | Adoline Uvenia Smith | 446 | 7.1 | N/A | |
Conservative | John Turnbull Kailofer | 424 | 6.8 | N/A | |
Turnout | 2,091 | ||||
Liberal Democrats hold | Swing | ||||
Party | Candidate | Votes | % | ±% | |
---|---|---|---|---|---|
BNP | Graham Ronald Partner | 449 | 16.1 | N/A | |
Conservative | Matthew John Blain | 410 | 14.7 | N/A | |
Labour | Steven John Peace | 355 | 12.7 | −23.4 | |
Labour | Paul Anthony Hyde | 329 | 11.8 | −25.7 | |
Conservative | Sudesh Mattu | 290 | 10.4 | N/A | |
Liberal Democrats | Lesley Bowler | 273 | 9.8 | −16.6 | |
Liberal Democrats | David Perrins | 267 | 9.6 | N/A | |
Independent | Matt Pollard | 217 | 7.8 | N/A | |
Independent | Fred Harris | 196 | 7.0 | N/A | |
Turnout | 1,393 | ||||
BNP gain from Labour | Swing | ||||
Conservative gain from Labour | Swing | ||||
Party | Candidate | Votes | % | ±% | |
---|---|---|---|---|---|
Conservative | Craig Bowley | 737 | 15.3 | ±0.0 | |
Conservative | Ted Blunt | 731 | 15.2 | +0.2 | |
Labour | Dai Male | 707 | 14.7 | −8.1 | |
Labour | Penny Hopkins | 620 | 12.9 | −10.8 | |
Conservative | Mary Powell | 599 | 12.5 | N/A | |
Labour | Ray Merry | 559 | 11.6 | −11.2 | |
UKIP | Adam Rowland Tilbury | 411 | 8.5 | N/A | |
Liberal Democrats | Leighanna Marie Littlejohn | 225 | 4.7 | N/A | |
Liberal Democrats | Ben Alan Roberts | 222 | 4.6 | N/A | |
Turnout | 1,604 | ||||
Conservative gain from Labour | Swing | ||||
Labour hold | Swing | ||||
Party | Candidate | Votes | % | ±% | |
---|---|---|---|---|---|
Conservative | Trevor Pendleton | 1011 | 46.5 | +8.8 | |
Conservative | Alison Smith | 736 | 33.9 | +4.1 | |
Labour | Lawrence Heap | 427 | 19.6 | +3.2 | |
Turnout | 1,087 | ||||
Conservative hold | Swing | ||||
Party | Candidate | Votes | % | ±% | |
---|---|---|---|---|---|
Conservative | Rowena Emma Holland | 548 | 24.1 | −2.9 | |
Conservative | Dickie Hunt | 538 | 23.6 | N/A | |
Labour | John Lewis | 481 | 21.1 | −21.4 | |
Labour | Tom Neilson | 468 | 20.6 | −9.9 | |
Liberal Democrats | Alexander Longdon | 241 | 10.6 | N/A | |
Turnout | 1,138 | ||||
Conservative gain from Labour | Swing | ||||
Party | Candidate | Votes | % | ±% | |
---|---|---|---|---|---|
Conservative | Annette Bridges | 794 | 27.9 | +3.2 | |
Conservative | John Bridges | 755 | 26.5 | N/A | |
Labour | Eddie Palmer | 651 | 22.8 | −13.5 | |
Labour | Patrick John Regan | 650 | 22.8 | −16.2 | |
Turnout | 1,425 | ||||
Conservative gain from Labour | Swing | ||||
Party | Candidate | Votes | % | ±% | |
---|---|---|---|---|---|
Conservative | Jackie Bridgen | 441 | 55.0 | N/A | |
Labour | Glynn John Davies | 361 | 45.0 | −15.7 | |
Turnout | 802 | ||||
Conservative gain from Labour | Swing | ||||
Party | Candidate | Votes | % | ±% | |
---|---|---|---|---|---|
Conservative | Nigel Smith | 560 | 50.0 | −6.0 | |
Independent | Virge Richichi | 366 | 32.7 | N/A | |
Labour | George Arthur Botterill | 193 | 17.3 | −26.7 | |
Turnout | 1,119 | ||||
Conservative hold | Swing | ||||
Party | Candidate | Votes | % | ±% | |
---|---|---|---|---|---|
Conservative | Paula Diana Purver | 595 | 24.9 | −0.6 | |
Conservative | Christopher Timmis | 525 | 21.9 | N/A | |
Labour | Alison Jane Cooper | 487 | 20.4 | −5.5 | |
Labour | John Geary | 482 | 20.2 | −8.1 | |
Liberal Democrats | Colin Pickering | 301 | 12.6 | N/A | |
Turnout | 1,195 | ||||
Conservative gain from Labour | Swing | ||||
Party | Candidate | Votes | % | ±% | |
---|---|---|---|---|---|
Labour | Pam Clayfield | 634 | 23.0 | −0.7 | |
Labour | David Burton Everitt | 564 | 20.4 | −4.4 | |
Conservative | Clare Louise Blain | 501 | 18.1 | +10.0 | |
Conservative | Yvo Henniker-Heaton | 376 | 13.6 | N/A | |
Liberal Democrats | Shane David Bowler | 355 | 12.9 | −10.4 | |
Liberal Democrats | Darren James Finney | 331 | 12.0 | −8.2 | |
Turnout | 1,381 | ||||
Labour hold | Swing | ||||
Party | Candidate | Votes | % | ±% | |
---|---|---|---|---|---|
Conservative | David John Stevenson | 958 | 31.8 | −3.3 | |
Conservative | Barry Webster | 928 | 30.8 | −2.4 | |
Liberal Democrats | Nicola Timmins | 342 | 11.4 | N/A | |
BNP | Daniel Nathan Woolcock | 296 | 9.8 | N/A | |
Labour | Patricia Jeannine Underwood | 284 | 9.4 | −7.5 | |
Labour | Corinne Male | 206 | 6.8 | −8.0 | |
Turnout | 1,507 | ||||
Conservative hold | Swing | ||||
Party | Candidate | Votes | % | ±% | |
---|---|---|---|---|---|
BNP | Ian Meller | 922 | 14.3 | N/A | |
Labour | Derek Howe | 839 | 13.0 | −18.0 | |
Conservative | Tony Gillard | 712 | 11.1 | N/A | |
Labour | Ray Woodward | 699 | 10.8 | −14.2 | |
Liberal Democrats | Ann Edwards | 644 | 10.0 | N/A | |
Liberal Democrats | Daniel Leslie Bowler | 574 | 8.9 | N/A | |
Liberal Democrats | David James Wyatt | 563 | 8.7 | −14.3 | |
Labour | Steve Preston | 562 | 8.7 | −12.3 | |
Conservative | David Russell Ruck | 500 | 7.8 | N/A | |
Conservative | Sandra Mary Ruck | 429 | 6.7 | N/A | |
Turnout | 2,148 | ||||
BNP gain from Labour | Swing | ||||
Labour hold | Swing | ||||
Conservative gain from Liberal Democrats | Swing | ||||
Elections to the Borough Council in Slough, England, were held on 3 May 2007. One third of the council was up for election. This was the 122nd Slough general local authority election since Slough became a local government unit in 1863.
Rutland County Council is the local authority for the unitary authority of Rutland in the East Midlands of England. The current council was created in April 1997. The population of the council's area at the 2011 census was 37,369.
North West Leicestershire District Council elections are held every four years. North West Leicestershire District Council is the local authority for the non-metropolitan district of North West Leicestershire in Leicestershire, England. Since the last boundary changes in 2015, 38 councillors are elected from 38 wards.
The 2007 council elections in Guildford saw the Conservatives retain control over Guildford Borough Council. Full results for each ward can be found at Guildford Council election, full results, 2007.
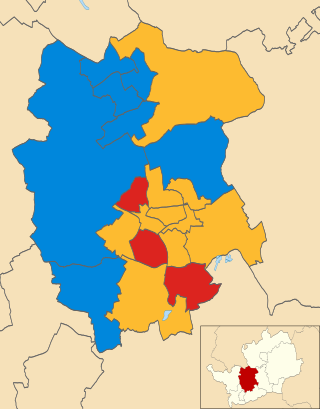
Elections to Leicestershire County Council took place on 4 June 2009, having been delayed from 7 May, in order to coincide with elections to the European Parliament. A total of 55 councillors were elected from 52 electoral divisions across the county's 7 districts. The Conservatives held control of the council and increased their majority from 5 to 17 seats after gaining many seats from Labour who lost 70% of their seats. The BNP fielded many more candidates than at the last election which caused their vote share to increase dramatically.
The 2007 St Albans City and District Council election took place on 3 May 2007 to elect members of St Albans District Council in Hertfordshire, England. One third of the council was up for election and the Liberal Democrats lost overall control of the council to no overall control.
Elections to the North West Leicestershire District Council took place on 5 May 2011, in line with other local elections in the United Kingdom. A total of 38 councillors were elected from 20 wards as the whole council is up for election.
Elections to North West Leicestershire District Council took place on 1 May 2003, with the previous election having taken place in 1999 and with the next held in May 2007. The election took place across all 20 electoral wards and a total of 38 councillors were elected. The Labour Party retained control of the council for the fourth election in a row, albeit with a narrow majority of two seats.
Elections to North West Leicestershire District Council took place on 4 May 1995, with the previous election having taken place in 1991 and with the next held in 1999. The election took place across all 22 electoral wards and a total of 40 councillors were elected. Labour tightened its grip on the council by capturing nine seats from the Conservatives. Former Conservative rural strongholds such as Appleby, Breedon, Kegworth and Ravenstone fell to Labour, who also came away with all but one seat in Ashby. The result was that Labour held 35, or 87.5% of the seats, the Conservatives were reduced to just three seats and the Liberal Democrats failed to gain any seats.
The 2011 council elections in Guildford saw the Conservatives retain control over Guildford Borough Council with an increased majority of 20 seats. Full results for each ward can be found at Guildford Council election, full results, 2011.
The 2007 Basildon District Council election took place on 3 May 2007 to elect members of Basildon District Council in Essex, England. One third of the council was up for election and the Conservative party stayed in overall control of the council.
Elections to Cannock Chase District Council took place on 3 May 2012 on the same day as other local elections in England. A total of 14 councillors were elected from 13 wards as a third of the council was up for election. This also included a by-election in the Hagley ward which filled a vacancy that had arisen since the previous election. There were no elections held in the Hednesford Green Heath or Rawnsley wards as those wards elect only two councillors in the other two years of the election cycle.
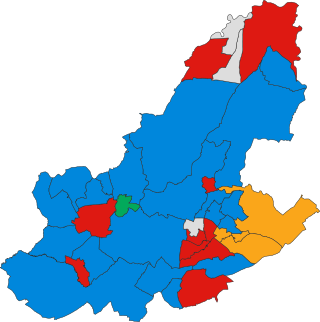
An election to Leicestershire County Council took place on 2 May 2013 as part of the 2013 United Kingdom local elections. 55 councillors were elected from 52 electoral divisions, which returned either one or two county councillors each by first-past-the-post voting for a four-year term of office. The Conservatives held control of the council with a reduced majority of 5 seats. Despite a strong challenge from UKIP, the party only gained 2 seats whilst the Liberal Democrats lost one seat and Labour recouped some of their 2009 losses, gaining 6 seats.
Elections to elect all members of the North West Leicestershire District Council took place on 7 May 2015, simultaneously with a general election, held as one of the English local elections of that year.
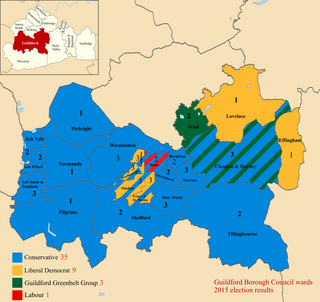
The 2015 Guildford Borough Council election took place on 7 May 2015 to elect members of Guildford Borough Council in England as one of the 2015 local elections, held simultaneously with the General Election.
The 2007 West Oxfordshire District Council election took place on 3 May 2007 to elect members of West Oxfordshire District Council in Oxfordshire, England. One third of the council was up for election and the Conservative Party stayed in overall control of the council.
Elections to North Ayrshire Council took place on 4 May 2017 on the same day as the 31 other Scottish local government elections.
Elections to elect all members of the North West Leicestershire District Council took place on 2 May 2019, held as one of the English local elections of that year.
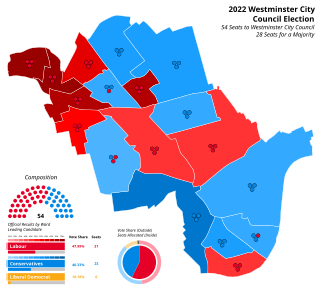
The 2022 Westminster City Council election took place on 5 May 2022. All 54 members of Westminster City Council have been elected. The elections took place alongside local elections in the other London boroughs and elections to local authorities across the United Kingdom.
Elections to North Ayrshire Council took place on 5 May 2022 on the same day as the 31 other Scottish local government elections. As with other Scottish council elections, it was held using single transferable vote (STV) – a form of proportional representation – in which multiple candidates are elected in each ward and voters rank candidates in order of preference.