The climate of Finland is influenced most by its latitude: Finland is located between 60 and 70 N. Because of Finland's northern location, winter is the longest season. Only on the south coast and in the southwest is summer as long as winter. On average, winter lasts from early January to late February in the outermost islands in the archipelago and the warmest locations along the southwestern coast – notably in Hanko – and from early October to mid May in the most elevated locations, such as northwestern Lapland and the lowest valleys in northeastern Lapland. This means that southern portions of the country are snow-covered about three to four months of the year, and the northern for about seven months. The long winter causes about half of the annual 500 to 600 millimetres (19.7 to 23.6 in) precipitation in the north to fall as snow. Precipitation in the south amounts to about 600 to 700 millimetres (23.6 to 27.6 in) annually. Like that of the north, it occurs all through the year, though not so much of it is snow. [1]
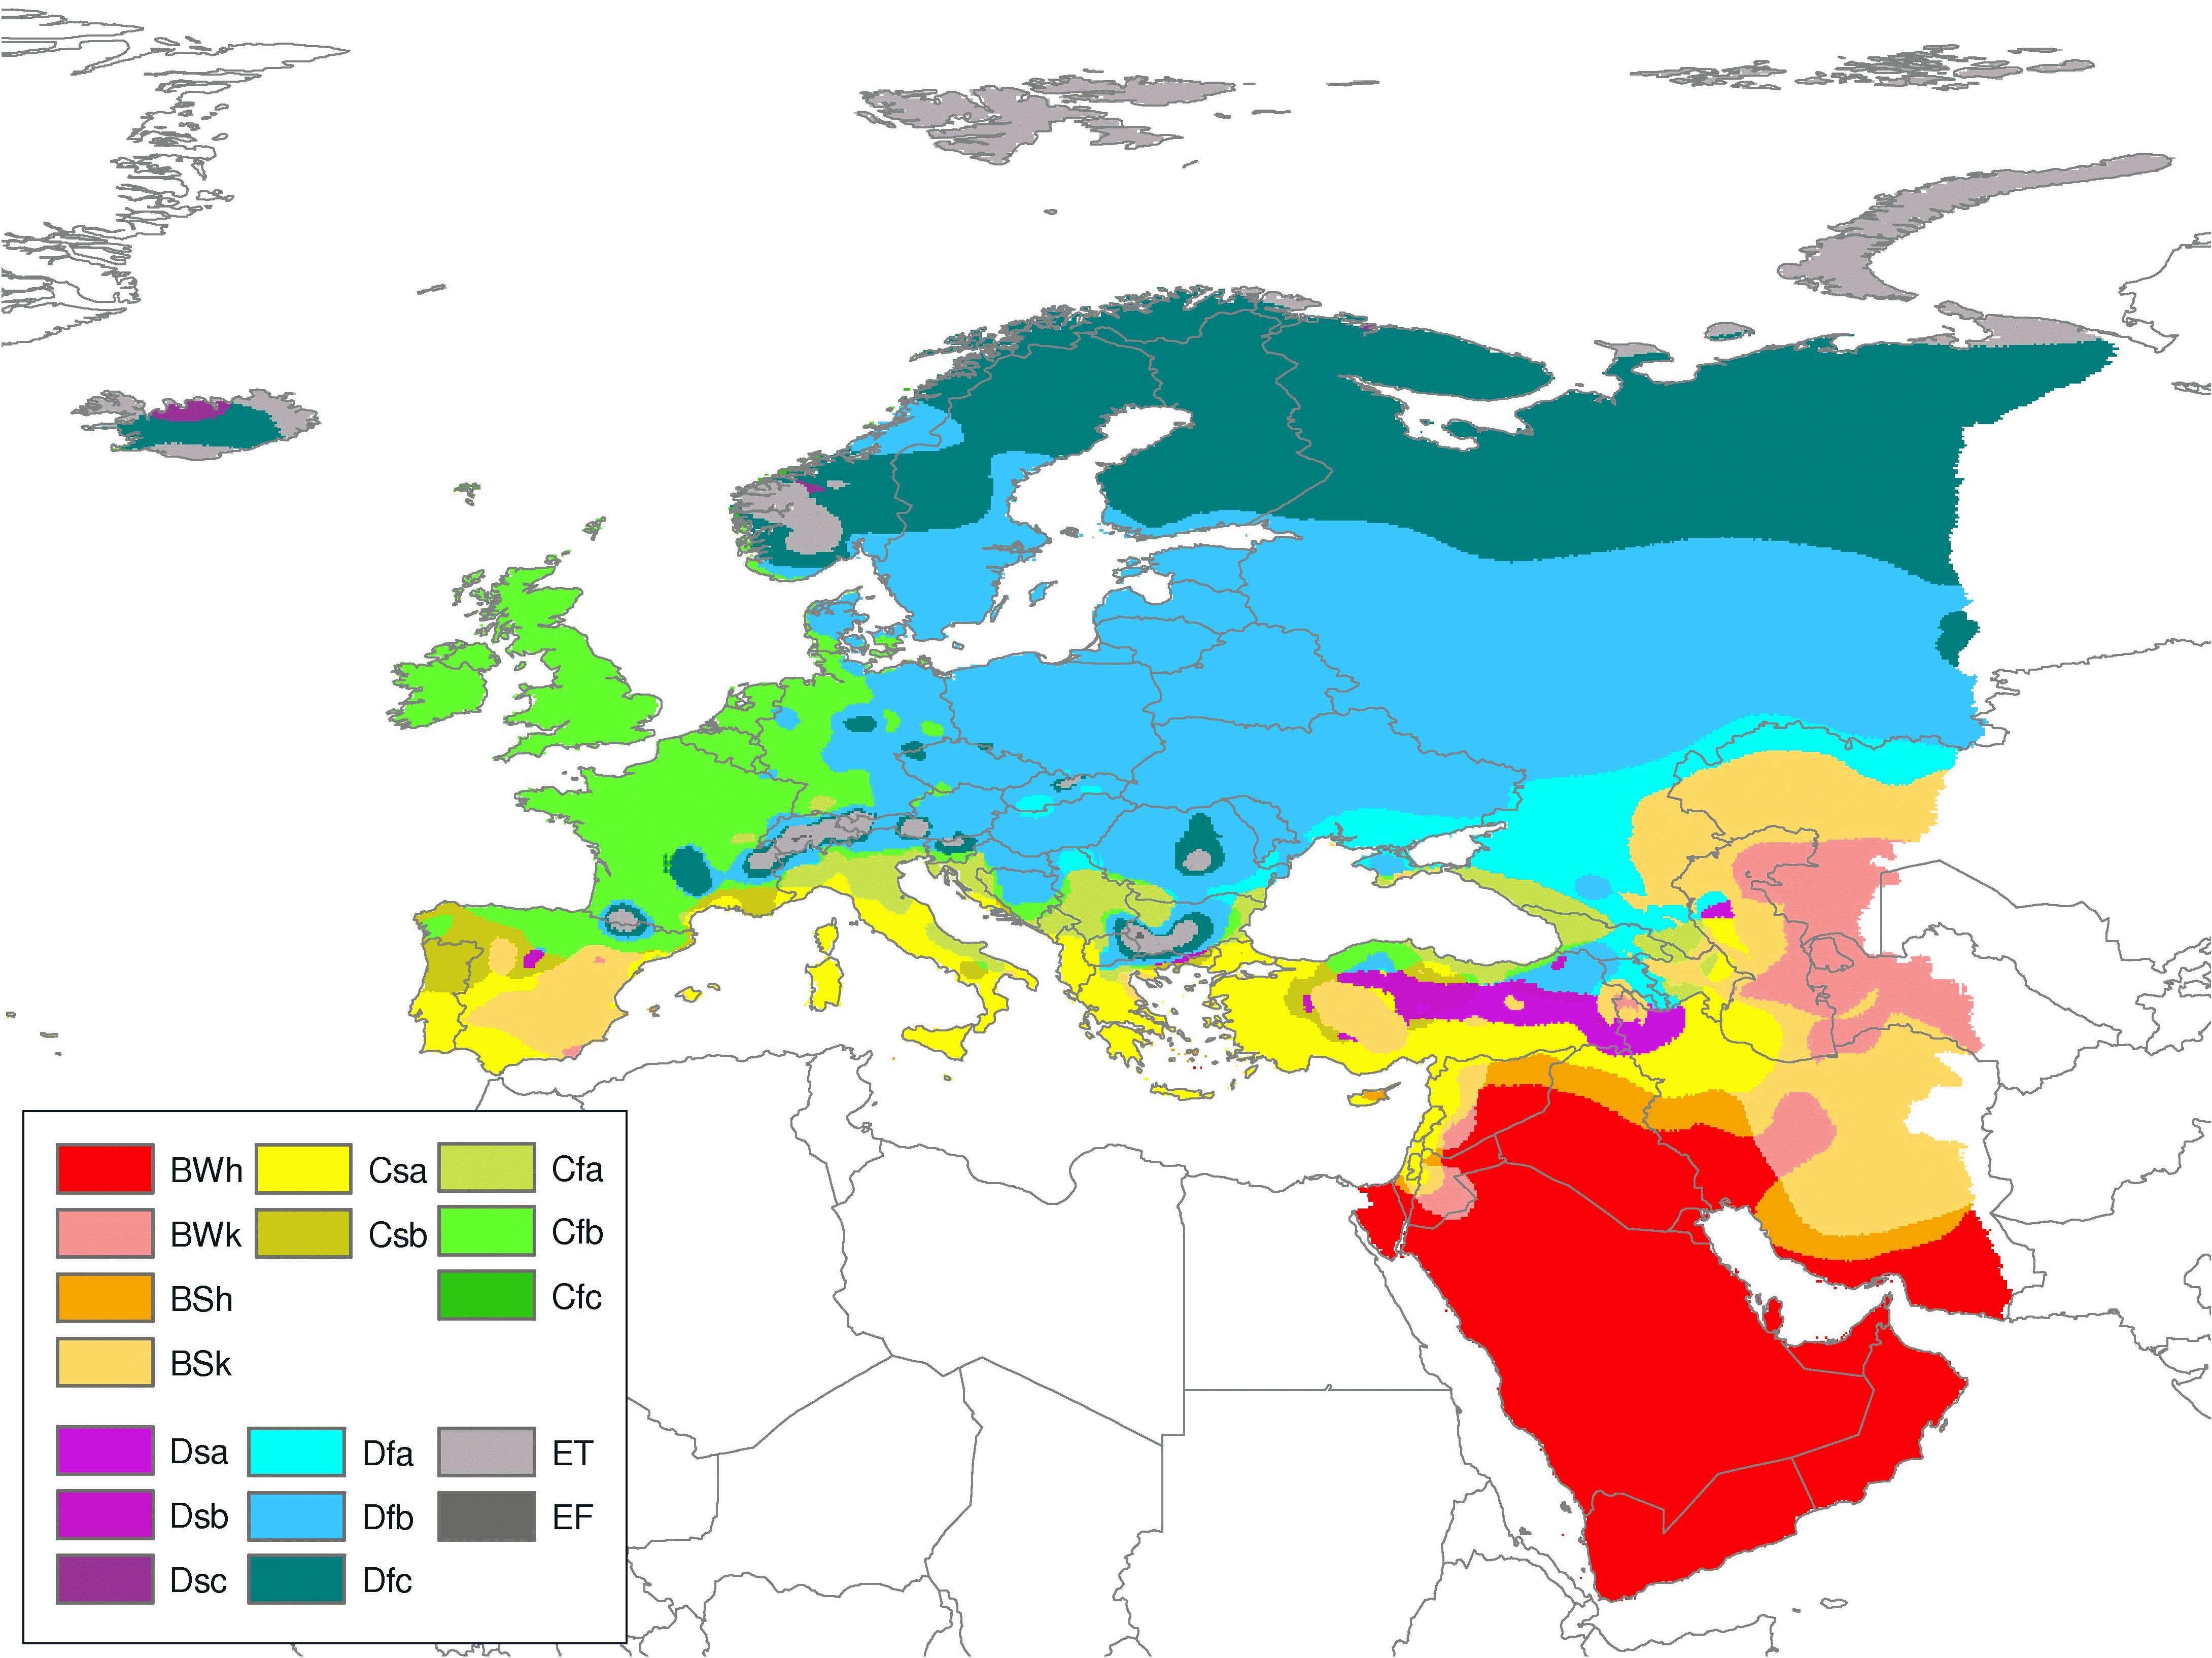
In Köppen climate classification Finland belongs to the Df group (continental subarctic or boreal climates). The southern coast is Dfb (humid continental mild summer, wet all year), and the rest of the country is Dfc (subarctic with cool summer, wet all year). [2] [3]
The climate of Finland has characteristics of both maritime and continental climate. The Atlantic Ocean to the west and the Eurasian continent to the east interact to modify the climate of the country. The warm waters of the Gulf Stream and the North Atlantic Drift Current, which continuously warm the region, play a big role in the climate of Norway, Sweden and Finland; if it weren't for these currents, the winters in Scandinavia and Fennoscandia would be much colder. Westerly winds bring the warm air currents into the Baltic areas and to the country's shores, moderating winter temperatures, especially in the south and southwest in cities like Helsinki and Turku where winter highs tend to be between 0 and 5 °C (32 and 41 °F) but a cold snap like the one that occurred in mid-January 2016 can cause temperatures to plunge well below −20 °C (−4 °F). These winds, because of clouds associated with weather systems accompanying the westerlies, also decrease the amount of sunshine received during the summer. By contrast, the continental high pressure system situated over the Eurasian continent counteracts the maritime influences, occasionally causing severe winters and high temperatures in the summer.
The warmest annual average temperature in Southwestern Finland is 6.5 °C (43.7 °F). From there the temperature decreases gradually towards north and east. The Suomenselkä and Maanselkä drainage divides rise higher than the surrounding areas, and the climate there is cooler than at same latitudes elsewhere in Finland. [4] The Barents Sea between Finland and the North Pole is open even in winter, so northerly airflows are not as cold as in Siberia or Alaska. [5]
The highest temperature ever recorded is 37.2 °C (99.0 °F) (Liperi, July 29, 2010). [6] The lowest, −51.5 °C (−60.7 °F) (Kittilä, January 28, 1999). The annual average temperature is relatively high in the southwestern part of the country (5.0 to 7.5 °C or 41.0 to 45.5 °F), with quite mild winters and warm summers, and low in the northeastern part of Lapland (Finland) (0 to −4 °C or 32 to 25 °F).
Temperature extremes for every month: [7]
Climate data for Finland | |||||||||||||
---|---|---|---|---|---|---|---|---|---|---|---|---|---|
Month | Jan | Feb | Mar | Apr | May | Jun | Jul | Aug | Sep | Oct | Nov | Dec | Year |
Record high °C (°F) | 10.9 (51.6) | 11.8 (53.2) | 17.5 (63.5) | 25.5 (77.9) | 31.0 (87.8) | 33.8 (92.8) | 37.2 (99.0) | 33.8 (92.8) | 28.8 (83.8) | 21.1 (70.0) | 16.6 (61.9) | 11.3 (52.3) | 37.2 (99.0) |
Record low °C (°F) | −51.5 (−60.7) | −49.0 (−56.2) | −44.3 (−47.7) | −36.0 (−32.8) | −24.6 (−12.3) | −7.7 (18.1) | −5.0 (23.0) | −10.8 (12.6) | −18.7 (−1.7) | −31.8 (−25.2) | −42.0 (−43.6) | −47.0 (−52.6) | −51.5 (−60.7) |
Source: http://ilmatieteenlaitos.fi/lampotilaennatyksia |
Record highs by month | |||
Month | Temp. | Date | Location |
---|---|---|---|
January | +10.9 °C (51.6 °F) | January 6, 1973 | Mariehamn, Åland |
February | +11.8 °C (53.2 °F) | February 28, 1943 | Ilmala, Helsinki, Uusimaa |
March | +17.5 °C (63.5 °F) | March 27, 2007 | Helsinki-Vantaa Airport, Vantaa, Uusimaa |
April | +25.5 °C (77.9 °F) | April 27, 1921 | Jyväskylä, Central Finland |
May | +31.0 °C (87.8 °F) | May 30/31, 1995 | Lapinjärvi, Uusimaa |
June | +33.8 °C (92.8 °F) | June 24, 1934 | Ähtäri, Central Finland |
July | +37.2 °C (99.0 °F) | July 29, 2010 | Joensuu Airport, Liperi, North Karelia [6] |
August | +33.8 °C (92.8 °F) | August 7, 2010 | Heinola, Päijät-Häme, [8] Puumala, South Savo [9] |
August 8, 2010 | Lahti, Päijät-Häme [8] | ||
September | +28.8 °C (83.8 °F) | September 6, 1968 | Rauma, Satakunta |
October | +21.1 °C (70.0 °F) | October 14, 2018 | Oulu Airport, North Ostrobothnia |
November | +16.6 °C (61.9 °F) | November 6, 2020 | Mariehamn Airport, Jomala, Åland [10] |
December | +11.3 °C (52.3 °F) | December 20, 2015 | Pori and Kokemäki, Satakunta [11] |
Record lows by month | |||
Month | Temp. | Date | Location |
---|---|---|---|
January | −51.5 °C (−60.7 °F) | January 28, 1999 | Kittilä, Pokka, Lapland |
February | −49.0 °C (−56.2 °F) | February 5, 1912 | Sodankylä, Lapland |
March | −44.3 °C (−47.7 °F) | March 1, 1971 | Salla, Tuntsa, Lapland |
April | −36.0 °C (−32.8 °F) | April 2/9, 1912 | Kuusamo, Northern Ostrobothnia; Sodankylä, Lapland |
May | −24.6 °C (−12.3 °F) | May 1, 1971 | Enontekiö, Kalmankaltio, Lapland |
June | −7.7 °C (18.1 °F) | June 1, 2023 | Saana, Kilpisjärvi, Enontekiö, Lapland |
July | −5.0 °C (23.0 °F) | July 1/12, 1958 | Enontekiö, Kilpisjärvi, Lapland |
August | −10.8 °C (12.6 °F) | August 26, 1980 | Salla, Naruskajärvi, Lapland |
September | −18.7 °C (−1.7 °F) | September 26, 1968 | Sodankylä, Vuotso, Lapland |
October | −31.8 °C (−25.2 °F) | October 25, 1968 | Sodankylä, Lapland |
November | −42.0 °C (−43.6 °F) | November 30, 1915 | Sodankylä, Lapland |
December | −47.0 °C (−52.6 °F) | December 21, 1919 | Pielisjärvi, North Karelia |
Climate data for Helsinki (1991–2020 normals, records 1900–present) | |||||||||||||
---|---|---|---|---|---|---|---|---|---|---|---|---|---|
Month | Jan | Feb | Mar | Apr | May | Jun | Jul | Aug | Sep | Oct | Nov | Dec | Year |
Record high °C (°F) | 8.5 (47.3) | 10.3 (50.5) | 15.1 (59.2) | 21.9 (71.4) | 27.6 (81.7) | 31.7 (89.1) | 33.2 (91.8) | 31.2 (88.2) | 26.2 (79.2) | 17.6 (63.7) | 13.4 (56.1) | 10.5 (50.9) | 33.2 (91.8) |
Mean daily maximum °C (°F) | −0.7 (30.7) | −1.3 (29.7) | 2.3 (36.1) | 8.1 (46.6) | 14.6 (58.3) | 18.8 (65.8) | 21.9 (71.4) | 20.5 (68.9) | 15.4 (59.7) | 9.2 (48.6) | 4.4 (39.9) | 1.4 (34.5) | 9.6 (49.3) |
Daily mean °C (°F) | −3.1 (26.4) | −3.8 (25.2) | −0.7 (30.7) | 4.4 (39.9) | 10.4 (50.7) | 14.9 (58.8) | 18.1 (64.6) | 16.9 (62.4) | 12.3 (54.1) | 6.6 (43.9) | 2.4 (36.3) | −0.7 (30.7) | 6.5 (43.7) |
Mean daily minimum °C (°F) | −5.6 (21.9) | −6.3 (20.7) | −3.6 (25.5) | 1.1 (34.0) | 6.4 (43.5) | 11.2 (52.2) | 14.5 (58.1) | 13.5 (56.3) | 9.3 (48.7) | 4.2 (39.6) | 0.4 (32.7) | −2.9 (26.8) | 3.5 (38.3) |
Record low °C (°F) | −34.3 (−29.7) | −31.5 (−24.7) | −24.5 (−12.1) | −16.3 (2.7) | −4.8 (23.4) | 0.7 (33.3) | 5.4 (41.7) | 2.8 (37.0) | −4.5 (23.9) | −11.6 (11.1) | −18.6 (−1.5) | −29.5 (−21.1) | −34.3 (−29.7) |
Average precipitation mm (inches) | 53 (2.1) | 38 (1.5) | 34 (1.3) | 34 (1.3) | 38 (1.5) | 60 (2.4) | 57 (2.2) | 81 (3.2) | 56 (2.2) | 73 (2.9) | 69 (2.7) | 58 (2.3) | 653 (25.7) |
Average rainy days (≥ 0.1 mm) | 19 | 16 | 13 | 12 | 11 | 14 | 12 | 13 | 14 | 16 | 17 | 19 | 176 |
Mean monthly sunshine hours | 38 | 70 | 138 | 194 | 284 | 297 | 291 | 238 | 150 | 93 | 36 | 29 | 1,858 |
Average ultraviolet index | 0 | 0 | 1 | 3 | 4 | 5 | 5 | 4 | 3 | 1 | 0 | 0 | 2 |
Source 1: FMI climatological normals for Finland 1991–2020 [14] | |||||||||||||
Source 2: record highs and lows [15] |
Climate data for Tampere (1981–2010 normals, precipitation 1981-2010, extremes 1900–present) | |||||||||||||
---|---|---|---|---|---|---|---|---|---|---|---|---|---|
Month | Jan | Feb | Mar | Apr | May | Jun | Jul | Aug | Sep | Oct | Nov | Dec | Year |
Record high °C (°F) | 8.0 (46.4) | 9.4 (48.9) | 14.9 (58.8) | 24.2 (75.6) | 28.4 (83.1) | 31.7 (89.1) | 33.1 (91.6) | 32.1 (89.8) | 24.8 (76.6) | 18.4 (65.1) | 11.1 (52.0) | 9.6 (49.3) | 33.1 (91.6) |
Mean daily maximum °C (°F) | −3.4 (25.9) | −3.5 (25.7) | 1.2 (34.2) | 8.2 (46.8) | 15.4 (59.7) | 19.5 (67.1) | 22.2 (72.0) | 19.9 (67.8) | 14.0 (57.2) | 7.5 (45.5) | 1.5 (34.7) | −1.9 (28.6) | 8.4 (47.1) |
Daily mean °C (°F) | −6.4 (20.5) | −6.9 (19.6) | −2.8 (27.0) | 3.3 (37.9) | 9.7 (49.5) | 14.1 (57.4) | 16.9 (62.4) | 15.0 (59.0) | 9.8 (49.6) | 4.6 (40.3) | 0.6 (33.1) | −4.5 (23.9) | 4.4 (39.9) |
Mean daily minimum °C (°F) | −9.7 (14.5) | −10.6 (12.9) | −6.6 (20.1) | −1.3 (29.7) | 3.8 (38.8) | 8.6 (47.5) | 11.7 (53.1) | 10.4 (50.7) | 5.9 (42.6) | 1.9 (35.4) | −3.0 (26.6) | −7.6 (18.3) | 0.3 (32.5) |
Record low °C (°F) | −37.0 (−34.6) | −36.8 (−34.2) | −29.6 (−21.3) | −19.6 (−3.3) | −7.3 (18.9) | −2.8 (27.0) | 1.8 (35.2) | −0.4 (31.3) | −6.7 (19.9) | −14.8 (5.4) | −22.5 (−8.5) | −34.2 (−29.6) | −37.0 (−34.6) |
Average precipitation mm (inches) | 41 (1.6) | 29 (1.1) | 31 (1.2) | 32 (1.3) | 41 (1.6) | 66 (2.6) | 75 (3.0) | 72 (2.8) | 58 (2.3) | 60 (2.4) | 51 (2.0) | 42 (1.7) | 598 (23.5) |
Average snowfall cm (inches) | 32.3 (12.7) | 31.4 (12.4) | 29.5 (11.6) | 13.9 (5.5) | 1.6 (0.6) | 0.1 (0.0) | 0 (0) | 0 (0) | 0 (0) | 3.3 (1.3) | 13.1 (5.2) | 27.2 (10.7) | 152.4 (60) |
Average precipitation days (≥ 0.1 mm) | 22 | 18 | 16 | 12 | 12 | 13 | 15 | 15 | 14 | 17 | 21 | 22 | 197 |
Average relative humidity (%) | 90 | 87 | 82 | 70 | 63 | 66 | 69 | 76 | 82 | 87 | 91 | 92 | 80 |
Source 1: weatheronline.co.uk [16] | |||||||||||||
Source 2: FMI (precipitation, record highs and lows) [17] |
Climate data for Turku (1991-2020 normals, extremes 1900-present) | |||||||||||||
---|---|---|---|---|---|---|---|---|---|---|---|---|---|
Month | Jan | Feb | Mar | Apr | May | Jun | Jul | Aug | Sep | Oct | Nov | Dec | Year |
Record high °C (°F) | 8.5 (47.3) | 10.2 (50.4) | 15.8 (60.4) | 24.5 (76.1) | 30.0 (86.0) | 32.0 (89.6) | 35.9 (96.6) | 32.6 (90.7) | 27.8 (82.0) | 18.9 (66.0) | 14.0 (57.2) | 11.0 (51.8) | 35.9 (96.6) |
Mean daily maximum °C (°F) | −1.1 (30.0) | −1.2 (29.8) | 2.6 (36.7) | 9.1 (48.4) | 15.5 (59.9) | 19.5 (67.1) | 22.6 (72.7) | 21.1 (70.0) | 15.7 (60.3) | 8.8 (47.8) | 3.6 (38.5) | 0.7 (33.3) | 9.7 (49.5) |
Daily mean °C (°F) | −3.8 (25.2) | −4.5 (23.9) | −1.3 (29.7) | 4.1 (39.4) | 10.0 (50.0) | 14.4 (57.9) | 17.5 (63.5) | 16.2 (61.2) | 11.3 (52.3) | 5.7 (42.3) | 1.5 (34.7) | −1.5 (29.3) | 5.8 (42.5) |
Mean daily minimum °C (°F) | −6.5 (20.3) | −7.1 (19.2) | −4.7 (23.5) | −0.2 (31.6) | 4.6 (40.3) | 9.3 (48.7) | 12.5 (54.5) | 11.6 (52.9) | 7.4 (45.3) | 2.8 (37.0) | −0.9 (30.4) | −4.1 (24.6) | 2.1 (35.8) |
Record low °C (°F) | −35.5 (−31.9) | −35.2 (−31.4) | −32.8 (−27.0) | −21.0 (−5.8) | −6.6 (20.1) | −2.2 (28.0) | 1.8 (35.2) | 0.2 (32.4) | −6.9 (19.6) | −15.0 (5.0) | −22.3 (−8.1) | −33.8 (−28.8) | −35.5 (−31.9) |
Average precipitation mm (inches) | 58 (2.3) | 42 (1.7) | 39 (1.5) | 32 (1.3) | 35 (1.4) | 55 (2.2) | 74 (2.9) | 73 (2.9) | 59 (2.3) | 73 (2.9) | 71 (2.8) | 73 (2.9) | 684 (27.1) |
Average precipitation days | 11 | 9 | 8 | 7 | 7 | 8 | 8 | 10 | 9 | 11 | 13 | 12 | 113 |
Mean monthly sunshine hours | 40 | 75 | 134 | 204 | 284 | 276 | 287 | 230 | 155 | 89 | 38 | 27 | 1,839 |
Source: Climatological statistics for the normal period 1991–2020 [18] |
Climate data for Oulu (1991-2020 normals, records 1921 - present) | |||||||||||||
---|---|---|---|---|---|---|---|---|---|---|---|---|---|
Month | Jan | Feb | Mar | Apr | May | Jun | Jul | Aug | Sep | Oct | Nov | Dec | Year |
Record high °C (°F) | 9.3 (48.7) | 7.8 (46.0) | 11.5 (52.7) | 23.9 (75.0) | 29.9 (85.8) | 32.3 (90.1) | 33.3 (91.9) | 30.5 (86.9) | 25.4 (77.7) | 21.1 (70.0) | 11.2 (52.2) | 8.2 (46.8) | 33.3 (91.9) |
Mean daily maximum °C (°F) | −4.8 (23.4) | −4.7 (23.5) | −0.4 (31.3) | 5.8 (42.4) | 12.6 (54.7) | 17.9 (64.2) | 21.1 (70.0) | 18.9 (66.0) | 13.2 (55.8) | 5.8 (42.4) | 0.5 (32.9) | −2.7 (27.1) | 6.9 (44.5) |
Daily mean °C (°F) | −8.2 (17.2) | −8.4 (16.9) | −4.4 (24.1) | 1.6 (34.9) | 8.0 (46.4) | 13.7 (56.7) | 16.7 (62.1) | 14.6 (58.3) | 9.6 (49.3) | 3.3 (37.9) | −1.6 (29.1) | −5.3 (22.5) | 3.3 (38.0) |
Mean daily minimum °C (°F) | −11.9 (10.6) | −12.1 (10.2) | −8.3 (17.1) | −2.5 (27.5) | 3.4 (38.1) | 9.3 (48.7) | 12.4 (54.3) | 10.6 (51.1) | 6.0 (42.8) | 0.6 (33.1) | −4.2 (24.4) | −8.8 (16.2) | −0.5 (31.2) |
Record low °C (°F) | −37.5 (−35.5) | −41.5 (−42.7) | −32 (−26) | −21.4 (−6.5) | −9.1 (15.6) | −6.1 (21.0) | 3.6 (38.5) | −1.5 (29.3) | −8.0 (17.6) | −20.6 (−5.1) | −33 (−27) | −37.2 (−35.0) | −41.5 (−42.7) |
Average precipitation mm (inches) | 32 (1.3) | 29 (1.1) | 26 (1.0) | 23 (0.9) | 40 (1.6) | 51 (2.0) | 80 (3.1) | 62 (2.4) | 49 (1.9) | 51 (2.0) | 43 (1.7) | 39 (1.5) | 525 (20.5) |
Average snowfall cm (inches) | 33 (13) | 46 (18) | 43 (17) | 7 (2.8) | — | — | — | — | — | — | 4 (1.6) | 17 (6.7) | 150 (59) |
Average precipitation days | 9 | 8 | 7 | 6 | 8 | 8 | 10 | 10 | 8 | 10 | 10 | 10 | 104 |
Average relative humidity (%) (daily average) | 87 | 86 | 82 | 73 | 67 | 66 | 71 | 76 | 82 | 86 | 90 | 89 | 80 |
Mean monthly sunshine hours | 24 | 69 | 137 | 208 | 273 | 296 | 283 | 212 | 133 | 69 | 28 | 8 | 1,740 |
Average ultraviolet index | 0 | 0 | 1 | 2 | 3 | 4 | 4 | 3 | 2 | 1 | 0 | 0 | 2 |
Source 1: FMI [19] | |||||||||||||
Source 2: FMI (record highs and lows 1961–present) [20] FMI(record highs and lows 1921–1961) [21] Source 3: Finland. Oulu climate (average monthly UV index) [22] |
The most common wind direction in Finland is from southwest, but the low pressure areas typical for these latitudes cause great variations in wind speed and direction. [1]
Storm, defined as at least one Finnish coastal station reporting at least 21 m/s as a 10-minutes average wind speed, is observed on Finnish seas on average 19 days a year. Strong winds are most frequent between October and January. [23]
The first snow cover is observed on average in September in Lapland, and in November in Southern and western areas. Permanent snow cover time starts typically around Christmas in the Southwestern corner, but before mid-November in most of Lapland. The maximum snow depth is usually found around March. [24]
Snow and supercooled droplets can accumulate in tree crowns and cause damage to trees. The trunks of pine trees can break under the weight of a snow-loaded crown, and deciduous trees can bend permanently. The snow load of a tree is typically 100–150 kg per one meter tree trunk, but the heaviest measured snow load of a spruce was over 3000 kilograms. [25]
Snowmelt contributes to spring floods. In north, the peak flow of rivers always happens in spring, in the south 70–80% of floods happen in spring. In the south, maximum flow happens in mid-April, in the north, in mid-May. [26]
It is predicted that as the Barents Sea gets less frozen in the coming winters and it becomes thus "Atlantified" additional evaporation will increase future snowfalls in Finland and much of continental Europe. [27]
The geography of Finland is characterized by its northern position, its ubiquitous landscapes of intermingled boreal forests and lakes, and its low population density. Finland can be divided into three areas: archipelagoes and coastal lowlands, a slightly higher central lake plateau and uplands to north and northeast. Bordering the Baltic Sea, Gulf of Bothnia, and Gulf of Finland, as well as Sweden, Norway, and Russia, Finland is the northernmost country in the European Union. Most of the population and agricultural resources are concentrated in the south. Northern and eastern Finland are sparsely populated containing vast wilderness areas. Taiga forest is the dominant vegetation type.
Sweden is a country in Northern Europe on the Scandinavian Peninsula. It borders Norway to the west; Finland to the northeast; and the Baltic Sea and Gulf of Bothnia to the south and east. At 450,295 km2 (173,860 sq mi), Sweden is the largest country in Northern Europe, the fifth largest in Europe, and the 55th largest country in the world.
Lapland is the largest and northernmost region of Finland. The 21 municipalities in the region cooperate in a Regional Council. Lapland borders the region of North Ostrobothnia in the south. It also borders the Gulf of Bothnia, Norrbotten County in Sweden, Troms and Finnmark County in Norway, and Murmansk Oblast and the Republic of Karelia in Russia. Topography varies from vast mires and forests of the South to fells in the North. The Arctic Circle crosses Lapland, so polar phenomena such as the midnight sun and polar night can be viewed in Lapland.
Inari is Finland's largest municipality by area, with four official languages, more than any other in the country. Its major sources of income are tourism, service industry and cold climate testing. With the Siida museum in the village of Inari, it is a center of Sami culture, widely known as the "capital of Sámi culture".
Utsjoki is a municipality in Finland, the northernmost in the country. It is in Lapland and borders Norway as well as the municipality of Inari. The municipality was founded in 1876. It has a population of 1,158 (30 September 2023) and covers an area of 5,372.00 square kilometres (2,074.14 sq mi) of which 227.51 km2 (87.84 sq mi) is water. The population density is 0.22 inhabitants per square kilometre (0.57/sq mi).
Lieksa is a town and municipality of Finland. It is located in the North Karelia region. The municipality has a population of 10,246 and covers an area of 4,067.60 square kilometres (1,570.51 sq mi) of which 649.14 km2 (250.63 sq mi) is water. The population density is 3 inhabitants per square kilometre (7.8/sq mi).
Sodankylä is a municipality of Finland. It is located in the region of Lapland, and lies at the northern end of Highway 5 (E63) and along Highway 4 (E75). The Kitinen River flows near the center of Sodankylä. Its neighbouring municipalities are Inari, Kemijärvi, Kittilä, Pelkosenniemi, Rovaniemi, and Savukoski. The municipality has two official languages: Finnish and Northern Sami.
Utö is a small island in the Archipelago Sea in the Baltic sea and belongs to Finland's Pargas municipality. It is the southernmost year-round inhabited island in Finland. Utö has an area of 0.81 square kilometres and the population was c. 40.
The Bothnian Bay or Bay of Bothnia is the northernmost part of the Gulf of Bothnia, which is in turn the northern part of the Baltic Sea. The land holding the bay is still rising after the weight of ice-age glaciers has been removed, and within 2,000 years the bay will be a large freshwater lake since its link to the south Kvarken is mostly less than 20 metres (66 ft) deep. The bay today is fed by several large rivers, and is relatively unaffected by tides, so has low salinity. It freezes each year for up to six months. Compared to other parts of the Baltic it has little plant or animal life.
The climate of the city of Sydney, Australia is humid subtropical, shifting from mild and cool in winter to warm and hot in the summer, with no extreme seasonal differences as the weather is moderated by proximity to the ocean, although more contrasting temperatures are recorded in the inland western suburbs. Despite the fact that there is no distinct dry or wet season, rainfall peaks in the first few months of the year and is at its lowest just around the middle of the year, though precipitation can be erratic throughout the year. Precipitation varies across the region, with areas adjacent to the coast being the wettest. According to the Bureau of Meteorology, Sydney falls in the temperate climate zone which has warm to hot summers and no dry season. Sydney's plant hardiness zone ranges from zone 11a to 9b throughout the metropolitan area. Under the Holdridge Life Zones classification, eastern Sydney falls in the Subtropical Moist Forest zone and the western suburbs in the Subtropical Dry Forest zone.
Joensuu Airport is an airport in Liperi, Finland, about 11 kilometres (7 mi) northwest of the city centre of Joensuu.
The climate of Italy is the long-term weather pattern in the territory of the Italian Republic. The climate of Italy is influenced by the large body of water of the Mediterranean Seas that surrounds Italy on every side except the north. These seas constitute a reservoir of heat and humidity for Italy. Within the southern temperate zone, they determine a particular climate called Mediterranean climate with local differences due to the geomorphology of the territory, which tends to make its mitigating effects felt, especially in high pressure conditions.
Albania has a variety of climate systems. With its coastline facing the Adriatic and Ionian seas in the Mediterranean sea, its highlands backed upon the elevated Balkan landmass, and the entire country lying at a latitude subject to a variety of weather patterns during the winter and summer seasons, however it has a high number of climatic regions for such a small area. The coastal lowlands have typically mediterranean climate while the highlands have a continental climate. In both the lowlands and the interior, the weather varies markedly from north to south.
Kosovo is a relatively small country. Because of the climatic position and complicated structure of the relief it has a variety of climate systems.
The climate of New Zealand is varied due to the country's diverse landscape. Most regions of New Zealand belong to the temperate zone with a maritime climate characterised by four distinct seasons. Winters are relatively mild and summers comparatively cool. The main contributing factors are the Pacific Ocean and latitude, although the mountain ranges can cause significant climate variations in locations barely tens of kilometres from each other. Conditions vary from extremely wet on the West Coast of the South Island to almost semi-arid in Central Otago and subtropical in Northland.
The climate of Norway is more temperate than could be expected for such high latitudes. This is mainly due to the North Atlantic Current with its extension, the Norwegian Current, raising the air temperature; the prevailing southwesterlies bringing mild air onshore; and the general southwest–northeast orientation of the coast, which allows the westerlies to penetrate into the Arctic. The January average in Brønnøysund is 15.8C (28.6F) higher than the January average in Nome, Alaska, even though both towns are situated on the west coast of the continents at 65°N. In July the difference is reduced to 3.2C (5.8F). The January average of Yakutsk, in Siberia but slightly further south, is 42.3C (76.1F) lower than in Brønnøysund.
Most of Sweden has a temperate climate, despite its northern latitude, with largely four distinct seasons and mild temperatures throughout the year. The winter in the far south is usually weak and is manifested only through some shorter periods with snow and sub-zero temperatures, autumn may well turn into spring there, without a distinct period of winter. The northern parts of the country have a subarctic climate while the central parts have a humid continental climate. The coastal south can be defined as having either a humid continental climate using the 0 °C isotherm, or an oceanic climate using the –3 °C isotherm.
Cyprus has a subtropical climate - Mediterranean and semi-arid type - according to Köppen climate classification signes Csa and BSh, with very mild winters and warm to hot summers. Snow is possible only in the Troodos mountains in the central part of the island. Rain occurs mainly in winter, with summer being generally dry.
Climate change has far reaching impacts on the natural environment and people of Finland. Finland was among the top five greenhouse gas emitters in 2001, on a per capita basis. Emissions increased to 58.8 million tonnes in 2016. Finland needs to triple its current cuts to emissions in order to be carbon neutral by 2035. Finland relies on coal and peat for its energy, but plans to phase out coal by 2029. Finland has a target of carbon neutrality by the year 2035 without carbon credits. The policies include nature conservation, more investments in trains, changes in taxation and more sustainable wood burning. After 2035 Finland will be carbon negative, meaning soaking more carbon than emitting.
Vaasa, in the years 1855–1917 as Nikolainkaupunki, is a city on the west coast of Finland. It received its charter in 1606, during the reign of Charles IX of Sweden and is named after the Royal House of Vasa. Vaasa has a population of 68,880, and is the regional capital of Ostrobothnia. Vaasa is also well known as a major university and college city in Finland.