Crime in Canada is generally considered low overall. Under the Canadian constitution, the power to establish criminal law and rules of investigation is vested in the federal Parliament. The provinces share responsibility for law enforcement (although provincial policing in many jurisdictions is contracted to the federal Royal Canadian Mounted Police), and while the power to prosecute criminal offences is assigned to the federal government, responsibility for prosecutions is delegated to the provinces for most types of criminal offences. Laws and sentencing guidelines are uniform throughout the country, but provinces vary in their level of enforcement.[2]
According to the latest report of Statistics Canada, overall crime in Canada has been steadily declining since the late 1990s as measured by the Crime Severity Index (CSI) and the Violent Crime Severity Index (VCSI), with a more recent uptick since an all-time low in 2014.[3] Both measures of crime saw an 8 to 10 percent decrease between 2010 and 2018.[3] Violent crime, specifically homicide, has declined in Canada by over 40% since its peak in 1975, placing Canada 79th in the world by homicide rate—far worse than Australia, England, and Ireland, and relatively close to poorer European countries. It is tied for first in the Americas with Chile (homicide rates are 2.7 times lower than in the United States). Current crimes that are increasing include drug-related offences, fraud, sexual assault and theft, with fraud increasing 46% between 2008 and 2018.[4]
Statistics Canada data
Crime rates in Canada were reported at 5,334 incidents per 100,000 inhabitants with violent crime at 1,098 incidents and property crime at 3,245 incidents (per 100,000).[5] The province or territory with the lowest crime rate in 2017 was Quebec with 3,359 incidents per 100,000 followed by Ontario with 3,804 incidents per 100,000. The province or territory with the highest crime rate for 2017 was Nunavut with 34,948 incidents per 100,000. Overall crime decreased 23% between 2007 and 2017 with all provinces experiencing a decrease in crime (up to 34%) with the exception of Yukon which saw no decrease and Nunavut which saw an increase. Violent crime was lowest in Prince Edward Island followed by Ontario and Quebec. [5] The three northern territories have higher per capita crime rates than any province.
Canada homicide rate year-by-year
Canada's homicide rate per capita (per 100,000) inhabitants has been declining since a peak in the 1970s. After dropping to a low point of 1.44 homicides per 100,000 inhabitants in 2013, Canada's homicide rate has been rising again.[6] In 2015 the rate rose to 1.68 per 100,000 people, up from 1.47 the previous year.[7] According to Statistics Canada data from 2016, police reported 611 homicides across Canada in 2016, a rate of 1.68 per 100,000 people.[8] Canada's national homicide rate 2017 was the highest it's been in a decade, Statistics Canada says, because of a spike in gang-related violence and shootings. The agency said there were 660 reported homicides in Canada last year. Not only was that an increase of nearly eight per cent from 2016, it also pushed up the homicide rate to 1.8 victims for every 100,000 people, the highest since 2009.[9] The agency also said the rates of other serious offences, including attempted murder, sexual assault, robbery and aggravated assault were all up last year, as was the use of guns in violent crimes.[9]
Police reported criminal violence is non-existent. Thus, approximately every five years, Statistics Canada conducts a survey of victimization in Canada. The last General Social Survey conducted was in 2004, where 24,000 people were contacted by telephone: 106 reported incidents of violence per 1,000 polled, which is slightly lower than in 1999 when it was 111 per 1,000 polled.[10] In 2007, the number of murders dropped to 594, 12 fewer than the previous year. One-third of the 2007 murders were stabbings and another third were by firearm. In 2007, there were 190 stabbings and 188 shootings. Handguns were used in two-thirds of all firearm murders. Seventy-four youths were accused of murder, down 11 from the previous year. About eighty-four percent of murders were done by someone known to the victim. Male victims of homicide were most likely to be killed by an acquaintance, someone known to them through a criminal relationship, or a stranger. Female victims of homicide were most frequently killed by a current or former intimate partner, or another family member. The province with the highest crime rate was Manitoba while the lowest crime rates occurred in Prince Edward Island and Newfoundland and Labrador.
Police reported that the number of hate crimes in Canada dropped to 1,798 in 2018 compared to 2,073 in 2017 as per the Uniform Crime Reporting (UCR) Survey. However, the number is still higher than the previous years when there were 1,409 in 2016, 1,362 in 2015 and 1,295 in 2014. Religion continues to be the leading motivation and cause for the hate crimes (37%) in Canada according to the survey conducted by the Canadian Centre for Justice Statistics (CCJS).[11]
Crime by region
Violent crime severity index by census metropolitan area
Crime statistics vary considerably through different parts of Canada. In general, the eastern provinces have the lowest violent crime rates while the western provinces have higher rates and the territories higher still. Of the provinces, Manitoba and Saskatchewan have the highest violent crime rates. The chart below also shows that Saskatchewan has the highest provincial assault rate, and that Manitoba has the highest provincial sexual assault rate, robbery rate and homicide rate of any Canadian province. In many instances the crime rates in the Yukon, North West Territories and Nunavut are the highest in the country and can be up to ten times the national average.
2020 crime statistics for the provinces and territories are given below, as reported by Statistics Canada.[20]
Crime Rates (per 100,000 residents) by Canadian Provinces & Territories (sortable by province)[20]
Province/Territory
Total of all violations
Violent Criminal Code violations (total)
Homicide
Attempted murder
Sexual assault (not including against children)
Sexual violations against children
Assault (not including against a police officer)
Assaults against a police officer
Discharge firearm with intent
Robbery
Forcible confinement or kidnapping
Extortion
Criminal harassment
Uttering threats
Indecent/Harassing communications
Other violent violations
Property crime violations (total)
Breaking and entering
Theft of motor vehicle
Theft over $5000 (non-motor vehicle)
Theft under $5000 (non-motor vehicle)
Fraud
Identity theft and identity fraud
Mischief
Other property crime violations
Other Criminal Code violations (total)
Child pornography (including making and distributing)
Disturb the peace
Administration of justice violations
Other Criminal Code violations (all other violations)
Map of police per 100,000 population across Canada, 2012:
< 176
176-200
201-300
301-400
> 400
In 2005, there were 61,050 police officers in Canada which equates to one police officer per 528.6 persons, but with significant regional variations.[22]Newfoundland and Labrador and Prince Edward Island have the fewest police per capita with 664.9 and 648.4 persons per police officer, respectively. Conversely, the highest ratio of police to population is found in Canada's northern territories; Nunavut has 247.9 persons per police officer, the Northwest Territories has 248.5 persons per officer and the Yukon has 258.2 persons for each police officer.[23]
That is a substantially lower rate than most developed countries with only Japan and Sweden having so few police officers. The United States has one officer per 411.5 persons, and Germany 344.8.
Canada's national police force is the Royal Canadian Mounted Police (RCMP) which is the main police force in Canada's north, and in rural areas except in Quebec, Ontario, and Newfoundland. Those three provinces have their own provincial police forces, although the RCMP still operate throughout rural Newfoundland and also provide specific federal policing services in Ontario and Quebec. Many cities and districts have their own municipal police forces, while others have contracts with the provincial police or RCMP to police their communities.
Report rates of crimes
A publication posted on Statistics Canada reported that in 2009, only a small portion of crimes that happen are reported to the police (31% of all crimes), and this figure has been lowering from 1999 (37%) and 2004 (34%).[24] Only 54% of break and enters, 43% of robberies, and 34% of assaults are reported to the police.[25] The most common reason for not reporting a crime was the victim thought it was not important enough (68%). Other common reasons include; they think the police cannot do anything about it (59%), or they dealt with it another way (42%). Multiple reasons are given so the percentages do not sum to 100%.
In 2001, Canada had about 32,000 people in prison or about 0.13% of the total population. Globally, the United States was the country with the highest percentage of inmate population (about 0.7% of the total population). The European average is 0.2% of the total population, with France and Germany having lower rates than Canada, but with the United Kingdom, Spain and most of Eastern Europe having higher ones.[citation needed]
Comparisons
Comparing crime rates between countries is difficult due to the differences in jurisprudence, reporting and crime classifications. National crime statistics are in reality statistics of only selected crime types. Data are collected through various surveying methods that have previously ranged between 15% and 100% coverage of the data. A 2001 Statistics Canada study concluded that comparisons with the U.S. on homicide rates were the most reliable. Comparison of rates for six lesser incident crimes was considered possible but subject to more difficulty of interpretation. For example, types of assaults receive different classifications and laws in Canada and the U.S., making comparisons more difficult than homicides. At the time, the U.S. crime of aggravated assault could be compared to the sum of three Canadian crimes (aggravated assault, assault with a weapon, and attempted murder). This comparison had a predicted bias that would inflate the Canadian numbers by only 0.1%. The study also concluded that directly comparing the two countries' reported total crime rate (i.e. total selected crimes) was "inappropriate" since the totals include the problem data sets as well as the usable sets.[27] For reasons like these, homicides have been favored in international studies looking for predictors of crime rates (predictors like economic inequality).
Crime Comparison Between Selected Countries (Reported crimes per 100 000 population)
Much study has been done of the comparative experience and policies of Canada with its southern neighbour the United States, and this is a topic of intense discussion within Canada.
Historically, the violent crime rate in Canada is far lower than that of the U.S. and this continues to be the case. For example, in 2000 the United States' rate for robberies was 65 percent higher, its rate for aggravated assault was more than double, and its murder rate was triple that of Canada. However, the rate of some property crime types is lower in the U.S. than in Canada. For example, in 2006, the rates of vehicle theft were 22% higher in Canada than in the U.S.[45]
Furthermore, in recent years,[when?] the gap in violent crime rates between the United States and Canada has narrowed due to a precipitous drop in the violent crime rate in the U.S. For example, while the aggravated assault rate declined for most of the 1990s in the U.S. and was 324 per 100,000 in 2000, the aggravated assault rate in Canada remained relatively steady throughout and was 143 per 100,000 in 2000. In other areas, the U.S. had a faster decline. For instance, whereas the murder rate in Canada declined by 36% between 1991 and 2004, the U.S. murder rate declined by 44%. [46]
The homicide rate in Canada peaked in 1975 at 3.03 per 100,000 and has dropped since then; it reached lower peaks in 1985 (2.72) and 1991 (2.69). It reached a post-1970 low of 1.73 in 2003. The average murder rate between 1970 and 1976 was 2.52, between 1977 and 1983 it was 2.67, between 1984 and 1990 it was 2.41, between 1991 and 1997 it was 2.23 and between 1998 and 2004 it was 1.82.[47] The attempted homicide rate has fallen at a faster rate than the homicide rate.[48]
By comparison, the homicide rate in the U.S. reached 10.1 per 100,000 in 1974, peaked in 1980 at 10.7 and reached a lower peak in 1991 (10.5). The average murder rate between 1970 and 1976 was 9.4, between 1977 and 1983 it was 9.6, between 1984 and 1990 it was 9, between 1991 and 1997 it was 9.2 and between 1998 and 2004 it was 6.3. In 2004, the murder rate in the U.S. dipped below 6 per 100,000, for the first time since 1966, and as of 2010 stood at 4.8 per 100,000 [46]
In more recent years, the U.S. as a country still typically has higher violent crimes rates. In 2012, the homicide rate in the U.S. was 4.7 per 100,000 residents,[49] Canada's was 3 times lower at 1.6.[28] However the chances of being murdered at random are extremely low in both countries. In Canada, only 15% of murders are committed by strangers,[50] in the U.S. this number is very similar at 14%,[51] meaning in 50 years your chance of being murdered at random is 0.000128% in Canada,[52] in the U.S. it is 0.000329% (of course these numbers would vary by neighborhoods within each country). Certain methods of homicide are used more frequently in each country; in Canada (0.59),[53] stabbing homicides occur 51.3% more often than in the U.S. (0.39),[54] however firearm homicides occur 440% more in the U.S. (2.7) than in Canada (0.5). In the U.S., you are 3 times more likely to die being shot (17.4%) than being stabbed (5.3%).[55]
Beyond homicides, the U.S. (112.9) has a higher robbery rate - 42.2% higher than Canada (79.4). Other violent crimes such as physical assaults or sexual assaults are not very comparable between the countries because of different definitions of the crimes. The disparity in property crime is not as large, however it still exists. The burglary/break-in rate in the U.S. (670.2) is 33.1% higher than in Canada (503.7), the theft rate in the U.S. (1959.3) is 33.4% higher than in Canada (1468.4), and the auto-theft rate in the U.S. (229.7) is slightly higher than the rate in Canada (223.5).
During the first eight months of the COVID-19 pandemic, criminal incidents fell 18% in Canada.[56] In contrast, crime has surged in the U.S., "a trend mirrored across the country."[57] For example, in 2020 murders were up 36 percent in L.A. and nearly 45 in New York. The New York Times noted that "[e]ven smaller cities [hadn't] been spared the rise in violence: Louisville last year set a record for homicides, with 173, and [2021] is on pace to surpass that."[57]
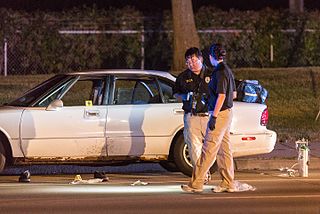
A violent crime, violent felony, crime of violence or crime of a violent nature is a crime in which an offender or perpetrator uses or threatens to use harmful force upon a victim. This entails both crimes in which the violent act is the objective, such as murder, assault, rape and assassination, as well as crimes in which violence is used as a method of coercion or show of force, such as robbery, extortion and terrorism. Violent crimes may, or may not, be committed with weapons. Depending on the jurisdiction, violent crimes may be regarded with varying severities from homicide to harassment. There have been many theories regarding heat being the cause of an increase in violent crime. Theorists claim that violent crime is persistent during the summer due to the heat, further causing people to become aggressive and commit more violent crime.
Crime in Australia is managed by various law enforcement bodies, the federal and state-based criminal justice systems and state-based correctional services.
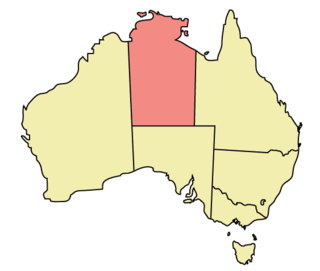
Crime in the Northern Territory is managed by the Northern Territory Police, the territory government's Department of the Attorney-General and Justice and Territory Families.
Crime in St. Louis includes an overview of crime both in the city of St. Louis and in the Greater St. Louis metropolitan area. Crime in the city increased from the 1960s through the early 1990s as measured by the index crime rate. Despite decreasing crime, rates of violent crime and property crime in both the city and the metropolitan area remain higher than the national metropolitan area average. In addition, the city of St. Louis consistently has been ranked among the most dangerous cities in the United States. As of April 2017, St. Louis has the highest murder rate in America. At the end of 2017, St. Louis metropolitan had 205 murders, 159 of which were within the city limits. In 2018, the new Chief of Police, John Hayden said two-thirds (67%) of all the murders and one-half of all the assaults are concentrated in a triangular area in the north part of the city.
The municipal government of Winnipeg is represented by 15 city councillors and a mayor elected every four years.
Crime has been recorded in the United States since its founding and has fluctuated significantly over time, with a sharp rise after 1900 and reaching a broad bulging peak between the 1970s and early 1990s. After 1992, crime rates have generally trended downwards each year, with the exceptions of a slight increase in property crimes in 2001 and increases in violent crimes in 2005-2006, 2014-2016 and 2020-2021. While official federal crime data beginning in 2021 has a wide margin of error due to the incomplete adoption of the National Incident-Based Reporting System by government agencies, federal data for 2020-2021 and limited data from select U.S. cities collected by the nonpartisan Council on Criminal Justice showed significantly elevated rates of homicide and motor vehicle theft in 2020-2022. Although overall crime rates have fallen far below the peak of crime seen in the United States during the late 1980s and early 1990s, the homicide rate in the U.S. has remained high, relative to other "high income"/developed nations, with eight major U.S. cities ranked among the 50 cities with the highest homicide rate in the world in 2022. The aggregate cost of crime in the United States is significant, with an estimated value of $4.9 trillion reported in 2021. Data from the first half of 2023, from government and private sector sources show that the murder rate has dropped, as much as 12% in as many as 90 cities across the United States. The drop in homicide rates is not uniform across the country however, with some cities such as Memphis, TN, showing an uptick in murder rates.
Crime in Chicago has been tracked by the Chicago Police Department's Bureau of Records since the beginning of the 20th century. The city's overall crime rate, especially the violent crime rate, is higher than the US average. Gangs in Chicago have a role in the city's crime rate. The number of homicides in Chicago hit a 25-year high in 2021.
Crime in Toronto has been low in comparison to other major cities. In 2024, a ranking of 60 large cities by The Economist ranked Toronto as the 6th safest major city in the world, and the safest major city in North America. In the same year, CEOWORLD magazine, which includes some major medium-sized cities, ranked Toronto as the 160th safest city in the world, running behind several other major cities including Taipei, Munich, and Jerusalem, as well as, in Canada, Quebec City and Ottawa, but safer than most cities in the United States.
Crime and violence affect the lives of millions of people in Latin America. Some consider social inequality to be a major contributing factor to levels of violence in Latin America, where the state fails to prevent crime and organized crime takes over State control in areas where the State is unable to assist the society such as in impoverished communities. In the years following the transitions from authoritarianism to democracy, crime and violence have become major problems in Latin America. The region experienced more than 2.5 million murders between 2000 and 2017. Several studies indicated the existence of an epidemic in the region; the Pan American Health Organization called violence in Latin America "the social pandemic of the 20th century." Apart from the direct human cost, the rise in crime and violence has imposed significant social costs and has made much more difficult the processes of economic and social development, democratic consolidation and regional integration in the Americas.
According to the Louisiana Uniform Crime reporting program, there were 177,710 crimes reported in the U.S. state of Louisiana in 2018. 2018 had the least amount of non-violent criminal offenses since at least 2008. Violent crime decreased from 2017 to 2018, but 2012 still remains the lowest with its record of 22,868. Rape went up 12.7% from 2017 while murder/non-negligent manslaughter declined 7.8%. Additionally, robbery dropped 15% and aggravated assault dropped 1.5%. Handguns remain the leading murder weapon with a rate of 44.7% with firearm following close behind at 35.7%. Together, these two contribute for 80.4% of the murders. Similarly, robberies were committed mostly with firearms in 2018. Firearms were leading with 52% and strongarm listed with a percentage of 35%.
In 2019, 43,686 crimes were reported in the U.S. state of Michigan. Crime statistics vary widely by location. For example, Dearborn has a murder rate of only 2.1 per 100,000 while sharing borders with Detroit and Inkster, some of the highest rates in the state.
Crime in Minnesota encompasses a wide range of unlawful activities that occur within the state, regulated by both state and federal laws. While crime rates in Minnesota are generally below the national average, certain areas and types of crime have garnered public attention.
Crime rates in Connecticut are lower than in the United States as a whole and have fallen significantly over the past decade, according to the 2021 Crime in Connecticut Report. This pattern holds true overall, and for most types of crime.
The American city of Baltimore, Maryland, is notorious for its crime rate, which ranks well above the national average. Violent crime spiked in 2015 after the death of Freddie Gray on April 19, 2015, which touched off riots and an increase in murders. The city recorded 348 homicides in 2019, a number second only to the number recorded in 1993 when the population was nearly 125,000 higher.
Missing and Murdered Indigenous Women (MMIW) also known as Missing and Murdered Indigenous Women and Girls (MMIWG) and more broadly as Missing and Murdered Indigenous Relatives (MMIR) or Missing and Murdered Indigenous People (MMIP) is a human rights crisis of violence against Indigenous women in Canada and the United States,notably those in the FNIM and Native American communities, but also amongst other Indigenous peoples such as in Australia and New Zealand, and the grassroots movement to raise awareness of MMIW through organizing marches; building databases of the missing; holding local community, city council, and tribal council meetings; and conducting domestic violence trainings and other informational sessions for police.
↑ Expanded Homicide Data Table 10 (FBI). Note that I did not include gang homicides as "stranger killings" as there is some affiliation between rival gangs, it's not necessarily random like being killed in an attempted robbery. Retrieved May 2014
↑ 1.6*50=80, meaning 80 people of every 100,000 are murdered in 50 years. 80/100,000*0.16=0.000128%. The same formula is used for the U.S. rate
This page is based on this Wikipedia article Text is available under the CC BY-SA 4.0 license; additional terms may apply. Images, videos and audio are available under their respective licenses.