Demographics of Tanzania

Last updated

Demographics of Tanzania
Tanzania single age population pyramid 2020.png
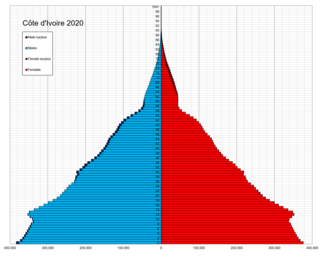
Population pyramid of Tanzania in 2020
Population63,852,892
Growth rate2.78% (2022 est.)
Birth rate33.3 births/1,000 population
Death rate5.09 deaths/1,000 population
Life expectancy70.19 years
  male68.42 years
  female72.02 years
Fertility rate4.39 children
Infant mortality rate30.87 deaths/1,000 live births
Net migration rate-0.41 migrant(s)/1,000 population
Sex ratio
Total1 male(s)/female (2022 est.)
At birth1.03 male(s)/female
Nationality
NationalityTanzanian
Language
OfficialKiswahili or Swahili, English

Demographic features of the population of Tanzania include population density, ethnicity, education level, health of the populace, economic status, religious affiliations, and other aspects of the population.

Contents

The population distribution in Tanzania is extremely uneven. Most people live on the northern border or the eastern coast, with much of the remainder of the country being sparsely populated. [1] :1252 Density varies from 12 per square kilometre (31/sq mi) in the Katavi Region to 3,133 per square kilometre (8,110/sq mi) in Dar es Salaam. [2] :6 Approximately 70 percent of the population is rural, although this percentage has been declining since at least 1967. [3] Dar es Salaam is the de facto capital and largest city. Dodoma, located in the centre of Tanzania, is the de jure capital, although action to move government buildings to Dodoma has stalled.

The population consists of about 125 ethnic groups. [4] The Sukuma, Nyamwezi, Chagga, and Haya peoples have more than 1 million members each. [5] :4

Over 100 languages are spoken in Tanzania, making it the most linguistically diverse country in East Africa. [6] Among the languages spoken in Tanzania are all four of Africa's language families: Bantu, Cushitic, Nilotic, and Khoisan. [6] Swahili and English are Tanzania's official languages. [6] Swahili belongs to the Bantu branch of the Niger-Congo family. [7] The Sandawe people speak a language that may be related to the Khoe languages of Botswana and Namibia, while the language of the Hadzabe people, although it has similar click consonants, is arguably a language isolate. [8] The language of the Iraqw people is Cushitic. [9] Other languages are Indian languages and Portuguese (spoken by Goans and Mozambicans).

Although much of Zanzibar's native population came from the mainland, one group known as Shirazis traces its origins to the island's early Persian settlers. [ citation needed ] Non-Africans residing on the mainland and Zanzibar account for 1 percent of the total population. The Asian community include Hindus, Sikhs, Shi'a and Sunni Muslims, Parsis, and Goans, has declined by 50 percent in the 2000s and early 2010s to 50,000 on the mainland and 4,000 on Zanzibar. An estimated 70,000 Arabs and 20,000 Europeans (90 percent of which are from the British diaspora) reside in Tanzania. Over 100,000 people living in Tanzania are of Asian or European ancestry. [10]

Based on 1999–2003 data, over 74,000 Tanzanian-born people were living in Organisation for Economic Co-operation and Development countries, with 32,630 residing in the United Kingdom; 19,960 in Canada; 12,225 in the United States; 1,714 in Australia; 1,180 in the Netherlands; and 1,012 in Sweden. [11]

Population

Population density (2022) Human population density Tanzania.png
Population density (2022)
Demographics of Tanzania, Data of Our World in Data, year 2022; Number of inhabitants in millions. Tanzania-demography.png
Demographics of Tanzania, Data of Our World in Data, year 2022; Number of inhabitants in millions.
The Bantu Sukuma are Tanzania's largest ethnic group. Sukump1.jpg
The Bantu Sukuma are Tanzania's largest ethnic group.

According to the 2012 census, the total population was 44,928,923 compared to 12,313,469 in 1967, [2] :1 resulting in an annual growth rate of 2.9 percent. The under 15 age group represented 44.1 percent of the population, with 35.5 percent being in the 15–35 age group, 52.2 percent being in the 15–64 age group, and 3.8 percent being older than 64. [12]

According to the 2012 revision of the World Population Prospects, children below the age of 15 constituted 44.8 percent of the total population, with 52.0 percent aged 15–64 and 3.1 percent aged 65 or older. [13]

Total population [13] Population aged 0–14 (%) [13] Population aged 15–64 (%) [13] Population aged 65+ (%) [13]
19507,650,00046.051.82.2
19558,741,00045.752.02.3
196010,074,00045.851.82.4
196511,683,00045.851.72.4
197013,605,00046.251.32.5
197515,978,00046.451.12.6
198018,687,00046.550.82.6
198521,850,00046.451.02.7
199025,485,00046.051.32.7
199529,944,00045.351.92.8
200034,021,00044.852.32.9
200538,824,00044.652.43.0
201044,793,00044.852.03.1

Structure of the population

Structure of the population (01.07.2013) (Estimates) (Projections based on the 2002 Population Census.): [14]

Age GroupMaleFemaleTotal%
Total23 267 95723 864 62347 132 580100
0-44 191 0044 121 1038 312 10717.64
5-93 608 8913 551 9557 160 84615.19
10-142 735 4942 728 6875 464 18111.59
15-192 494 9832 490 9604 985 94310.58
20-242 179 1732 160 9704 340 1439.21
25-291 730 6001 754 0073 484 6077.39
30-341 289 1141 563 0832 852 1976.05
35-391 207 1821 394 4282 601 6105.52
40-441 032 6051 088 6972 121 3024.50
45-49770 149797 8681 568 0173.33
50-54604 621629 5801 234 2012.62
55-59422 141459 343881 4841.87
60-64347 604387 334734 9381.56
65-69223 365243 517466 8820.99
70-74179 960207 795387 7550.82
75-79115 076130 796245 8720.52
80+135 995154 500290 4950.62
Age groupMaleFemaleTotalPercent
0-1410 535 38910 401 74520 937 13444.42
15-6412 078 17212 726 27024 804 44252.63
65+654 396736 6081 391 0042.95

Population Estimates by Sex and Age Group (01.VII.2020) (Projections based on the 2012 Population Census.): [15]

Age GroupMaleFemaleTotal%
Total28 229 59929 408 02957 637 628100
0–44 972 2894 878 7389 851 02717.09
5–94 013 2633 968 9537 982 21613.85
10–143 582 8993 568 7907 151 68912.41
15–193 014 1183 041 1146 055 23210.51
20–242 656 3622 674 1225 330 4849.25
25–292 042 0032 333 2564 375 2597.59
30–341 642 3841 971 5173 613 9016.27
35–391 464 2461 732 2253 196 4715.55
40–441 241 7821 330 2902 572 0724.46
45–491 032 7321 113 7922 146 5243.72
50–54758 908762 3411 521 2492.64
55–59605 139713 0991 318 2382.29
60–64411 344406 728818 0721.42
65-69312 655351 895664 5501.15
70-74199 196211 801410 9970.71
75-79141 944180 717322 6610.56
80+138 335168 651306 9860.53
Age groupMaleFemaleTotalPercent
0–1412 568 45112 416 48124 984 93243.35
15–6414 869 01816 078 48430 947 50253.69
65+792 130913 0641 705 1942.96

Vital statistics

The Tanzanian Demographic and Health Survey 2010 estimated that the infant mortality rate for 2005–10 was 51. [16] Registration of other vital events in Tanzania is not complete. The Population Department of the United Nations prepared the following estimates. [17]

Mid-year population
(thousands)
Live births
(thousands)
Deaths
(thousands)
Natural change
(thousands)
Crude birth rate (per 1000)Crude death rate (per 1000)Natural change (per 1000) Total fertility rate (TFR) Infant mortality (per 1000 births)
19507 632  365  168  19747.722.025.86.49145.0
1951  7 835  376  170  20548.021.726.26.51144.0
1952  8 045  387  174  21348.121.726.56.53143.1
1953  8 264  399  178  22148.321.626.86.56142.1
1954  8 490  411  182  22948.521.427.06.58141.2
1955  8 726  425  186  23948.721.427.36.61140.4
1956  8 970  439  191  24848.921.327.66.65139.7
1957  9 224  454  196  25849.221.228.06.69138.9
1958  9 488  467  201  26649.221.128.16.70138.1
1959  9 760  482  206  27649.321.128.36.72137.4
1960  10 042  496  211  28549.421.028.46.73136.6
1961  10 338  512  216  29649.620.928.76.75135.8
1962  10 645  528  221  30749.620.828.86.76134.9
1963  10 960  544  226  31849.720.629.06.77133.9
1964  11 290  560  231  32949.620.429.26.78132.7
1965  11 631  576  235  34149.520.229.36.78131.5
1966  11 982  593  239  35449.520.029.56.79130.1
1967  12 346  609  243  36749.419.729.76.80128.6
1968  12 740  628  245  38349.419.230.16.84127.1
1969  13 168  651  248  40349.518.830.76.88125.6
1970  13 618  675  252  42349.718.531.16.91124.0
1971  14 092  701  257  44449.818.331.66.94122.3
1972  14 596  725  262  46349.818.031.86.95120.5
1973  15 124  752  266  48749.817.632.26.96118.7
1974  15 671  781  272  51049.917.432.67.00116.7
1975  16 244  808  277  53149.817.132.77.00114.7
1976  16 839  832  281  55149.516.732.86.99112.6
1977  17 455  860  285  57649.316.333.06.99110.5
1978  18 080  887  289  59849.116.033.16.98108.7
1979  18 699  909  292  61748.615.633.06.95107.1
1980  19 298  930  297  63248.115.432.76.91106.2
1981  19 891  950  303  64747.715.232.56.85105.8
1982  20 500  973  311  66347.415.132.36.80105.8
1983  21 171  998  320  67847.215.132.16.75106.0
1984  21 857  1 017  329  68846.515.131.46.67106.1
1985  22 570  1 038  337  70046.115.031.16.57105.8
1986  23 324  1 059  345  71445.414.830.66.48105.0
1987  24 099  1 082  353  72945.014.730.36.40103.8
1988  24 844  1 110  360  74944.614.530.16.37102.5
1989  25 523  1 130  369  76144.214.429.86.29101.1
1990  26 206  1 149  380  76943.814.529.36.2099.9
1991  26 891  1 171  391  78143.514.529.06.1498.9
1992  27 581  1 190  404  78743.114.628.56.0898.2
1993  28 469  1 211  414  79842.814.628.26.0197.1
1994  29 598  1 250  426  82442.514.528.05.9396.2
1995  30 560  1 300  440  86042.514.428.15.8795.0
1996  31 141  1 334  450  88442.514.328.25.8593.4
1997  31 786  1 353  460  89342.514.528.15.8491.5
1998  32 626  1 386  464  92242.414.228.25.7988.7
1999  33 500  1 415  459  95642.213.728.55.7385.4
2000  34 464  1 453  457  99642.113.328.95.6981.6
2001  35 414  1 495  452  1 04342.112.729.45.6777.4
2002  36 354  1 525  447  1 07841.912.329.65.6273.1
2003  37 334  1 565  437  1 12841.811.730.25.6169.0
2004  38 361  1 613  433  1 17942.011.330.75.6165.4
2005  39 440  1 662  430  1 23242.110.931.25.6162.1
2006  40 562  1 696  428  1 26941.710.531.25.5659.2
2007  41 716  1 719  424  1 29541.110.231.05.4956.4
2008  42 871  1 748  422  1 32540.79.830.85.4354.0
2009  43 958  1 773  415  1 35840.29.430.85.3651.5
2010  45 111  1 795  401  1 39439.78.930.85.2949.5
2011  46 416  1 816  392  1 42439.18.430.65.2147.4
2012  47 786  1 833  382  1 45138.38.030.35.1045.5
2013  49 254  1 908  375  1 53338.77.631.15.1243.9
2014  50 815  1 978  369  1 60938.97.331.65.1242.2
2015  52 543  2 032  365  1 66738.77.031.85.0941.1
2016  54 402  2 086  361  1 72538.46.731.75.0339.8
2017  56 267  2 140  360  1 78038.16.431.74.9938.6
2018  58 090  2 181  359  1 82237.56.231.34.9237.3
2019  59 873  2 224  360  1 86437.16.031.14.8636.3
2020  61 705  2 262  381  1 88136.76.230.54.8035.3
2021  63 588  2 303  396  1 90736.26.230.04.7334.3

Life expectancy

Life expectancy in Tanzania since 1950 Life expectancy in Tanzania.svg
Life expectancy in Tanzania since 1950
Life expectancy in Tanzania since 1960 by gender Life expectancy by WBG -Tanzania -diff.png
Life expectancy in Tanzania since 1960 by gender
PeriodLife expectancy in
Years [18]
1950–195541.25
1955–1960Increase2.svg 43.03
1960–1965Increase2.svg 44.31
1965–1970Increase2.svg 45.83
1970–1975Increase2.svg 47.70
1975–1980Increase2.svg 49.90
1980–1985Increase2.svg 50.64
1985–1990Increase2.svg 50.86
1990–1995Decrease2.svg 49.61
1995–2000Decrease2.svg 50.06
2000–2005Increase2.svg 53.65
2005–2010Increase2.svg 58.82
2010–2015Increase2.svg 62.78
2020Increase2.svg 66.40
2021Decrease2.svg 66.20

Population numbers

Source: [19]

Region1967 (Population / Crude Birth Rate / Total Fertility Rate)1978 (Population / Crude Birth Rate / Total Fertility Rate)1988 (Population / Crude Birth Rate / Total Fertility Rate)2002 (Population / Crude Birth Rate / Total Fertility Rate)2012 (Population / Crude Birth Rate / Total Fertility Rate)
Tanzania, including Zanzibar12,313,469 / 47 / 7.317,036,499 / 49 / 6.322,455,207 / 47 / 5.433,461,849 / 43 / 4.244,928,923 / /
Zanzibar354,815 / 48 / 7.3476,111 / 48 / 7.1640,675 / 49 / 6.4981,754 / 43 / 4.51,303,569 / /

Fertility and Births (Demographic and Health Surveys)

Total Fertility Rate (TFR) (Wanted Fertility Rate) and Crude Birth Rate (CBR): [20]

YearCBR (Total)TFR (Total)CBR (Urban)TFR (Urban)CBR (Rural)TFR (Rural)CBR (Zanzibar)TFR (Zanzibar)
1991-199242.86.25 (5.57)42.15.1443.06.59 (5.91)
199640.85.82 (5.1)36.34.11 (3.5)41.96.34 (5.5)
199941.45.55 (4.8)34.43.16 (2.9)43.56.48 (5.5)
2004-200542.45.7 (4.9)34.63.6 (3.1)44.86.5 (5.6)38.05.3 (4.6)
201038.15.4 (4.7)35.03.7 (3.3)39.06.1 (5.3)35,95.1 (4.8)
2015-1637.25.2 (4.5)35.13.8 (3.4)38.16.0 (5.1)36.35.1 (4.6)
201735.54.931.03.537.35.733.74.5
202233.84.8 (4.4)31.93.6 (3.4)34.65.5 (5.0)33.84.7 (4.3)

Total fertility rate in Tanzania

Population, fertility rate and net reproduction rate, United Nations estimates Tanzania Population 1950-2021 Forecast 2022-2032 UN World Population Prospects 2022.svg
Population, fertility rate and net reproduction rate, United Nations estimates

Fertility rates are estimated by Surveys (TDHS) and Census in different times. TDHS surveys estimated these fertility rates: 6.3 (1991–92), 5.8 (1996), 5.7 (2004–05), 5.4 (2010) and 2002 Census said 6.3 [21]

Region1967 [22] 1978 [22] 1988 [22] 2006-09 [16] 2017 [23]
Tanzania (country total)7.36.35.45.44.9
Dodoma (capital)7.66.25.96.0
Arusha 7.57.06.03.2
Kilimanjaro 8.97.55.83.4
Tanga 7.76.25.14.6
Morogoro 6.26.54.33.7
Pwani 5.86.15.43.8
Dar es Salaam 5.05.43.42.8
Lindi -5.44.63.9
Mtwara 5.74.94.53.3
Ruvuma 7.16.15.03.7
Iringa 7.86.34.94.5
Mbeya 8.16.34.74.7
Singida 6.35.95.77.4
Tabora 6.76.05.46.9
Rukwa -6.16.25.7
Kigoma 6.67.26.55.7
Shinyanga 8.76.96.35.5
Kagera 7.57.36.94.7
Mwanza 8.17.16.16.0
Mara 8.06.95.96.4
Manyara ---6.0
Njombe ---4.2
Simiyu ---7.6
Geita ---6.9
Katavi ---6.7
Songwe ---5.4
Tanzania Mainland 7.36.35.45.44.9
North Unguja-7.17.04.5
South Unguja-6.26.53.2
Urban West-6.15.23.6
North Pemba-8.36.96.3
South Pemba-8.27.65.5
Tanzania Zanzibar 7.37.16.45.14.5

Other demographic statistics

The following demographic statistics of Tanzania in 2022 are from the World Population Review. [24]

Old Tanzanian woman in Arusha, 2008. Tanzania-woman.jpg
Old Tanzanian woman in Arusha, 2008.

The following demographic statistics are from the CIA World Factbook, unless otherwise indicated. [25]

Population

63,852,892 (2022 est.)
55,451,343 (July 2018 est.)
48,261,942 (July 2013 est.)

Religions

Christian 63.1%, Muslim 34.1%, folk religion 1.1%, Buddhist <1%, Hindu <1%, Jewish <1%, other <1%, unspecified 1.6% (2020 est.)
note: Zanzibar is almost entirely Muslim

Age structure

Population pyramid of Tanzania in 2017 Tanzania single age population pyramid 2020.png
Population pyramid of Tanzania in 2017
0-14 years: 42.7% (male 12,632,772/female 12,369,115)
15-24 years: 20.39% (male 5,988,208/female 5,948,134)
25-54 years: 30.31% (male 8,903,629/female 8,844,180)
55-64 years: 3.52% (male 954,251/female 1,107,717)
65 years and over: 3.08% (male 747,934/female 1,056,905) (2020 est.)
0-14 years: 43.4% (male 12,159,482 /female 11,908,654)
15-24 years: 20.03% (male 5,561,922 /female 5,543,788)
25-54 years: 30.02% (male 8,361,460 /female 8,284,229)
55-64 years: 3.51% (male 872,601 /female 1,074,480)
65 years and over: 3.04% (male 706,633 /female 978,094) (2018 est.)

Median age

total: 18.2 years. Country comparison to the world: 212nd
male: 17.9 years
female: 18.4 years (2020 est.)
total: 17.9 years. Country comparison to the world: 215th
male: 17.6 years
female: 18.2 years (2018 est.)
total: 17.3 years
male: 17.0 years
female: 17.6 years (2013 est.)

Birth rate

33.3 births/1,000 population (2022 est.) Country comparison to the world: 21st
35.3 births/1,000 population (2018 est.) Country comparison to the world: 19th

Death rate

5.09 deaths/1,000 population (2022 est.) Country comparison to the world: 192nd
7.5 deaths/1,000 population (2018 est.) Country comparison to the world: 112nd

Total fertility rate

4.33 children born/woman (2023 est.) Country comparison to the world: 19th
4.39 children born/woman (2022 est.) Country comparison to the world: 20th
4.71 children born/woman (2018 est.) Country comparison to the world: 20th

Population growth rate

2.78% (2022 est.) Country comparison to the world: 13th
2.74% (2018 est.) Country comparison to the world: 14th

Mother's mean age at first birth

19.8 years (2015/16 est.)
note: median age at first birth among women 25-29

Contraceptive prevalence rate

38.4% (2015/16)

Net migration rate

-0.41 migrant(s)/1,000 population (2022 est.) Country comparison to the world: 123rd
-0.5 migrant(s)/1,000 population (2018 est.) Country comparison to the world: 127th

Dependency ratios

total dependency ratio: 93.4 (2015 est.)
youth dependency ratio: 87.4 (2015 est.)
elderly dependency ratio: 6 (2015 est.)
potential support ratio: 16.6 (2015 est.)

Urbanization

urban population: 36.7% of total population (2022)
rate of urbanization: 4.89% annual rate of change (2020-25 est.)
urban population: 33.8% of total population (2018)
rate of urbanization: 5.22% annual rate of change (2015-20 est.)

Major infectious diseases

degree of risk: very high (2020)
food or waterborne diseases: bacterial diarrhea, hepatitis A, and typhoid fever
vectorborne diseases: malaria, dengue fever, and Rift Valley fever
water contact diseases: schistosomiasis
animal contact diseases: rabies

Ethnic groups

A Muslim man in Bagamoyo. Young Muslim Man - Bagamoyo - Tanzania.jpg
A Muslim man in Bagamoyo.

mainland - African 99% (of which 95% are Bantu consisting of more than 130 tribes), other 1% (consisting of Asian, European, and Arab); Zanzibar - Arab, African, mixed Arab and African. Around 100,000 people living in Tanzania are from Europe or Asia.

Sex ratio

at birth: 1.03 male(s)/female
0-14 years: 1.02 male(s)/female
15–54 years: 1.00 male(s)/female
55-64 years: 0.75 male(s)/female
65 years and over: 0.76 male(s)/female
total population: 0.99 male(s)/female (2013 estimate)

Life expectancy at birth

total population: 70.19 years. Country comparison to the world: 169th
male: 68.42 years
female: 72.02 years (2022 est.)
total population: 63.1 years
male: 61.6 years
female: 64.6 years (2018 est.)
total population: 60.76 years
male: 59.48 years
female: 62.09 years (2013 estimate)

HIV/AIDS

Age 15-49 HIV infection rates:

4.5 percent overall, [26] with 6.2 percent of women [27] and 3.8 percent of men [28] being infected. [29]

People living with HIV/AIDS:

1.5 million (2017 est.) [30]

Deaths:

32,000 (2017 est.)

Languages

Education expenditures

3.1% of GDP (2020) Country comparison to the world: 146th

Literacy

definition: age 15 and over can read and write Swahili, English, or Arabic

total population: 77.9%
male: 83.2%
female: 73.1% (2015 est.)
total population: 69.4%
male: 77.5%
female: 62.2% (2003 est.)

School life expectancy (primary to tertiary education)

total: 9 years
male: 9 years
female: 9 years (2020)

Unemployment, youth ages 15-24

total: 3.9%
male: 3.1%
female: 4.6% (2014 est.)

Religions

Most Tanzanians are nowadays Christians and Muslims. The numerical relationship between followers of the two religions is regarded as politically sensitive and questions about religious affiliation have not been included in census questionnaires since 1967.

For many years estimates have been repeated that about a third of the population each follows Islam, Christianity and traditional religions. [32] As there is likely no longer such a large percentage of traditional religionists, [33] a range of competing estimates has been published giving one side or the other a large share or trying to show equal shares.

Estimates from the Pew Report Islam and Christianity (2010) were 60% Christian and 36% Muslim. [34]

The remainder of the population are Hindus, Buddhists, animists, and unaffiliated. Most Christians are Roman Catholic, Lutheran, Anglican or Pentecostal, though a number of other churches, as Seventh-Day Adventist, and Eastern Orthodox Christians are also represented in the country. Most Tanzanian Muslims are Sunni Muslims, though there are also populations of Ibadi, Shia, Ahamadiya, Bohora. Muslims are concentrated in coastal areas and in mainland areas along former caravan trade routes.

See also

Related Research Articles

<span class="mw-page-title-main">Demographics of Chad</span>

The people of Chad speak more than 100 languages and divide themselves into many ethnic groups. However, language and ethnicity are not the same. Moreover, neither element can be tied to a particular physical type.

<span class="mw-page-title-main">Demographics of Cameroon</span>

The demographic profile of Cameroon is complex for a country of its population. Cameroon comprises an estimated 250 distinct ethnic groups, which may be formed into five large regional-cultural divisions:

<span class="mw-page-title-main">Demographics of the Central African Republic</span> Demographics of country

Demographic features of the population of the Central African Republic include population density, ethnicity, education level, health of the populace, economic status, religious affiliations and other aspects of the population.

<span class="mw-page-title-main">Demographics of Ivory Coast</span>

Demographic features of the population of Ivory Coast include population density, ethnicity, education level, health of the populace, economic status, religious affiliations and other aspects of the population.

<span class="mw-page-title-main">Demographics of the Comoros</span>

The Comorians inhabiting Grande Comore, Anjouan, and Mohéli share African-Arab origins. Islam is the dominant religion, and Quranic schools for children reinforce its influence. Although Islamic culture is firmly established throughout, a small minority are Christian.

<span class="mw-page-title-main">Demographics of the Democratic Republic of the Congo</span>

Demographic features of the population of the Democratic Republic of the Congo include ethnicity, education level, health, economic status, religious affiliations and other aspects of the population.

<span class="mw-page-title-main">Demographics of Ghana</span>

Demographic features of the population of Ghana include population density, ethnicity, education level, health of the populace, religious affiliations, and other aspects.

<span class="mw-page-title-main">Demographics of Kenya</span> Demographics of a country

The demography of Kenya is monitored by the Kenyan National Bureau of Statistics. Kenya is a multi-ethnic state in East Africa. Its total population was at 47,558,296 as of the 2019 census.

<span class="mw-page-title-main">Demographics of Lesotho</span>

Demographic features of the population of Lesotho include population density, ethnicity, education level, health of the populace, economic status, religious affiliations and other aspects.

<span class="mw-page-title-main">Demographics of Liberia</span>

As of 2006, Liberia had the highest population growth rate in the world. This has declined since, however, and stood at 2.37 percent in 2023.

<span class="mw-page-title-main">Demographics of Mali</span>

Demographic features of the population of Mali include population density, ethnicity, education level, health of the populace, economic status, religious affiliations and other aspects of the population.

<span class="mw-page-title-main">Demographics of Mauritius</span> Demographics of Mauritius

Mauritian society incorporates several ethnic and multi-ethnic groups. A majority of the republic's residents are descendants of people from India. Mauritius also comprises migrants from continental Africa, China, France, and the East African island of Madagascar. As of 2023, Mauritius now has the highest population density in Africa.

<span class="mw-page-title-main">Demographics of Mozambique</span>

The demographics of Mozambique describes the condition and overview of Mozambique's peoples. Demographic topics include basic education, health, and population statistics as well as identified racial and religious affiliations.

<span class="mw-page-title-main">Demographics of Namibia</span>

This is a demography of the population of Namibia including population density, ethnicity, education level, health of the populace, economic status, religious affiliations and other aspects of the population.

<span class="mw-page-title-main">Demographics of Nigeria</span>

Nigeria is the most populous country in Africa and the sixth in the world. It is also one of the most densely populated countries in Africa, with approximately 218.5 million people in an area of 923,768 km2 (356,669 sq mi).

<span class="mw-page-title-main">Demographics of the Republic of the Congo</span> National demographics

Demographic features of the population of the Republic of the Congo include population density, ethnicity, education level, health of the populace, economic status, religious affiliations and other aspects of the population.

<span class="mw-page-title-main">Demographics of Zimbabwe</span>

Demographic features of the population of Zimbabwe include population density, ethnicity, education level, health of the populace, economic status, religious affiliations and other aspects of the population.

<span class="mw-page-title-main">Demographics of Uganda</span> Aspect of human geography in Uganda

Demographic features of the population of Uganda include population density, ethnicity, education level, health of the populace, economic status, religious affiliations and others.

<span class="mw-page-title-main">Demographics of the Gambia</span> Demographics of the West African country

The demographic characteristics of the population of The Gambia are known through national censuses, conducted in ten-year intervals and analyzed by The Gambian Bureau of Statistics (GBOS) since 1963. The latest census was conducted in 2013. The population of The Gambia at the 2013 census was 1.8 million. The population density is 176.1 per square kilometer, and the overall life expectancy in The Gambia is 64.1 years. Since the first census of 1963, the population of The Gambia has increased every ten years by an average of 43.2 percent. Since 1950s, the birth rate has constantly exceeded the death rate; the natural growth rate is positive. The Gambia is in the second stage of demographic transition. In terms of age structure, The Gambia is dominated by 15- to 24-year-old segment (57.6%). The median age of the population is 19.9 years, and the gender ratio of the total population is 0.98 males per female.

<span class="mw-page-title-main">Demographics of Somalia</span>

Demographic features of Somalia's inhabitants include ethnicity, language, population density, education level, health, economic status, religious affiliations and other aspects of the population. Somalia is believed to be one of the most homogeneous countries in Africa.

References

  1. "Economy", authored by Joseph Lake, in Africa South of the Sahara, edited by Europa Publications and Iain Frame, Routledge, 2013
  2. 1 2 Population Distribution by Administrative Units, United Republic of Tanzania, 2013 Archived May 2, 2013, at the Wayback Machine
  3. ""Report reveals rapid rural-urban migration", The Citizen, reported by Athuman Mtulya, 26 September 2013". Archived from the original on 10 July 2018. Retrieved 23 November 2014.
  4. Levinson, David (26 August 1998). Ethnic Groups Worldwide: A Ready Reference Handbook. Oryx Press. ISBN   9781573560191 via Google Books.
  5. Otiso, Kefa M. (24 January 2013). Culture and Customs of Tanzania. ABC-CLIO. ISBN   9780313087080 via Google Books.
  6. 1 2 3 "East Africa", authored by Silvester Ron Simango, in Sociolinguistics: Regional overview, edited by Ulrich Ammon, published by Walter de Gruyter, 2006, pages 1966-7. Walter de Gruyter. 2005. ISBN   9783110184181.
  7. "Swahili - A language of Tanzania". Ethnologue. Retrieved 9 February 2014.
  8. Blench, Roger (22 June 2006). Archaeology, Language, and the African Past. Rowman Altamira. ISBN   9780759114210 via Google Books.
  9. ""Iraqw", Ethnologue: Languages of the World, edited by M. Paul Lewis, Gary F. Simons, and Charles D. Fennig, SIL International, Seventeenth edition, Dallas, Texas, USA, accessed 14 October 2014".
  10. "Tanzania History and Information - Safari Info for Tanzania". www.eyesonafrica.net. Retrieved 2020-05-28.
  11. "Country-of-birth database". Organisation for Economic Co-operation and Development. Archived from the original on 17 June 2009. Retrieved 10 July 2013.
  12. "Tanzania in figures 2012, National Bureau of Statistics, Ministry of Finance, June 2013, page 23" (PDF). Archived from the original (PDF) on 2013-11-26.
  13. 1 2 3 4 5 "World Population Prospects - Population Division - United Nations". esa.un.org.
  14. "United Nations Statistics Division - Demographic and Social Statistics". unstats.un.org.
  15. "UNSD — Demographic and Social Statistics".
  16. 1 2 Tanzania Demographic and Health Survey 2010, Tanzania National Bureau of Standards, funding provided by the Ministry of Health and Social Welfare (Tanzania), Tanzania Food and Nutrition Centre, Department for International Development (United Kingdom), World Health Organization/Zanzibar, United Nations Fund for Population Activities, United Nations Children's Fund, World Food Programme, United Nations Development Programme, and Irish Aids, technical assistance provided by ICF Macro through its MEASURE DHS programme, survey conducted 19 December 2010 to 23 May 2011, with results applying to the preceding three-year period Archived September 13, 2012, at the Wayback Machine
  17. "World Population Prospects - Population Division - United Nations". population.un.org. Retrieved 2022-07-13.
  18. "World Population Prospects - Population Division - United Nations". esa.un.org. Retrieved 2018-08-26.
  19. "Analytical Report, 2002 Census, United Republic of Tanzania" (PDF). Archived from the original (PDF) on 2012-04-17. Retrieved 2013-03-12.
  20. "MEASURE DHS: Demographic and Health Surveys". microdata.worldbank.org.
  21. "Archived copy" (PDF). Archived from the original (PDF) on 2012-09-13. Retrieved 2012-01-02.{{cite web}}: CS1 maint: archived copy as title (link)
  22. 1 2 3 "2002 Census, United Republic of Tanzania" (PDF). Archived from the original (PDF) on 2012-04-17. Retrieved 2013-03-12.
  23. "STATcompiler". www.statcompiler.com. Retrieved 2020-02-17.
  24. "Tanzania Population 2022", World Population Review, June 6, 2018
  25. "Tanzania", The World Factbook, Central Intelligence Agency, 2023-01-31, retrieved 2023-02-06PD-icon.svg This article incorporates text from this source, which is in the public domain .
  26. At a 95 percent confidence level, the rate was 4.6 to 5.6 percent. Refer to page 202 of the survey.
  27. At a 95 percent confidence level, the rate was 5.5 to 6.8 percent. Refer to page 202 of the survey.
  28. At a 95 percent confidence level, the rate was 3.2 to 4.5 percent. Refer to page 202 of the survey.
  29. "Tanzania HIV/AIDS and Malaria Indicator Survey 2011-12, authorized by the Tanzania Commission for AIDS (TACAIDS) and the Zanzibar Commission for AIDS; implemented by the Tanzania National Bureau of Statistics in collaboration with the Office of the Chief Government Statistician (Zanzibar); funded by the United States Agency for International Development, TACAIDS, and the Ministry of Health and Social Welfare, with support provided by ICF International; data collected 16 December 2011 to 24 May 2012; report published in Dar es Salaam in March 2013". Archived from the original on 20 October 2014.
  30. "UNAIDS World AIDS Day Report 2012, Joint United Nations Programme on HIV/AIDS, page 7" (PDF).
  31. 1 2 3 "Africa :: TANZANIA". CIA The World Factbook. 19 April 2022.
  32. So repeated here: (USA government), Central Intelligence Agency. "The World Fact Book" . Retrieved 25 May 2014.
  33. note continued adherence to traditional beliefs also among Christians and Muslims:"(In Tanzania) more than half the people surveyed believe that sacrifices to ancestors or spirits can protect them from harm." see Pew report Christians and Muslims in Subsaharan Africa (2010)
  34. "Tolerance and Tension: Islam and Christianity in Sub-Saharan Africa" (PDF). Pew Forum on Religious & Public life. April 2010. p. 20. Archived from the original (PDF) on 2016-03-12. Retrieved 25 April 2018.