| Image | Member | Party | Term | Notes |
|---|
|
| |  | David Storrer
(1854–1935) | Protectionist | 16 December 1903 –
26 May 1909 | Previously held the Tasmanian House of Assembly seat of Launceston. Lost seat |
| | Independent | 26 May 1909 –
13 April 1910 |
| |  | Jens Jensen
(1865–1936) | Labor | 13 April 1910 –
14 November 1916 | Previously held the Tasmanian House of Assembly seat of Wilmot. Served as minister under Fisher and Hughes. Lost seat. Later elected to the Tasmanian House of Assembly seat of Bass in 1922 |
| | National Labor | 14 November 1916 –
17 February 1917 |
| | Nationalist | 17 February 1917 –
1919 |
| | Independent | 1919 –
13 December 1919 |
| |  | Syd Jackson
(1889–1941) | Nationalist | 13 December 1919 –
12 October 1929 | Lost seat |
| |  | Allan Guy
(1890–1979) | Labor | 12 October 1929 –
March 1931 | Previously held the Tasmanian House of Assembly seat of Bass. Served as minister under Lyons. Lost seat. Later elected to the Division of Wilmot in 1940 |
| | Independent | March 1931 –
7 May 1931 |
| | United Australia | 7 May 1931 –
15 September 1934 |
| |  | Claude Barnard
(1890–1957) | Labor | 15 September 1934 –
10 December 1949 | Served as minister under Chifley. Lost seat. Later elected to the Tasmanian House of Assembly seat of Bass in 1950. Son was Lance Barnard |
| |  | Bruce Kekwick
(1910–1982) | Liberal | 10 December 1949 –
29 May 1954 | Lost seat |
| |  | Lance Barnard
(1919–1997) | Labor | 29 May 1954 –
2 June 1975 | Served as minister and Deputy Prime Minister under Whitlam. Resigned to become Australian Ambassador to Sweden, Norway and Finland. Father was Claude Barnard |
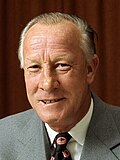
| |  | Kevin Newman
(1933–1999) | Liberal | 28 June 1975 –
26 October 1984 | Served as minister under Fraser. Retired |
| | | Warwick Smith
(1954–) | 1 December 1984 –
13 March 1993 | Lost seat |
| |  | Silvia Smith
(1939–2020) | Labor | 13 March 1993 –
2 March 1996 | Lost seat. Later elected to the Tasmanian Legislative Council in 1997 |
| | | Warwick Smith
(1954–) | Liberal | 2 March 1996 –
3 October 1998 | Served as minister under Howard. Lost seat |
| | | Michelle O'Byrne
(1968–) | Labor | 3 October 1998 –
9 October 2004 | Lost seat. Later elected to the Tasmanian House of Assembly seat of Bass in 2006 |
| | | Michael Ferguson
(1974–) | Liberal | 9 October 2004 –
24 November 2007 | Lost seat. Later elected to the Tasmanian House of Assembly seat of Bass in 2010 |
| | | Jodie Campbell
(1972–) | Labor | 24 November 2007 –
19 July 2010 | Retired |
| | | Geoff Lyons
(1953–) | 21 August 2010 –
7 September 2013 | Lost seat |
| | 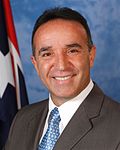 | Andrew Nikolic
(1961–) | Liberal | 7 September 2013 –
2 July 2016 | Lost seat |
| |  | Ross Hart
(1960–) | Labor | 2 July 2016 –
18 May 2019 | Lost seat |
| | 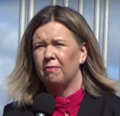 | Bridget Archer
(1975–) | Liberal | 18 May 2019 –
3 May 2025 | Lost seat. Later elected to the Tasmanian House of Assembly seat of Bass in 2025 |
| | | Jess Teesdale
(1987–) | Labor | 3 May 2025 –
present | Incumbent |


