Electoral history of John Major

Last updated

John Major Major PM full (cropped).jpg
John Major

This is a summary of the electoral history of John Major , who served as Prime Minister of the United Kingdom and Leader of the Conservative Party from 1990 to 1997. He was the Member of Parliament (MP) for Huntingdon from 1979 to 2001.

Contents

Council elections

1964 Lambeth London Borough Council election, Larkhall

Larkhall (3)
PartyCandidateVotes%±%
Labour A.J. Crouch 1,901 66.5
Labour G.A. Gold 1,875
Labour W.F. King 1,861
Conservative J.H. Chambers77427.1
Conservative J.R. Major 752
Conservative E. Brady740
Communist S.G. Hope1073.7
Independent P.R. Winchester772.7
Turnout 2,75524.5
Registered electors 11,243
Labour win (new seat)

1968 Lambeth London Borough Council election, Ferndale

Ferndale (3)
PartyCandidateVotes%±%
Conservative J.E. Langley1,02518.0%
Conservative G.R.I. Allnut1,00217.6%
Conservative John Roy Major 99117.4%
Labour L.G.M. Davis92116.2%
Labour J.M. Dodson89215.7%
Labour D.J. Packer86315.2%
Turnout 5,694
Conservative gain from Labour Swing

1971 Lambeth London Borough Council election, Thornton

Thornton (3) [1]
PartyCandidateVotes%
Labour D. W. Wendon 2,205 15.3%
Labour W. P. Weston 2,176 15.1%
Labour H. A. Bavin 2,167 15.1%
Conservative A. E. S. Meyer2,06514.4%
Conservative John Major 2,06114.3%
Conservative J. S. Steele2,05514.3%
Liberal J. P. Taylor2051.4%
Liberal A. G. Blackmore1821.3%
Liberal Mrs M. A. Granger1781.2%
Communist Mrs J. E. Styles800.6%
Turnout 14,376
Labour gain from Conservative

Parliamentary elections

February 1974 general election, St Pancras North

General election February 1974: St Pancras North
PartyCandidateVotes%±%
Labour Albert Stallard 14,76152.76
Conservative John Major 7,92628.33
Liberal Paul J Medlicott4,82517.25New
Communist Gordon McLennan 4661.67
Majority6,83524.43
Turnout 27,97867.53
Labour hold Swing

October 1974 general election, St Pancras North

General election October 1974: St Pancras North
PartyCandidateVotes%±%
Labour Albert Stallard 14,15558.53
Conservative John Major 6,60227.30
Liberal Paul J Medlicott3,42814.17
Majority7,55331.23
Turnout 24,18558.10
Labour hold Swing +3.4

1979 general election, Huntingdonshire

General election 1979: Huntingdonshire [2]
PartyCandidateVotes%±%
Conservative John Major 40,193 55.3 +10.2
Labour Julian G H Fulbrook18,63025.7−3.9
Liberal Dennis Graham Rowe12,81217.6−7.7
National Front K T Robinson9831.4New
Majority21,56329.6+14.1
Turnout 72.61877.4+2.3
Conservative hold Swing +7.1

1983 general election, Huntingdon

General election 1983: Huntingdon [3]
PartyCandidateVotes%±%
Conservative John Major 34,254 62.4
Liberal Sheila Gatiss13,90625.3
Labour Mark Slater6,31711.5
Ecology Timothy Eiloart4440.8
Majority20,34837.1
Turnout 54,92171.6
Conservative win (new seat)

1987 general election, Huntingdon

General election 1987: Huntingdon [3]
PartyCandidateVotes%±%
Conservative John Major 40,530 63.6 +1.2
SDP Anthony Nicholson13,48621.1―4.2
Labour David Brown8,88313.9+2.4
Green William Lavin8741.4+0.6
Majority27,04442.5+5.4
Turnout 63,77374.0+2.4
Conservative hold Swing

1992 general election, Huntingdon

General election 1992: Huntingdon [4]
PartyCandidateVotes%±%
Conservative John Major 48,662 66.2 +2.6
Labour Hugh Seckleman12,43216.9+3.0
Liberal Democrats Andrew Duff 9,38612.8―8.3
Liberal Paul Wiggin1,0451.4New
Green Deborah Birkhead8461.2―0.2
Monster Raving Loony Screaming Lord Sutch 7281.0New
Conservative ThatcheriteMichael Flanagan2310.3New
Gremloids Lord Buckethead 1070.1New
Forward to Mars Party Charles S. Cockell 910.1New
Natural Law David Shepherd260.0New
Majority36,23049.3+6.8
Turnout 73,55479.2+5.2
Conservative hold Swing ―0.2

1997 general election, Huntingdon

The constituency underwent boundary changes prior to the 1997 election and the changes are not based on the 1992 result.

General election 1997: Huntingdon
PartyCandidateVotes%±%
Conservative John Major 31,501 55.3 ―9.9
Labour Jason Reece13,36123.5+6.6
Liberal Democrats Matthew Owen8,39014.7―6.4
Referendum David Bellamy 3,1145.5New
UKIP Charles Coyne3310.6New
Christian DemocratVeronica Hufford1770.3New
Independent Duncan Robertson890.2New
Majority18,14031.8―6.8
Turnout 56,96374.9―4.3
Conservative hold Swing ―8.25

Conservative Party leadership elections

1990 leadership election

Second ballot: 27 November 1990
CandidateVotes%
John Major 18549.7
Michael Heseltine 13135.2
Douglas Hurd 5615.1
Majority5414.5
Turnout372100
Third ballot required

1995 leadership election

Only ballot: 4 July 1995
CandidateVotes%
John Major 21866.3
John Redwood 8927.1
Abstentions103.0
Spoilt123.6
Majority12939.2
Turnout329N/A
John Major re-elected

United Kingdom general elections

1992 general election

UK general election 1992 [5]
CandidatesVotes
PartyLeaderStoodElectedGainedUnseatedNet % of total %No.Net %
  Conservative John Major 645336344−4151.6941.914,093,007−0.3
  Labour Neil Kinnock 63427143 1 +4241.6234.411,560,484+3.6
  Liberal Democrats Paddy Ashdown 6322046−23.0717.85,999,606−4.8
  SNP Alex Salmond 723Steady2.svgSteady2.svgSteady2.svg0.461.9629,564+0.6
  UUP James Molyneaux 139Steady2.svgSteady2.svgSteady2.svg1.380.8271,0490.0
  SDLP John Hume 134 1 Steady2.svg+10.610.5184,4450.0
  Green Jean Lambert and Richard Lawson 2530Steady2.svgSteady2.svgSteady2.svg0.00.5170,047+0.2
  Plaid Cymru Dafydd Wigley 384 1 Steady2.svg+10.610.5156,796+0.1
  DUP Ian Paisley 73Steady2.svgSteady2.svgSteady2.svg0.460.3103,0390.0
  Sinn Féin Gerry Adams 140Steady2.svg 1 −10.00.278,291−0.1
  Alliance John Alderdice 160Steady2.svgSteady2.svgSteady2.svg0.00.268,6650.0
  Liberal Michael Meadowcroft 730Steady2.svgSteady2.svgSteady2.svg0.00.264,744Steady2.svg
  Natural Law Geoffrey Clements3090Steady2.svgSteady2.svgSteady2.svg0.00.262,888Steady2.svg
  Ind. Social Democrat N/A20Steady2.svgSteady2.svgSteady2.svg0.00.128,599Steady2.svg
  Independent N/A60Steady2.svgSteady2.svgSteady2.svg0.00.122,844Steady2.svg
  UPUP James Kilfedder 1 1 Steady2.svgSteady2.svgSteady2.svg0.150.119,3050.0
  Ind. Conservative N/A120Steady2.svgSteady2.svgSteady2.svg0.00.111,356Steady2.svg
  Monster Raving Loony Screaming Lord Sutch 250Steady2.svgSteady2.svgSteady2.svg0.00.17,929+0.1
  Independent N/A230Steady2.svgSteady2.svgSteady2.svg0.00.17,631Steady2.svg
  BNP John Tyndall 130Steady2.svgSteady2.svgSteady2.svg0.00.17,631Steady2.svg
  SDP John Bates80Steady2.svgSteady2.svgSteady2.svg0.00.16,649Steady2.svg
  Scottish Militant Labour Tommy Sheridan 1 0Steady2.svgSteady2.svgSteady2.svg0.00.16,287Steady2.svg
  National Front John McAuley140Steady2.svgSteady2.svgSteady2.svg0.00.14,816Steady2.svg
 True Labour Sydney Bidwell 1 0Steady2.svgSteady2.svgSteady2.svg0.00.14,665Steady2.svg
  Anti-Federalist Alan Sked 170Steady2.svgSteady2.svgSteady2.svg0.00.14,383Steady2.svg
  Workers' Party Marian Donnelly 80Steady2.svgSteady2.svgSteady2.svg0.00.14,3590.0
 Official Conservative Hove PartyNigel Furness 1 0Steady2.svgSteady2.svgSteady2.svg0.00.02,658Steady2.svg
  Loony Green Stuart Hughes 50Steady2.svgSteady2.svgSteady2.svg0.00.02,538Steady2.svg
  Ind. Unionist N/A 1 0Steady2.svgSteady2.svgSteady2.svg0.00.02,256Steady2.svg
  New Agenda Proinsias De Rossa 20Steady2.svgSteady2.svgSteady2.svg0.00.02,133Steady2.svg
 Independent Progressive SocialistN/A 1 0Steady2.svgSteady2.svgSteady2.svg0.00.01,094Steady2.svg
  Islamic Party David Pidcock40Steady2.svgSteady2.svgSteady2.svg0.00.01,085Steady2.svg
  Revolutionary Communist Frank Furedi 80Steady2.svgSteady2.svgSteady2.svg0.00.0745Steady2.svg
 Independent NationalistN/A 1 0Steady2.svgSteady2.svgSteady2.svg0.00.0649Steady2.svg
  Communist (PCC) Jack Conrad40Steady2.svgSteady2.svgSteady2.svg0.00.0603Steady2.svg

All parties with more than 500 votes shown. Plaid Cymru result includes votes for Green/Plaid Cymru Alliance.

Government's new majority21
Total votes cast [5] 33,614,074
Turnout77.7%

1997 general election

1997 United Kingdom general election [6]
CandidatesVotes
PartyLeaderStoodElectedGainedUnseatedNet % of total %No.Net %
  Labour Tony Blair 6394181460+14663.443.213,518,167+8.8
  Conservative John Major 6481650178–17825.030.79,600,943–11.2
  Liberal Democrats Paddy Ashdown 63946302+287.016.85,242,947–1.0
  Referendum James Goldsmith 54700002.6811,849N/A
  SNP Alex Salmond 72630+30.92.0621,550+0.1
  UUP David Trimble 1610 1 0+11.50.8258,3490.0
  SDLP John Hume 1830 1 –10.50.6190,814+0.1
  Plaid Cymru Dafydd Wigley 4040000.60.5161,0300.0
  Sinn Féin Gerry Adams 17220+20.30.4126,9210.0
  DUP Ian Paisley 920 1 –10.30.3107,3480.0
  UKIP Alan Sked 19300000.3105,722N/A
  Independent N/A25 1 1 0+10.20.264,4820.0
  Alliance John Alderdice 1700000.262,9720.0
  Green Peg Alexander and David Taylor 8900000.261,731–0.2
  Socialist Labour Arthur Scargill 6400000.252,109N/A
  Liberal Michael Meadowcroft 5300000.145,166–0.1
  BNP John Tyndall 5700000.135,8320.0
  Natural Law Geoffrey Clements19700000.130,604–0.1
  Speaker Betty Boothroyd 1 1 1 000.123,969
  ProLife Alliance Bruno Quintavalle5600000.119,332N/A
  UK Unionist Robert McCartney 1 1 1 0+10.20.012,817N/A
  PUP Hugh Smyth 300000.010,928N/A
  National Democrats Ian Anderson 2100000.010,829N/A
  Socialist Alternative Peter Taaffe 00000.09,906N/A
  Scottish Socialist Tommy Sheridan 1600000.09,740N/A
  Independent N/A400000.09,233– 0.1
  Ind. Conservative N/A400000.08,608–0.1
  Monster Raving Loony Screaming Lord Sutch 2400000.07,906–0.1
  Make Politicians History Rainbow George Weiss 2900000.03,745N/A
  NI Women's Coalition Monica McWilliams and Pearl Sagar 300000.03,024N/A
  Workers' Party Tom French 800000.02,766–0.1
  National Front John McAuley600000.02,716N/A
  Cannabis Law Reform Howard Marks 400000.02,085N/A
  Socialist People's Party Jim Hamezian 1 00000.01,995N/A
  Mebyon Kernow Loveday Jenkin 400000.01,906N/A
  Scottish Green Robin Harper 500000.01,721
  Conservative Anti-Euro Christopher Story 1 00000.01,434N/A
  Socialist (GB) None500000.01,359N/A
 Community RepresentativeRalph Knight 1 00000.01,290N/A
  Neighborhood association 1 00000.01,263N/A
  SDP John Bates200000.01,246–0.1
  Workers Revolutionary Sheila Torrance900000.01,178N/A
 Real LabourN/A 1 00000.01,117N/A
  Independent Democrat N/A00000.0982
  Independent N/A00000.0890
  Communist Mike Hicks 300000.0639
  Independent N/A 1 00000.0593
  Green (NI) 1 00000.0539
  Socialist Equality Davy Hyland300000.0505
All parties with more than 500 votes shown. Labour total includes New Labour and "Labour Time for Change" candidates; Conservative total includes candidates in Northern Ireland (excluded in some lists) and "Loyal Conservative" candidate.[ citation needed ]

The Popular Unionist MP elected in 1992 died in 1995, and the party folded shortly afterwards.

There was no incumbent Speaker in the 1992 election.
Government's new majority179
Total votes cast31,286,284
Turnout71.3%

Related Research Articles

<span class="mw-page-title-main">1997 United Kingdom general election</span>

The 1997 United Kingdom general election was held on Thursday, 1 May 1997. The governing Conservative Party led by Prime Minister John Major was defeated in a landslide by the Labour Party led by Tony Blair, achieving a 179-seat majority and a total of 418 seats, the highest ever won by Labour.

<span class="mw-page-title-main">1992 United Kingdom general election</span>

The 1992 United Kingdom general election was held on Thursday 9 April 1992, to elect 651 members to the House of Commons. The election resulted in the fourth consecutive victory for the Conservative Party since 1979, with a majority of 21 and would be the last time that the Conservatives would win an overall majority at a general election until 2015. It was also the last general election to be held on a day which did not coincide with any local elections until 2017. This election result took many by surprise, as opinion polling leading up to the election day had shown a narrow but consistent lead for the Labour Party under leader Neil Kinnock.

<span class="mw-page-title-main">1929 United Kingdom general election</span>

The 1929 United Kingdom general election was held on Thursday, 30 May 1929 and resulted in a hung parliament. Ramsay MacDonald's Labour Party won the most seats in the House of Commons for the first time despite receiving fewer votes than the Conservative Party, led by Prime Minister Stanley Baldwin. The Liberal Party led again by former Prime Minister David Lloyd George regained some ground lost in the 1924 general election and held the balance of power. Parliament was dissolved on 10 May.

<span class="mw-page-title-main">Ceredigion (UK Parliament constituency)</span> Parliamentary constituency in the United Kingdom, 1997 onwards

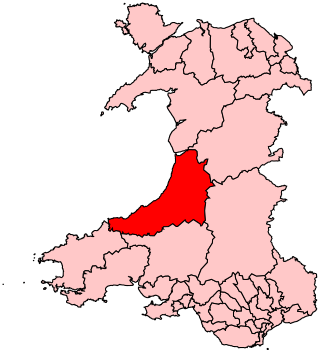
Ceredigion is a parliamentary constituency represented in the House of Commons of the UK Parliament. Created in 1536, the franchise expanded in the late 19th century and on the enfranchisement of women. Its boundaries remained virtually unchanged until 1983. From 1536 until 1885 the area had two seats : a county constituency (Cardiganshire) comprising the rural areas, the other the borough constituency known as the Cardigan District of Boroughs comprising a few separate towns; in 1885 the latter was abolished, its towns and electors incorporated into the former, reduced to one MP. The towns which comprised the Boroughs varied slightly over this long period, but primarily consisted of Cardigan, Aberystwyth, Lampeter and Adpar, the latter now a suburb of Newcastle Emlyn across the Teifi, in Carmarthenshire.

<span class="mw-page-title-main">Swansea West (UK Parliament constituency)</span> Parliamentary constituency in the United Kingdom, 1918 onwards

Swansea West is a constituency of the House of Commons of the Parliament of the United Kingdom. It elects one Member of Parliament (MP) by the first past the post system of election, and is currently represented by Geraint Davies of Labour Co-op, who was first elected in the constituency in 2010.

<span class="mw-page-title-main">Blaenau Gwent (UK Parliament constituency)</span> Parliamentary constituency in the United Kingdom, 1983 onwards

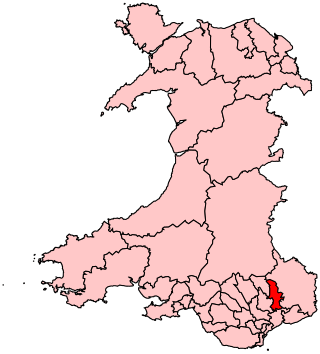
Blaenau Gwent is a constituency in South Wales, represented in the House of Commons of the UK Parliament since 2010 by Nick Smith of the Labour Party.

<span class="mw-page-title-main">Llanelli (UK Parliament constituency)</span> Parliamentary constituency in the United Kingdom, 1918 onwards

Llanelli is a constituency of the House of Commons of the Parliament of the United Kingdom. From 1918 to 1970 the official spelling of the constituency name was Llanelly. It elects one Member of Parliament (MP) by the first past the post system of election. Since 2005, it is currently represented by Nia Griffith of the Labour Party.

<span class="mw-page-title-main">Merthyr Tydfil and Rhymney (UK Parliament constituency)</span> Parliamentary constituency in the United Kingdom, 1983 onwards

Merthyr Tydfil and Rhymney was a constituency represented in the House of Commons of the UK Parliament. It was established for the 1983 general election.

<span class="mw-page-title-main">Torfaen (UK Parliament constituency)</span> Parliamentary constituency in the United Kingdom, 1983 onwards

Torfaen is a constituency in Wales represented in the House of Commons of the UK Parliament since 2015 by Nick Thomas-Symonds, a member of the Labour Party who also serves as the Shadow Secretary of State for International Trade. It was established for the 1983 general election.

<span class="mw-page-title-main">Vale of Glamorgan (UK Parliament constituency)</span> Parliamentary constituency in the United Kingdom, 1983 onwards

Vale of Glamorgan is a constituency represented in the House of Commons of the UK Parliament since 2010 by Alun Cairns, a Conservative.

<span class="mw-page-title-main">Doncaster North (UK Parliament constituency)</span> Parliamentary constituency in the United Kingdom

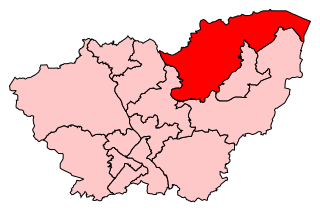
Doncaster North is a constituency in South Yorkshire, England, represented in the House of Commons of the UK Parliament since 2005 by Ed Miliband of the Labour Party. From 2010 until 2015, he was Leader of the Opposition before he lost the 2015 general election to David Cameron and the Conservatives. Part of the red wall, it was formerly a Labour stronghold, until the 2019 general election when it became a Labour-Conservative marginal.

<span class="mw-page-title-main">Bristol West (UK Parliament constituency)</span> Parliamentary constituency in the United Kingdom, 1885 onwards

Bristol West is a borough constituency represented in the House of Commons of the Parliament of the United Kingdom since 2015 by Thangam Debbonaire of the Labour Party. It mostly covers the central and western parts of Bristol.

<span class="mw-page-title-main">Witney (UK Parliament constituency)</span> Parliamentary constituency in the United Kingdom since 1983

Witney is a county constituency in Oxfordshire represented in the House of Commons of the Parliament of the United Kingdom since 2016 by Robert Courts of the Conservative Party. It elects one Member of Parliament by the first-past-the-post system of election, and was created for the 1983 general election.

<span class="mw-page-title-main">Arfon (UK Parliament constituency)</span> Parliamentary constituency in the UK

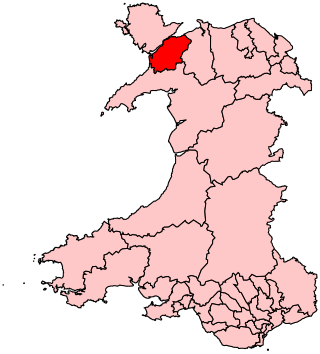
Arfon is a constituency in Wales represented in the House of Commons of the UK Parliament at Westminster. Although it is relatively large by geographical area, the constituency is a predominantly urban rather than rural seat, with the majority of the population living in the two towns of Bethesda and Caernarfon, as well as in the city of Bangor, on which the constituency is based. "Arfon" is a historical name for the area, meaning "facing Anglesey"; it is also the name of the former district council. This seat was created by the Welsh Boundary Commission in time for the 2010 general election; it replaced the old seat of Caernarfon. Bangor was in the old seat of Conwy. The same boundaries were used for the Arfon Welsh Assembly constituency in the 2007 Welsh Assembly election.

Pembrokeshire was a parliamentary constituency based on the county of Pembrokeshire in Wales. It returned one Member of Parliament (MP) to the House of Commons of the Parliament of the United Kingdom, elected by the first past the post system.

The 1985 Brecon and Radnor by-election was a parliamentary by-election held on 4 July 1985 for the House of Commons constituency of Brecon and Radnor.

<span class="mw-page-title-main">2007 National Assembly for Wales election</span>

The 2007 National Assembly for Wales election was held on Thursday 3 May 2007 to elect members to the National Assembly for Wales. It was the third general election. On the same day local elections in England and Scotland, as well as the Scottish Parliament election took place. This election was preceded by the previous Assembly election in 2003.

<span class="mw-page-title-main">2019 Brecon and Radnorshire by-election</span> UK parliamentary by-election

A by-election was held in the UK Parliament constituency of Brecon and Radnorshire on 1 August 2019 after Chris Davies, who had held the seat for the Conservatives since the 2015 general election, was unseated by a recall petition. The by-election was won by Jane Dodds of the Liberal Democrats.

<span class="mw-page-title-main">2024 United Kingdom general election in Wales</span>

The 2024 general election is scheduled to be held on Thursday, 4 July 2024. Thirty-two seats will be up for election in Wales as the general election will occur after the recently completed boundary review took effect.

References

  1. "London Borough Council Elections 13 May 1971" (PDF). London Datastore. Retrieved 25 December 2021.
  2. F. W. S. Craig (1984), British Parliamentary Election Results, 1974-1983. Chichester: Parliamentary Research Services.
  3. 1 2 "British Parliamentary Election results 1983-97: English Counties". www.election.demon.co.uk.
  4. "UK General Election results April 1992". Richard Kimber's Political Science Resources. Politics Resources. 9 April 1992. Archived from the original on 3 March 2016. Retrieved 6 December 2010.
  5. 1 2 "General Election Results 9 April 1992" (PDF). parliament.uk. Archived (PDF) from the original on 13 October 2010. Retrieved 14 June 2011.
  6. Morgan, Bryn (February 1999). "General Election Results, 1 May 1997" (PDF). Factsheet No. 68. House of Commons Information Office. Archived (PDF) from the original on 9 October 2022. Retrieved 1 April 2019.