Electricity sector in China

Last updated

Electricity sector of China
Bei Jing Nan Cai Yuan Chong Dian Zhan .jpg
Data
Installed capacity (2023)2919 GW
Production (2021)8.5 petawatt-hour (PWh)
China-electricity-prod-source-stacked.svg
China remains heavily dependent on coal for generation of electricity
1990- Electricity consumption - shares by region - IEA data.svg
By 2025, Asia is projected to account for half of the world’s electricity consumption, with one-third of global electricity to be consumed in China. [1]

China is the world's largest electricity producer, having overtaken the United States in 2011 after rapid growth since the early 1990s. In 2021, China produced 8.5 petawatt-hour (PWh) of electricity, approximately 30% of the world's electricity production. [2]

Contents

Most of the electricity in China comes from coal power, which accounted for 62% of electricity generation in 2021 [2] and is a big part of greenhouse gas emissions by China. Power generated from renewable energy has also been continuously increasing in the country, with national electricity generation from renewable energy reaching 594.7 TWh in Q1 2023, an increase of 11.4% year-on-year, including 342.2 TWh of wind and solar power, up 27.8% year-on-year. [3]

In 2023, China's total installed electric generation capacity was 2.92 TW, [4] of which 1.26 TW renewable, including 376 GW from wind power and 425 GW from solar power. [3] The rest was mostly coal capacity, with 1040 GW in 2019. [5] Nuclear also plays an increasing role in the national electricity sector. As of February 2023, China has 55 nuclear plants with 57 GW of power in operation, 22 under construction with 24 GW and more than 70 planned with 88 GW. About 5% of electricity in the country comes from nuclear energy. [6]

China has two wide area synchronous grids, the State Grid and the China Southern Power Grid. The northern power grids were synchronized in 2005. [7] Since 2011 all Chinese provinces are interconnected. The two grids are joined by HVDC back-to-back connections. [8]

China has abundant energy reserves with the world's fourth-largest coal reserves and massive hydroelectric resources. There is however a geographical mismatch between the location of the coal fields in the north-east (Heilongjiang, Jilin, and Liaoning) and north (Shanxi, Shaanxi, and Henan), hydropower in the south-west (Sichuan, Yunnan, and Tibet), and the fast-growing industrial load centers of the east (Shanghai-Zhejiang) and south (Guangdong, Fujian). [9] [ better source needed ]

History

In April 1996, an Electric Power Law was implemented, a major event in China's electric power industry. The law set out to promote the development of the electric power industry, to protect the legal rights of investors, managers, and consumers, and to regulate the generation, distribution, and consumption.

Before 1994 electricity supply was managed by electric power bureaus of the provincial governments. Now utilities are managed by corporations outside of the government administration structure.

To end the State Power Corporation's (SPC) monopoly of the power industry, China's State Council dismantled the corporation in December 2002 and set up 11 smaller companies. SPC had owned 46% of the country's electrical generation assets and 90% of the electrical supply assets. The smaller companies include two electric power grid operators, five electric power generation companies, and four relevant business companies. Each of the five electric power generation companies owns less than 20% (32 GW of electricity generation capacity) of China's market share for electric power generation. Ongoing reforms aim to separate power plants from power-supply networks, privatize a significant amount of state-owned property, encourage competition, and revamp pricing mechanisms. [10]

It is expected that the municipal electric power companies will be divided into electric power generating and electric power supply companies. A policy of competition between the different generators will be implemented in the next years.

South China from the Changjiang valley down to the South China Sea was the first part of the economy to liberalize in the 1980s and 1990s and is home to much of the country's most modern and often foreign-invested manufacturing industries. Northern and northeastern China's older industrial base has fallen behind, remains focused on the domestic economy, and has suffered a relative decline.

In recent history, China's power industry is characterized by fast growth and an enormous installed base. In 2014, it had the largest installed electricity generation capacity in the world with 1505 GW and generated 5583 TWh [11] China also has the largest thermal power capacity, the largest hydropower capacity, the largest wind power capacity and the largest solar capacity in the world. Despite an expected rapid increase in installed capacity scheduled in 2014 for both wind and solar, and an expected increase to 60 GW in nuclear by 2020, coal will still account for between 65% and 75% of capacity in 2020. [12]

In Spring 2011, according to The New York Times , shortages of electricity existed, and power outages should be anticipated. The government-regulated price of electricity had not matched rising prices for coal. [13]

In 2020, Chinese Communist Party general secretary Xi Jinping announced that China aims to go carbon-neutral by 2060 in accordance with the Paris climate accord. [14]

Production and capacity

1,000
2,000
3,000
4,000
5,000
6,000
7,000
8,000
9,000
10,000
2008
2009
2010
2011
2012
2013
2014
2015
2016
2017
2018
2019
2020
2021
2022
2023
  •   Wind
  •   Solar
  •   Hydro
  •   Biofuels and waste
  •   Nuclear
  •   Coal
  •   Oil
  •   Gas
  •   Fossil (Inc. Biomass)
Electricity production (GWh) in China by source, 2008–2023 [15] [16] [17] [18] [19] [20]
YearTotalFossilNuclearRenewableTotal
renewable
 % renewable
CoalOilGasHydroWindSolar PVBiofuelsWasteSolar thermalGeo-
thermal
Tide
20083,481,9852,743,76723,79131,02868,394585,18714,80015214,715001447615,00517.66%
20093,741,9612,940,75116,61250,81370,134615,64026,90027920,700001257663,65117.74%
20104,207,9933,250,40913,23669,02773,880722,17244,62269924,7509,06421257801,44119.05%
20114,715,7613,723,3157,78684,02286,350698,94570,3312,60431,50010,77061257814,28817.27%
20124,994,0383,785,0226,69885,68697,394872,10795,9786,34433,70010,968912571,019,23820.41%
20135,447,2314,110,8266,50490,602111,613920,291141,19715,45138,30012,3042610981,127,68620.70%
20145,678,9454,115,2159,517114,505132,5381,064,337156,07829,19544,43712,9563412581,307,17023.02%
20155,859,9584,108,9949,679145,346170,7891,130,270185,76645,22552,70011,0292712581,425,18024.32%
20166,217,9074,241,78610,367170,488213,2871,193,374237,07175,25664,70011,41329125111,581,97925.44%
20176,452,9004,178,2002,700203,200248,1001,194,700304,600117,80081,3001,700,00026.34%
20186,994,7004,482,9001,500215,500295,0001,232,100365,800176,90093,6001,868,40026.71%
20197,326,9004,553,8001,300232,500348,7001,302,100405,300224,000112,6002,044,00027.76%
20207,623,6004,629,60010,800252,500366,2001,355,200466,500261,10043,800135,5002,218,30029.09%
20218,395,9005,042,60012,200287,100407,5001,339,900655,800327,00050,200165,8002,488,50029.64%
20228,848,7105,888,790417,7801,352,200762,670427,2702,542,12028.73%
20239,456,4406,265,740434,7201,285,850885,870584,1502,755,88029.14%
Electricity production in China (TWh) [21]
TotalFrom coalCoal %
20042,2001,71378%
20073,2792,65681%
20083,4572,73379%
20093,6962,91379%
20104,2083,27378%
20114,7153,72479%
20124,9373,85078%
20135,3984,20078%
20145,5834,35478%
20155,6664,11573%
20165,9203,90666% [22]
20176,4534,17865%
20186,9954,48364%
20197,3274,55462%
20207,6234,92660.7%
20218,3955,04260%
excluding Hong Kong
ChinaEnergyPortal.org

China Energy Portal publishes Chinese energy policy, news, and statistics and provides tools for their translation into English. Translations on this site depend entirely on contributions from its readers. 2020 electricity & other energy statistics (preliminary) [23]

Source2019 [TWh]2020 [TWh]Change [%]
Total power production7,326.97,623.64.0
Hydro power1,302.11,355.24.1
Thermal power5,046.55,174.32.5
Nuclear power348.7366.25.0
Wind power405.3466.515.1
Solar power224261.116.6
Source2019 [GW]2020 [GW]Change [%]
Installed generation capacity2,010.062,200.589.5
Hydro power358.04370.163.4
Thermal power1,189.571,245.174.7
Nuclear power48.7449.892.4
Wind power209.15281.5334.6
Solar power204.18253.4324.1
Source2019 [MW]2020 [MW]Change [%]
Change in generation capacity105,000190,87081.8
Hydro power4,45013,230197.7
Thermal power44,23056,37027.4
Nuclear power4,0901,120−72.6
Wind power25,72071,670178.7
Solar power26,52048,20081.7

(Note that change in generation capacity is new installations minus retirements.)

National Bureau of Statistics of China

The official Statistics available in English are not all up to date. Numbers are given in "(100 million kw.h)" [24] which equals 100 GWh or 0.1 TWh.

Electricity Production by source20112012201320142015201620172018201920202021
Hydro Power6989.48721.19202.910728.811302.711840.511978.712317.913044.413552.113401
Thermal Power3833738928.142470.144001.142841.944370.74754650963.252201.553302.556463
Nuclear Power863.5973.91116.11325.41707.92132.92480.72943.6348136624075
Wind Power703.3959.814121599.81857.72370.72972.33659.7405746656556
Solar Power2663.4154.5292452.3752.611781769224026113270

Sources

Coal power

Coal-fired power plant in China ChineseCoalPower opt.jpg
Coal-fired power plant in China

Coal power in China is electricity generated from coal in China and is distributed by the State Power Grid Corporation. It is a big source of greenhouse gas emissions by China.

China's installed coal-based power generation capacity was 1080 GW in 2021, [25] about half the total installed capacity of power stations in China. [26] Coal-fired power stations generated 57% of electricity in 2020. [27] Over half the world's coal-fired power is generated in China. [28] 5 GW of new coal power was approved in the first half of 2021. [26] Quotas force utility companies to buy coal power over cheaper renewable power. [29] Carbon Tracker estimated in 2020 that the average coal fleet loss was about 4 USD/MWh and that about 60% of power stations were cashflow negative in 2018 and 2019. [30] According to 2020 analysis by Energy Foundation China, to keep warming to 1.5 degrees C all China's coal power without carbon capture must be phased out by 2045. [31] But in 2023 many new coal power stations were approved. [32] Coal power stations receive payments for their capacity. [33]

Retirement and addition of coal-fired power capacity
2000- Retired coal-fired power capacity - Global Energy Monitor.svg
The annual amount of coal plant capacity being retired increased into the mid-2010s. [34] However, the rate of retirement has since stalled, [34] and global coal phase-out is not yet compatible with the goals of the Paris Climate Agreement. [35]
2000- New coal-fired power capacity - Global Energy Monitor.svg
In parallel with retirement of some coal plant capacity, other coal plants are still being added, though the annual amount of added capacity has been declining since the 2010s. [36]
Coal is the main source of electricity but its share is declining Electricity generation in China by source.png
Coal is the main source of electricity but its share is declining

China is the largest producer and consumer of coal in the world and is the largest user of coal-derived electricity. Despite China (like other G20 countries) pledging in 2009 to end inefficient fossil fuel subsidies, as of 2020 there are direct subsidies and the main way coal power is favoured is by the rules guaranteeing its purchase – so dispatch order is not merit order. [37]

To curtail the continued rapid construction of coal fired power plants, strong action was taken in April 2016 by the National Energy Administration (NEA), which issued a directive curbing construction in many parts of the country. [38] This was followed up in January 2017 when the NEA canceled a further 103 coal power plants, eliminating 120 GW of future coal-fired capacity, despite the resistance of local authorities mindful of the need to create jobs. [39] The decreasing rate of construction is due to the realization that too many power plants had been built and some existing plants were being used far below capacity. [40] In 2020 over 40% of plants were estimated to be running at a net loss and new plants may become stranded assets. [37] In 2021 some plants were reported close to bankruptcy due to being forbidden to raise electricity prices in line with high coal prices. [41]

The think tank Carbon Tracker estimated the average loss was about US$4/MWh and that about 60% of power stations were cashflow negative in 2018 and 2019. [42] In 2020 Carbon Tracker estimated that 43% of coal-fired plants were already more expensive than new renewables and that 94% would be by 2025. [43] According to a 2020 analysis by Energy Foundation China, in order to keep warming to 1.5 degrees C coal plants without carbon capture must be phased out by 2045. [44] A 2021 study estimated that all coal power plants could be shut down by 2040, by retiring them at the end of their financial lifetime. [45]

In 2023 the Economist magazine wrote that ‘ Building a coal plant, whether it is needed or not, is also a common way for local governments to boost economic growth.’ and that ‘ They don’t like depending on each other for energy. So, for example, a province might prefer to use its own coal plant rather than a cleaner energy source located elsewhere.’ [46]

Hydropower

Liujiaxia Dam in Gansu 6058-Liujiaxia-Dam.jpg
Liujiaxia Dam in Gansu
The Three Gorges Dam is the largest power station (of any kind) in the world by installed capacity, with 22.5 GW. The Dam (2890371280).jpg
The Three Gorges Dam is the largest power station (of any kind) in the world by installed capacity, with 22.5 GW.

Hydroelectricity is currently China's largest renewable energy source and the second overall after coal. [47] China's installed hydro capacity in 2020 was 370 GW, [48] this is an increase of 51 GW over the 2015 number of 319 GW, and up from 172 GW in 2009, including pumped storage hydroelectricity capacity. In 2021, hydropower generated 1,300 TWh of power, accounting for 15% of China's total electricity generation. [2] In contrast, in 2015 hydropower generated 1,126 TWh of power, accounting for roughly 20% of China's total electricity generation. [49]

Due to China's insufficient reserves of fossil fuels and the government's preference for energy independence, hydropower plays a big part in the energy policy of the country. China's potential hydropower capacity is estimated at up to 600 GW, but currently, the technically exploitable and economically feasible capacity is around 500 GW.[ citation needed ] There is therefore the considerable potential for further hydro development. [47] The country has set a 350 GW capacity target for 2020. [47] Being flexible, existing hydropower can back up large amounts of solar and wind. [50]

Hydroelectric plants in China have relatively low productivity, with an average capacity factor of 31%, a possible consequence of rushed construction [47] and the seasonal variability of rainfall. Moreover, a significant amount of energy is lost due to the need for long transmission lines to connect the remote plants to where demand is most concentrated. [47]

Although hydroelectricity represents the largest renewable and low greenhouse gas emissions energy source in the country, the social and environmental impact of dam construction in China has been large, with millions of people forced to relocate and large scale damage to the environment. [51]

Wind power

Wind farm in Xinjiang, China Wind power plants in Xinjiang, China.jpg
Wind farm in Xinjiang, China
Wind farm in Xinjiang, China Wind farm xinjiang.jpg
Wind farm in Xinjiang, China

With its large land mass and long coastline, China has exceptional wind resources: [52] it is estimated China has about 2,380 GW of exploitable capacity on land and 200 GW on the sea. [53] At the end of 2021 there was 329 GW of Wind power in China proving 655,000 gigawatt-hours (GWh) of wind electricity to the grid [2] This contrast with the 114 GW of electricity generating capacity installed in China in 2014 [54] (although capacity of wind power is not on par with capacity of nuclear power). [55] In 2011, China's plan was to have 100 GW of wind power capacity by the end of 2015, with an annual wind generation of 190 terawatt-hours (TWh). [56]

China has identified wind power as a key growth component of the country's economy. [57]

Nuclear power

In terms of nuclear power generation, China will advance from a moderate development strategy to an accelerating development strategy. Nuclear power will play an even more important role in China's future power development. Especially in the developed coastal areas with heavy power loads, nuclear power will become the backbone of the power structure there. As of February 2023, China has 55 plants with 57 GW of power in operation, 22 under construction with 24 GW and more than 70 planned with 88 GW. About 5% of electricity in the country is due to nuclear energy. [6] These plants generated 417 TWh of electricity in 2022. [58] This percentage is expected to double every 10 years for several decades out. Plans are for 200 GW installed by 2030 which will include a large shift to Fast Breeder reactor and 1500 GW by the end of this century.

Solar power

China is the world's largest market for both photovoltaics and solar thermal energy. At the end of 2021 there was 306 GW of solar power in China proving 377,000 gigawatt-hours (GWh) of solar power electricity to the grid (out of total 7,770,000 GWh electricity power production. [2] In comparison, of the 7,623 TWh electricity produced in China in 2020, 261.1 TWh was generated by solar power, equivalent to 3.43% of total electricity production. [59] This was a 289% increase since 2016, when production was 67.4 TWh, [60] equivalent to an annual growth rate of 40.4%.

China has been the world's leading installer of solar photovoltaics since 2013 (see also growth of photovoltaics), and the world's largest producer of photovoltaic power since 2015. [61] [62] [63] In 2017 China was the first country to pass 100 GW of cumulative installed PV capacity. [64] However electricity prices are not properly varied by time of day, so do not properly incentivize system balancing. [65]

Solar water heating is also extensively implemented, with a total installed capacity of 290 GWth at the end of 2014, representing about 70% of world's total installed solar thermal capacity. [66] [67] The goal for 2050 is to reach 1,300GW of Solar Capacity. If this goal is to be reached it would be the biggest contributor to Chinese electricity demand. [68]

Natural gas

China produced 272 Twh of electricity from natural gas in 2021. [2]

China is a global powerhouse in the field of natural gas and one of the world's largest consumers and importers of natural gas. By the end of 2023, China's natural gas industry achieved major milestones, reflecting its important role in the country's energy transformation and its contribution to global natural gas market dynamics.

Natural gas factory in Suzhou, Jiangsu Jiangsu Suzhou Xiangcheng - Yuechengli area - Wangyu river IMG 7181 Huadian Wangting CCGT Power Plant.jpg
Natural gas factory in Suzhou, Jiangsu

In 2023, China's natural gas production will increase significantly, with the total volume reaching approximately 229.7 billion cubic meters. [69] This represents an increase of nearly 10 billion cubic meters per year and highlights China's efforts to increase domestic production and reduce reliance on imports. Despite the increase in domestic production, China remains the world's largest importer of liquefied natural gas (LNG), importing approximately 165.56 billion cubic meters of natural gas, of which LNG imports account for a large portion. [69] This import capacity strengthens China's key role in the international LNG market and reflects its strategic measures to ensure energy security and supply stability.

Natural gas demand also rebounded, with apparent consumption increasing to 388.82 billion cubic meters. The growth highlights the growing role of natural gas in China's energy mix, driven by its economic recovery and transition to clean energy. Natural gas import dependence is 40.9%, indicating a balance between domestic production and imports to meet the country's energy needs. [69]

Biomass and waste

Hanyang Guodingshan Waste to Energy Plant in Wuhan. Hanyang Guodingshan Waste to Energy Plant, Wuhan, China.JPG
Hanyang Guodingshan Waste to Energy Plant in Wuhan.

China produced 169 Twh of electricity from biomass, geothermal and other renewable sources of energy in 2021. [2]

Since the implementation of supportive policies beginning in 2006, investment and growth in the biomass power sector have accelerated. By 2019, investments had reached an impressive 150.2 billion yuan, climbing further to over 160 billion yuan by 2020, with more than 1,350 biomass projects underway across the country. This growth trajectory has been marked by a significant increase in installed capacity, which saw a record addition of 6,280 MW in 2019. Although the COVID-19 pandemic slightly slowed momentum in 2020, reducing the added capacity to 5,430 MW, the sector's growth trend continued upwards. [70]

Policy initiatives introduced in 2012 and 2016 have been pivotal in spurring the expansion of biomass power generation, leading to a substantial increase in power output. By 2019, biomass power generation had achieved a total output of 111,100 GWh, which further rose to 132,600 GWh in 2020, indicating robust year-on-year growth. [70]

Storage

Energy storage plays a critical role in China's energy landscape, serving as a key enabler for the large-scale integration of renewable energy sources, such as wind and solar power, into the national grid. By mitigating the variability and intermittency of renewable energy, storage technologies facilitate a more stable and reliable power supply. China has been investing heavily in various storage solutions, including battery storage systems, pumped hydro storage, and flywheel energy storage, among others. These technologies not only help in balancing supply and demand but also in improving the overall efficiency and resilience of the power system.

In 2023, China's energy storage industry saw a dramatic surge, with its capacity expanding nearly fourfold due to advancements in technologies such as lithium-ion batteries. This remarkable growth was fueled by an investment exceeding 100 billion yuan (around US$13.9 billion) in recent years. By the close of 2023, the capacity within the sector of new-type energy storage soared to 31.39 gigawatts (GW), achieving an increase of over 260% compared to the previous year and almost a tenfold rise since 2020. The sector encompasses a range of innovative technologies, including electrochemical energy storage, compressed air energy storage, flywheel energy storage, and thermal energy storage, while pumped hydro storage is not included in this category. [71]

Demand response

China's government has introduced a number of policies to promote the development of demand response, such as the 2012 "Interim Measures for the Management of Pilot Cities with Central Fiscal Funds to Support Electricity Demand Side Management." [72] The DR mechanism incentivizes electricity users to adjust their consumption patterns based on signals from grid operators, either reducing demand during peak hours (peak shaving) or increasing demand during off-peak hours (valley filling). This flexibility is critical to maintaining grid stability and ensuring efficient use of energy resources. [73]

China's approach to DR has included pilot projects in cities like Suzhou, Beijing, and Shanghai, focusing on tariff reforms and pricing strategies to encourage participation. Despite these efforts, challenges remain, such as the low participation rate of grid companies and the lack of transparency in grid operation data, hindering the widespread adoption of DR. [72]

The types of demand response in China are: [73]

Transmission infrastructure

Tibet Power is the company that manages power in Tibet, and is controlled by the State Grid Corporation. bod-ljongs-glog-shugs-kung-sis-bsgrgs / .jpg
Tibet Power is the company that manages power in Tibet, and is controlled by the State Grid Corporation.

The central government has made the creation of a unified national grid system a top economic priority to improve the efficiency of the whole power system and reduce the risk of localised energy shortages. It will also enable the country to tap the enormous hydro potential from western China to meet booming demand from the eastern coastal provinces. China is planning for smart grid and related Advanced Metering Infrastructure. [75]

Ultra-high-voltage transmission

The main problem in China is the voltage drop when power is sent over very long distances from one region of the country to another.

Long distance inter-regional transmission has been implemented by using ultra-high voltages (UHV) of 800 kV, based on an extension of technology already in use in other parts of the world. [76]

In 2015, State Grid Corporation of China proposed the Global Energy Interconnection, a long-term proposal to develop globally integrated smart grids and ultra high voltage transmission networks to connect over 80 countries. [77] :92–93 The idea is supported by President Xi Jinping and China in attempting to develop support in various internal forums, including UN bodies. [77] :92

Companies

In terms of the investment amount of China's listed power companies, the top three regions are Guangdong province, Inner Mongolia Autonomous Region and Shanghai, whose investment ratios are 15.33%, 13.84% and 10.53% respectively, followed by Sichuan and Beijing.

China's listed power companies invest mostly in thermal power, hydropower and thermoelectricity, with their investments reaching CNY216.38 billion, CNY97.73 billion, and CNY48.58 billion respectively in 2007. Investment in gas exploration and coal mining follow as the next prevalent investment occurrences.

Major players in China's electric power industry include:

The five majors, and their listed subsidiaries: The five majors are all SOEs directly administered by SASAC. [78] Their listed subsidiaries are substantially independent, hence counted as IPPs, and are major power providers in their own right. Typically each of the big 5 has about 10% of national installed capacity, and their listed subsidiary has an extra 4 or 5% on top of that.

parent of Datang International Power Generation Company (SEHK: 991; SSE: 601991)
parent of GD Power Development Company (SSE: 600795),
parent of Huadian Power International Co., Ltd.
parent of Huaneng Power International (NYSE:HNP)
parent of China Power International Development Limited ("CPID", 2380.HK)

Additionally, two other SOEs also have listed IPP subsidiaries:

parent of China Shenhua Energy Company (SEHK: 1088, SSE: 601088)
parent of China Resources Power Holdings Company Limited ("CRP", SEHK: 836)

Secondary companies:

Nuclear and hydro:

Grid operators include:

Creation of a spot market has been suggested to properly use energy storage. [81]

Consumption and territorial differences

More than a third of electricity is used by industry. [82] China consists of three largely self-governing territories: the mainland, Hong Kong, and Macau. The introduction of electricity to the country was not coordinated between the territories, leading to partially different electrical standards. Mainland China uses type A and I power plugs with 220 V and 50 Hz; Hong Kong and Macau both use type G power plugs with 220 V and 50 Hz. Inter-territorial travelers may therefore require a power adapter.

Related Research Articles

India is the third largest producer of electricity in the world. During the fiscal year (FY) 2022–23, the total electricity generation in the country was 1,844 TWh, of which 1,618 TWh was generated by utilities.

<span class="mw-page-title-main">Energy in Japan</span> Overview of the production, consumption, import and export of energy and electricity in Japan

Japan is a major consumer of energy, ranking fifth in the world by primary energy use. Fossil fuels accounted for 88% of Japan's primary energy in 2019. Japan imports most of its energy due to scarce domestic resources. As of 2022, the country imports 97% of its oil and is the larger LNG importer globally.

<span class="mw-page-title-main">Energy in the United Kingdom</span> Overview of the energy use of the United Kingdom

Energy in the United Kingdom came mostly from fossil fuels in 2021. Total energy consumption in the United Kingdom was 142.0 million tonnes of oil equivalent in 2019. In 2014, the UK had an energy consumption per capita of 2.78 tonnes of oil equivalent compared to a world average of 1.92 tonnes of oil equivalent. Demand for electricity in 2014 was 34.42 GW on average coming from a total electricity generation of 335.0 TWh.

<span class="mw-page-title-main">Energy in the United States</span>

Energy in the United States is obtained from a diverse portfolio of sources, although the majority came from fossil fuels in 2021, as 36% of the nation's energy originated from petroleum, 32% from natural gas, and 11% from coal. Electricity from nuclear power supplied 8% and renewable energy supplied 12%, which includes biomass, wind, hydro, solar and geothermal.

<span class="mw-page-title-main">Energy in Brazil</span> Overview of the production, consumption, import and export of energy and electricity in Brazil

Brazil is the 7th largest energy consumer in the world and the largest in South America. At the same time, it is an important oil and gas producer in the region and the world's second largest ethanol fuel producer. The government agencies responsible for energy policy are the Ministry of Mines and Energy (MME), the National Council for Energy Policy (CNPE), the National Agency of Petroleum, Natural Gas and Biofuels (ANP) and the National Agency of Electricity (ANEEL). State-owned companies Petrobras and Eletrobras are the major players in Brazil's energy sector, as well as Latin America's.

For solar power, South Asia has the ideal combination of both high solar insolation and a high density of potential customers.

<span class="mw-page-title-main">Renewable energy in China</span>

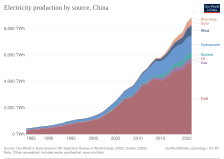
China is the world's leader in electricity production from renewable energy sources, with over triple the generation of the second-ranking country, the United States. China's renewable energy sector is growing faster than its fossil fuels and nuclear power capacity, and is expected to contribute 43% of global renewable capacity growth. China's total renewable energy capacity exceeded 1,000 GW in 2021, accounting for 43.5 per cent of the country's total power generation capacity, 10.2 percentage points higher than in 2015. The country aims to have 80 per cent of its total energy mix come from non-fossil fuel sources by 2060, and achieve a combined 1,200 GW of solar and wind capacity by 2030. In 2023, it was reported that China was on track to reach 1,371 gigawatts of wind and solar by 2025, five years ahead of target due to new renewables installations breaking records.

<span class="mw-page-title-main">Low-carbon electricity</span> Power produced with lower carbon dioxide emissions

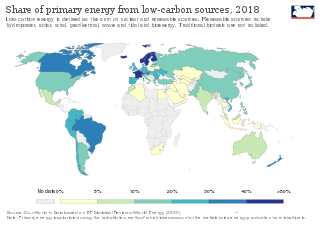
Low-carbon electricity or low-carbon power is electricity produced with substantially lower greenhouse gas emissions over the entire lifecycle than power generation using fossil fuels. The energy transition to low-carbon power is one of the most important actions required to limit climate change.

<span class="mw-page-title-main">Renewable energy in India</span>

India is the world's 4th largest consumer of electricity and the world's 3rd largest renewable energy producer with 40% of energy capacity installed in the year 2022 coming from renewable sources. Ernst & Young's (EY) 2021 Renewable Energy Country Attractiveness Index (RECAI) ranked India 3rd behind USA and China. In FY2023-24, India is planning to issue 50 GW tenders for wind, solar and hybrid projects. India has committed for a goal of 500 GW renewable energy capacity by 2030. In line with this commitment, India's installed renewable energy capacity has been experiencing a steady upward trend. From 94.4 GW in 2021, the capacity has gone up to 119.1 GW in 2023 as of Q4.

Energy in Ethiopia includes energy and electricity production, consumption, transport, exportation, and importation in the country of Ethiopia.

There is a large array of stakeholders that provide services through electricity generation, transmission, distribution and marketing for industrial, commercial, public and residential customers in the United States. It also includes many public institutions that regulate the sector. In 1996, there were 3,195 electric utilities in the United States, of which fewer than 1,000 were engaged in power generation. This leaves a large number of mostly smaller utilities engaged only in power distribution. There were also 65 power marketers. Of all utilities, 2,020 were publicly owned, 932 were rural electric cooperatives, and 243 were investor-owned utilities. The electricity transmission network is controlled by Independent System Operators or Regional Transmission Organizations, which are not-for-profit organizations that are obliged to provide indiscriminate access to various suppliers to promote competition.

<span class="mw-page-title-main">Energy in Austria</span> Overview of the production, consumption, import and export of energy and electricity in Austria

Energy in Austria describes energy and electricity production, consumption and import in Austria. Austria is very reliant on hydro as an energy source, supported by imported oil and natural gas supplies. It is planned by 2030 to become 100% electricity supplied by renewable sources, primarily hydro, wind and solar.

<span class="mw-page-title-main">Electricity in Britain</span> Overview of the electricity sector in Britain

The National Grid covers most of mainland Great Britain and several of the surrounding islands, and there are interconnectors to Northern Ireland and to other European countries. Power is supplied to consumers at 230 volts AC with a frequency of 50 Hz. In 2023 about a third of electricity used in Britain was generated from fossil gas and two-thirds was low-carbon power. Wind generates the most low-carbon power, followed by nuclear some of which is imported from France. The government is aiming for greenhouse gas emissions from electricity in Britain to be net zero by 2035.

<span class="mw-page-title-main">Electricity sector in Japan</span> Overview of the electricity sector in Japan

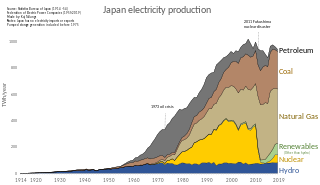
The electric power industry in Japan covers the generation, transmission, distribution, and sale of electric energy in Japan. Japan consumed approximately 918 terawatt-hours (TWh) of electricity in 2014. Before the 2011 Fukushima Daiichi nuclear disaster, about a quarter of electricity in the country was generated by nuclear power. In the following years, most nuclear power plants have been on hold, being replaced mostly by coal and natural gas. Solar power is a growing source of electricity, and Japan has the third largest solar installed capacity with about 50 GW as of 2017. Japan's electricity production is characterized by a diverse energy mix, including nuclear, fossil fuels, renewable energy, and hydroelectric power.

The Polish energy sector is the fifth largest in Europe. In 2023, the country consumed 167.52 TWh of electricity, a 3.44% year–on–year decrease from 2022. Out of this, 76.61 TWh came from hard coal, 34.57 TWh from lignite, 22 TWh from wind energy, and 13.65 TWh from gas, with the remainder coming from other sources, such as solar, biomass, and hydropower.

<span class="mw-page-title-main">Energy in Spain</span> Overview of the production, consumption, import and export of energy and electricity in Spain

Primary energy consumption in Spain in 2020 was mainly composed of renewable sources. The largest sources are petroleum (42.3%), natural gas (19.8%) and coal (11.6%). The remaining 26.3% is accounted for by nuclear energy (12%) and different renewable energy sources (14.3%). Domestic production of primary energy includes nuclear (44,8%), solar, wind and geothermal (22,4%), biomass and waste (21,1%), hydropower (7,2%) and fossil (4,5%).

<span class="mw-page-title-main">Renewable energy in Turkey</span>

Renewables supply a quarter of energy in Turkey, including heat and electricity. Some houses have rooftop solar water heating, and hot water from underground warms many spas and greenhouses. In parts of the west hot rocks are shallow enough to generate electricity as well as heat. Wind turbines, also mainly near western cities and industry, generate a tenth of Turkey’s electricity. Hydropower, mostly from dams in the east, is the only modern renewable energy which is fully exploited. Hydropower averages about a fifth of the country's electricity, but much less in drought years. Apart from wind and hydro, other renewables; such as geothermal, solar and biogas; together generated almost a tenth of Turkey’s electricity in 2022. Türkiye has ranked 5th in Europe and 12th in the world in terms of installed capacity in renewable energy. The share of renewables in Türkiye’s installed power reached to 54% at the end of 2022.

<span class="mw-page-title-main">Electricity sector in Turkey</span> Electricity generation, transmission and consumption in Turkey

Turkey uses more electricity per person than the global average, but less than the European average, with demand peaking in summer due to air conditioning. Most electricity is generated from coal, gas and hydropower, with hydroelectricity from the east transmitted to big cities in the west. Electricity prices are state-controlled, but wholesale prices are heavily influenced by the cost of imported gas.

<span class="mw-page-title-main">Hydroelectricity in China</span>

Hydroelectricity is currently China's largest renewable energy source and the second overall after coal. According to the International Hydropower Association, China is the worlds largest producer of hydroelectricity as of 2021. China's installed hydroelectric capacity in 2021 was 390.9 GW, including 36.4 GW of pumped storage hydroelectricity capacity, up from 233 GW in 2011. That year, hydropower generated 1,300 TWh of power, an increase of 68 TWh over 2018 when hydropower generated 1,232 TWh of power, accounting for roughly 18% of China's total electricity generation.

Myanmar had a total primary energy supply (TPES) of 16.57 Mtoe in 2013. Electricity consumption was 8.71 TWh. 65% of the primary energy supply consists of biomass energy, used almost exclusively (97%) in the residential sector. Myanmar’s energy consumption per capita is one of the lowest in Southeast Asia due to the low electrification rate and a widespread poverty. An estimated 65% of the population is not connected to the national grid. Energy consumption is growing rapidly, however, with an average annual growth rate of 3.3% from 2000 to 2007.

References

  1. "Electricity Market Report 2023" (PDF). IEA.org. International Energy Agency. February 2023. p. 15. Archived (PDF) from the original on 15 March 2023. Licensed CC BY 4.0.
  2. 1 2 3 4 5 6 7 https://www.bp.com/content/dam/bp/business-sites/en/global/corporate/pdfs/energy-economics/statistical-review/bp-stats-review-2022-full-report.pdf
  3. 1 2 "China's first desert-based green power plant on grid - Chinadaily.com.cn" (in Chinese). Global.chinadaily.com.cn. 28 April 2023. Retrieved 5 June 2023.
  4. "China's installed solar power capacity rises 55.2% in 2023". Reuters .
  5. "Corrected-China to cap 2020 coal-fired power capacity at 1,100 GW". Reuters. 18 June 2020. Retrieved 5 January 2021.[ permanent dead link ]
  6. 1 2 "How Long Will It Take For China's Nuclear Power To Replace Coal?". Forbes.com. Retrieved 5 June 2023.
  7. Wu, Wei; He, Zhao; Guo, Qiang (June 2005). "China power grid and its future development". IEEE Power Engineering Society General Meeting, 2005. pp. 1533–1535. doi:10.1109/pes.2005.1489157. ISBN   0-7803-9157-8. S2CID   30004029.
  8. Zhenya, Liu (28 August 2015). Global energy interconnection. Academic Press. p. 45. ISBN   9780128044063. After the completion and commissioning of Tibet's ±400 kV DC interconnected power grid in December 2011, China has achieved nationwide interconnections covering all its territories other than Taiwan.
  9. Kambara, Tatsu (1992). "The Energy Situation in China". The China Quarterly. 131 (131): 608–636. doi:10.1017/S0305741000046312. ISSN   0305-7410. JSTOR   654899. S2CID   154871503.
  10. "BuyUSA.gov Home". Archived from the original on 20 June 2010. Retrieved 11 July 2021.
  11. "The World Factbook". cia.gov. Retrieved 1 February 2016.
  12. "China and Electricity Overview – The Energy Collective". Theenergycollective.com. Archived from the original on 1 July 2018. Retrieved 1 February 2016.
  13. Bradsher, Keith (24 May 2011). "China's Utilities Cut Energy Production, Defying Beijing". The New York Times . Retrieved 25 May 2011. Balking at the high price of coal that fuels much of China's electricity grid, the nation's state-owned utility companies are defying government economic planners by deliberately reducing the amount of electricity they produce.
  14. "China Solar Stocks Are Surging After Xi's 2060 Carbon Pledge". Bloomberg.com. 8 October 2020. Retrieved 5 January 2021.
  15. "IEA – Report". www.iea.org. Retrieved 23 September 2017.
  16. "2020 electricity & other energy statistics (preliminary)". China Energy Portal | 中国能源门户. 22 January 2021. Retrieved 19 May 2021.
  17. "2019 detailed electricity statistics (update of Jan 2021)". China Energy Portal | 中国能源门户. 20 January 2021. Retrieved 19 May 2021.
  18. "中国电力企业联合会网-中国最大的行业门户网站". www.cec.org.cn. Retrieved 5 January 2022.
  19. "中华人民共和国2022年国民经济和社会发展统计公报 - 国家统计局". www.stats.gov.cn. Retrieved 29 February 2024.
  20. "中华人民共和国2023年国民经济和社会发展统计公报 - 国家统计局". www.stats.gov.cn. Retrieved 29 February 2024.
  21. IEA Key World Energy Statistics 2015, 2012, 2011, 2010, 2009 Archived 7 October 2013 at the Wayback Machine , 2006 Archived 12 October 2009 at the Wayback Machine IEA coal production p. 15, electricity p. 25 and 27
  22. "China's renewable energy revolution continues on its long march". Energypost.eu. Retrieved 1 February 2017.
  23. Published on: 22 January 2021 https://chinaenergyportal.org/en/2020-electricity-other-energy-statistics-preliminary/
  24. "National Data" (in Chinese). Data.stats.gov.cn. Retrieved 5 June 2023.
  25. "Chinese coal plant approvals slum after Xi climate pledge". South China Morning Post. 25 August 2021. Retrieved 6 September 2021.
  26. 1 2 Yihe, Xu (1 September 2021). "China curbs coal-fired power expansion, giving way to renewables | Upstream Online". Upstream Online. Retrieved 6 September 2021.
  27. Cheng, Evelyn (29 April 2021). "China has 'no other choice' but to rely on coal power for now, official says". CNBC. Retrieved 6 September 2021.
  28. "China generated half of global coal power in 2020: study". dw.com. 29 March 2021. Retrieved 6 September 2021.
  29. "Why China is struggling to wean itself from coal". www.hellenicshippingnews.com. Retrieved 6 September 2021.
  30. Gray, Matt; Sundaresan, Sriya (April 2020). Political decisions, economic realities: The underlying operating cashflows of coal power during COVID-19 (Report). Carbon Tracker. p. 19.
  31. China's New Growth Pathway: From the 14th Five-Year Plan to Carbon Neutrality (PDF) (Report). Energy Foundation China. December 2020. p. 24. Archived from the original (PDF) on 16 April 2021. Retrieved 16 December 2020.
  32. "China's new coal power spree continues as more provinces jump on the bandwagon". Centre for Research on Energy and Clean Air. 29 August 2023. Retrieved 19 January 2024.
  33. Lushan, Huang (23 November 2023). "China's new capacity payment risks locking in coal". China Dialogue. Retrieved 19 January 2024.
  34. 1 2 "Retired Coal-fired Power Capacity by Country / Global Coal Plant Tracker". Global Energy Monitor. 2023. Archived from the original on 9 April 2023. — Global Energy Monitor's Summary of Tables (archive)
  35. "Boom and Bust Coal / Tracking the Global Coal Plant Pipeline" (PDF). Global Energy Monitor. 5 April 2023. p. 3. Archived (PDF) from the original on 7 April 2023.
  36. "New Coal-fired Power Capacity by Country / Global Coal Plant Tracker". Global Energy Monitor. 2023. Archived from the original on 19 March 2023. — Global Energy Monitor's Summary of Tables (archive)
  37. 1 2 "China's Carbon Neutral Opportunity" (PDF). Archived (PDF) from the original on 28 February 2021.
  38. Feng, Hao (7 April 2016). "China Puts an Emergency Stop on Coal Power Construction". The Diplomat.
  39. "China Cancels 103 Coal Plants, Mindful of Smog and Wasted Capacity". New York Times. 18 January 2017.
  40. "Asian coal boom: climate threat or mirage?". Energy and Climate Intelligence Unit. 22 March 2016. Archived from the original on 24 April 2016. Retrieved 14 February 2018.
  41. "Beijing power companies close to bankruptcy petition for price hikes". South China Morning Post. 10 September 2021. Retrieved 12 September 2021.
  42. Gray, Matt; Sundaresan, Sriya (April 2020). Political decisions, economic realities: The underlying operating cashflows of coal power during COVID-19 (Report). Carbon Tracker. p. 19.
  43. How to Retire Early: Making accelerated coal phaseout feasible and just (Report). Carbon Tracker. June 2020.
  44. China's New Growth Pathway: From the 14th Five-Year Plan to Carbon Neutrality (PDF) (Report). Energy Foundation China. December 2020. p. 24.
  45. Kahrl, Fredrich; Lin, Jiang; Liu, Xu; Hu, Junfeng (24 September 2021). "Sunsetting coal power in China". iScience. 24 (9): 102939. Bibcode:2021iSci...24j2939K. doi:10.1016/j.isci.2021.102939. ISSN   2589-0042. PMC   8379489 . PMID   34458696.
  46. "Will China save the planet or destroy it?". The Economist. ISSN   0013-0613 . Retrieved 21 January 2024.
  47. 1 2 3 4 5 Walker, Qin (29 July 2015). "The Hidden Costs of China's Shift to Hydropower". The Diplomat. Retrieved 1 November 2016.
  48. https://assets-global.website-files.com/5f749e4b9399c80b5e421384/60c2207c71746c499c0cd297_2021%20Hydropower%20Status%20Report%20-%20International%20Hydropower%20Association%20Reduced%20file%20size.pdf
  49. "China | International Hydropower Association". www.hydropower.org. Retrieved 1 November 2016.
  50. "China's Carbon Neutral Opportunity" (PDF). Archived (PDF) from the original on 28 February 2021.
  51. Hvistendahl, Mara. "China's Three Gorges Dam: An Environmental Catastrophe?". Scientific American. Retrieved 1 November 2016.
  52. Oceans of Opportunity: Harnessing Europe’s largest domestic energy resource pp. 18–19. Ewea.org
  53. Wind provides 1.5% of China's electricity Wind Power Monthly, 5 December 2011
  54. "Global Wind Statistics 2014" (PDF). Gwec.net. Retrieved 24 August 2017.
  55. "China was world's largest wind market in 2012". Renewable Energy World. 4 February 2013. Archived from the original on 5 November 2013. Retrieved 5 November 2013.
  56. "China revises up 2015 renewable energy goals: report". Reuters. 29 August 2011. Retrieved 24 August 2017.
  57. Gow, David (3 February 2009). "Wind power becomes Europe's fastest growing energy source". The Guardian . London. Retrieved 31 January 2010.
  58. "PRIS - Country Details". Pris.iaea.org. Retrieved 5 June 2023.
  59. "2020 electricity & other energy statistics (preliminary) – China Energy Portal". 22 January 2021.
  60. "2017 electricity & other energy statistics – China Energy Portal – 中国能源门户". 6 February 2018.
  61. "China's solar capacity overtakes Germany in 2015, industry data show". Reuters. 21 January 2016 via www.reuters.com.
  62. "China Overtakes Germany to Become World's Leading Solar PV Country". 22 January 2016.
  63. "China Installed 18.6 GW of Solar PV in 2015, but Was All of It Connected?". 7 July 2016.
  64. "China Is Adding Solar Power at a Record Pace". Bloomberg.com. 19 July 2017. Retrieved 1 August 2017.
  65. "Why China's energy transition is so difficult". OMFIF. 11 April 2022. Retrieved 13 April 2022.
  66. China's Big Push for Renewable Energy
  67. "Solar Heat Worldwide 2014" (PDF). www.iea-shc.org. IEA Solar Heating & Cooling Programme. Retrieved 13 June 2016.
  68. Yang, X. Jin; Hu, Hanjun; Tan, Tianwei; Li, Jinying (2016). "China's renewable energy goals by 2050". Environmental Development. 20: 83–90. Bibcode:2016EnvDe..20...83Y. doi:10.1016/j.envdev.2016.10.001.
  69. 1 2 3 Gao, Yun; Wang, Bei; Hu, Yidan; Gao, Yujie; Hu, Aolin (25 February 2024). "Development of China's natural gas: Review 2023 and outlook 2024". Natural Gas Technology and Economy. 44 (2): 166–177.
  70. 1 2 Guo, Hong; Cui, Jie; Li, Junhao (1 November 2022). "Biomass power generation in China: Status, policies and recommendations". Energy Reports. 2022 The 5th International Conference on Electrical Engineering and Green Energy. 8: 687–696. Bibcode:2022EnRep...8R.687G. doi: 10.1016/j.egyr.2022.08.072 . ISSN   2352-4847.
  71. "China's energy storage capacity using new tech almost quadrupled in 2023: NEA". South China Morning Post. 26 January 2024. Retrieved 27 February 2024.
  72. 1 2 Li, Weilin; Xu, Peng; Lu, Xing; Wang, Huilong; Pang, Zhihong (1 November 2016). "Electricity demand response in China: Status, feasible market schemes and pilots". Energy. 114: 981–994. Bibcode:2016Ene...114..981L. doi:10.1016/j.energy.2016.08.081. ISSN   0360-5442.
  73. 1 2 3 "China's Demand Response in Action". www.integralnewenergy.com. Retrieved 27 February 2024.
  74. "Demand Response in China". China Energy Storage Alliance. 24 June 2015. Retrieved 27 February 2024.
  75. Areddy, James (29 September 2010). "China Wants Smart Grid, But Not Too Smart". WSJ. Retrieved 1 February 2016.
  76. Paul Hu: A New Energy Network: HVDC Development in China, September 2016
  77. 1 2 Curtis, Simon; Klaus, Ian (2024). The Belt and Road City: Geopolitics, Urbanization, and China's Search for a New International Order. New Haven and London: Yale University Press. doi:10.2307/jj.11589102. ISBN   9780300266900. JSTOR   jj.11589102.
  78. "中央企业_国务院国有资产监督管理委员会". Sasac.gov.cn. Retrieved 1 February 2016.
  79. "SDIC Power Homepage". Sdicpower.com. Retrieved 24 August 2017.
  80. "SDIC Power Holdings Co Ltd: SHA:600886 quotes & news – Google Finance". Google.com. Retrieved 1 February 2016.
  81. Kahrl, Fredrich; Lin, Jiang; Liu, Xu; Hu, Junfeng (24 September 2021). "Sunsetting coal power in China". iScience. 24 (9): 102939. Bibcode:2021iSci...24j2939K. doi:10.1016/j.isci.2021.102939. ISSN   2589-0042. PMC   8379489 . PMID   34458696.
  82. "Beijing power companies close to bankruptcy petition for price hikes". South China Morning Post. 10 September 2021. Retrieved 12 September 2021.

Further reading