Energy in Belgium describes energy and electricity production, consumption and import in Belgium.
It is governed by the energy policy of Belgium, which is divided between several levels of government. For example, regional governments are responsible for awarding green certificates (except for offshore wind parks) while the national government is responsible for all nuclear power. As a member country of the European Union Belgium also complies with its energy policy.
Belgium is heavily reliant on ageing nuclear reactors and gas powered generators, although renewables (especially wind power) are generating an increasing percentage of electricity consumed.
The energy plan for Brussels is for it to be carbon neutral by 2050, with emissions down by 40% in 2030, 67% in 2040 and 90% in 2050 compared to 2005. [1] Belgium as a whole has a target of a 55% reduction in emissions by 2030. [2]
|
|
|
CO2 emissions: |
Primary energy is the amount of extractable energy present in fuels as they are found in nature. It is often expressed in tonnes of oil equivalent (toe) or watt-hour (Wh). Unless stated otherwise the lower heating value is used in the remainder of this text. A portion of primary energy is converted into other forms before it is used, depending on the energy conversion efficiency of the installation and method employed. This number differs significantly from the final energy as consumed by end users.
In 2021, crude oil was imported mainly from the Netherlands. [4]
Natural gas net imports are mainly from the Netherlands and Norway in 2021. [5]
Electrabel is main producer of electricity, followed by EDF Luminus.
Short term trading is done via the Belpex energy exchange, which is now part of APX-ENDEX. The Belgian transmission grid, operated by Elia System Operator, has a central position in the Synchronous grid of Continental Europe. This allows Belgium to trade electricity with its neighbours. Although currently there are only physical connections with the Netherlands and France, links with Germany (Alegro) and the United Kingdom (Nemo) are planned. Currently a maximum of 3500 MW can be imported. [6] In comparison, the net installed generation capacity in Belgium is estimated to be 19,627 MW. [7]
According to the GEMIX report the potential of renewable energy sources is 17 TWh per year. [8]
Nuclear power typically contributes between 50% and 60% of the electricity produced domestically (50.4% in 2010).
Belgium has two nuclear power plants:
By law [9] the nuclear power plants are to be phased-out. Two reactors (Doel 3 and Tihange 2) were closed in 2012; however the government has extended the life of the remaining five. The lifetime of one old reactor was extended to 2025; and in 2023, because of the Russian invasion of Ukraine, it was agreed to extend the life of Doel 4 and Tihange 3 reactors to 2035. [10]
The use of coal in thermal power plants has been decreasing. In 2000 coal was still used to produce 14.25% of electricity, [11] by 2006 this had dropped to about 10%; and in 2010 it was down to 6.3%. The last conventional coal units of the thermal power plants in Mol and Kallo were closed in March 2016. [12]
In 2022 gas accounted for 24.4% of gross electricity generated, with coal at 0.04%. [13] Fluxys is the main operator in natural gas transmission.
Several power stations use a combined cycle including: Drogenbos, Amercoeur , Tessenderlo. Building permits are being processed for plants in Seneffe and Visé.
At the end of 2011 Belgium had a distillation capacity 41 Mt. That year 72% of the capacity was used. [14]
Achievement | Year | Achievement | Year | Achievement | Year |
---|---|---|---|---|---|
5% | 2007 | 10% | 2018 | 15% | not achieved [3] |
Renewable energy includes wind, solar, biomass and geothermal energy sources.
In 2000, renewable energy (including biomass) was used for producing 0.95% of the 78.85 TWh of electricity produced domestically [11] This had risen to 13.01% in 2021. [15]
On 11 May 2022 7,112 MW was generated by combined wind and solar energy production. [16]
Parts of this article (those related to this section) need to be updated.(October 2023) |
At the start of 2012, there were 498 operational wind turbines in Belgium, with a capacity of 1080 MW. [17] The amount of electricity generated from wind energy has surpassed 2 TWh per year. [18] By 2021 wind power accounted for 19% of Belgium’s installed power generation capacity and 11% of total power generation.
There are seven large-scale offshore wind farm projects. Northwind (216MW), Thorntonbank Wind Farm (325 MW), Belwind Wind Farm (330 MW) are operational. The others are in various stages of planning.
EU and Belgium Wind Energy Capacity (MW) [19] [20] [21] [22] [23] [24] | ||||||||||||||||||||
---|---|---|---|---|---|---|---|---|---|---|---|---|---|---|---|---|---|---|---|---|
No | Country | 2016 | 2015 | 2014 | 2013 | 2012 | 2011 | 2010 | 2009 | 2008 | 2007 | 2006 | 2005 | 2004 | 2003 | 2002 | 2001 | 2000 | 1999 | 1998 |
– | EU-27 | 153,730 | 141,726 | 128,751 | 117,384 | 105,696 | 93,957 | 84,074 | 74,767 | 64,712 | 56,517 | 48,069 | 40,511 | 34,383 | 28,599 | 23,159 | 17,315 | 12,887 | 9,678 | 6,453 |
15 | Belgium | 2,386 | 2,218 | 1,959 | 1,665 | 1,375 | 1,078 | 911 | 563 | 415 | 287 | 194 | 167 | 96 | 68 | 35 | 32 | 13 | 6 | 6 |
The exploitation of Solar power is on the rise in Belgium. In 2021 solar accounted for 27% of Belgium’s power generation capacity and 6% of total power generation. [25]
Year | Photovoltaics [26] [27] [28] [29] [30] | |||
---|---|---|---|---|
MWp | GWh | Ref | ||
2008 | 71 | n.a | ||
2009 | 574 | 488 | ||
2010 | 787 | 560 | ||
2011 | 2,051 | 1,170 | ||
2012 | 2,768 | 2,115 | ||
2013 | 2,983 | 2,352 | ||
2014 | 3,140 | 2,883 | ||
2015 | 3,252 | 3,045 | [31] | |
2016 | 3,561 | 3,086 | [32] | |
2017 | 3,846 | 3,149 | [32] | |
2018 | 4,254 | 3,563 | ||
Source: Photovoltaic Barometer |
In 2009, biomass and biogas were used to generate 3.5 TWh or 3.8% of gross domestic electricity production.
In 2010 5.07 million tonnes of waste was produced in Belgium, of which 1.75 Mt was incinerated. Nearly always (99.8% of the time) energy was recovered during incineration. Non renewable waste was used for producing 1.4% of the gross domestic electricity production. 1.9 Mt was recycled and 1 Mt was composted or fermented; only 0.062 Mt was dumped. [33] Ten years earlier this was only 0.71%. [11]
Belgium has two pumped storage hydroelectric power stations: Coo-Trois-Ponts (1164 MW) and Plate-Taille (143 MW). Pumped storage stations are a net consumer of electricity, but they contributed 1.4% to the gross electricity production in 2010.
Despite the limited potential there are also a number of stations generating hydroelectric power. With a combined capacity of about 100 MW. Contributing 0.3% of gross domestic production in 2010.
Almost all of this capacity is realised in the Walloon Region. Even though hydroelectric power was used extensively in Flanders prior to the industrial revolution, there are no rivers where it can be generated on a large scale. [34] The region's 15 installations have a combined capacity just shy of 1 MW (994 kW). [35]
Parts of this article (those related to this section) need to be updated.(October 2023) |
In 2010 the largest share (34%) of final energy was for domestic use (this includes: households, service sector, commerce, and agriculture). Transport and industrial sector both consumed about a quarter. Fossil fuels are also used as raw material in several manufacturing processes, this non-energetic use accounts for the remainder of the final energy.
A more detailed picture of the energy and type of fuel used by various activities is given in the table below.
final energy by activity(ktoe) [36] | ||||||||
---|---|---|---|---|---|---|---|---|
Electricity | Natural gas | Coal | Oil | Renewable | Heat | Total | Share of final energy | |
Domestic usage (2009) | ||||||||
Households | 1738 | 3322 | 264 | 2756 | 231 | 13 | 8324 | 20.2% |
Commerce and services | 1847 | 1728 | 952 | 9 | 69 | 4605 | 11.2% | |
Agriculture | 88 | 235 | 433 | 35 | 25 | 816 | 2.0% | |
Other | 9 | 9 | 46 | 64 | 0.2% | |||
Industrial usage (2009) | ||||||||
Chemical | 746 | 1979 | 13 | 149 | 18 | 370 | 3275 | 7.9% |
Iron and steel | 447 | 678 | 578 | 11 | 1714 | 4.2% | ||
Non metal minerals | 168 | 290 | 202 | 269 | 94 | 1023 | 2.5% | |
Food/beverage/tobacco | 400 | 531 | 56 | 51 | 18 | 30 | 1086 | 2.6% |
Printing/paper pulp | 205 | 148 | 33 | 15 | 307 | 50 | 758 | 1.8% |
Construction | 110 | 197 | 63 | 3 | 370 | 0.9% | ||
Non ferro metals | 114 | 96 | 22 | 111 | 343 | 0.8% | ||
Machinery | 151 | 66 | 2 | 17 | 2 | 238 | 0.6% | |
Textile and leather | 108 | 97 | 3 | 1 | 3 | 212 | 0.5% | |
Transportation items | 87 | 92 | 4 | 183 | 0.4% | |||
Wood | 67 | 9 | 103 | 179 | 0.4% | |||
Extractive industries | 54 | 11 | 65 | 0.2% | ||||
Other | 152 | 42 | 6 | 218 | 14 | 432 | 1.0% | |
Transport usage (2009) | ||||||||
Road | 8881 | 231 | 9112 | 22.1% | ||||
Air | 1295 | 1295 | 3.1% | |||||
Rail | 151 | 35 | 186 | 0.5% | ||||
Inland navigation | 165 | 165 | 0.4% | |||||
Total final usage (2010) | ||||||||
Absolute 2010 | 7163 | 11960 | 1363 | 21746 | 1156 | 640 | 44028 | |
Share 2010 | 16.3% | 27.2% | 3.1% | 49.4% | 2.6% | 1.5% | 100% |
In the Brussels-Capital Region, the electricity and natural gas net are operated by Sibelga. In 2011, the natural gas consumption was 10,480 GWh and the electricity consumption was 5,087 GWh. [37]
Sibelga invests in combined heat and power (CHP) installations for which it receives green certificates. In 2011 its eleven installations had a combined capacity of 17.8 MWe and 19.7 MWth and generated 50.5 GWh of electricity. [37]
The Region of Brussels-Capital also encourages MicroCHP [38] and implemented the European directive of 2002/91/CE on Energy Performance of Buildings.
The companies Umicore, BASF, Solvay, Duferco, Tessenderlo Chemie , ArcelorMittal, and Air Liquide together account for about 15% of the total electricity consumption of Belgium in 2006. [39]
In 1990, the greenhouse gas (GHG) emissions were 146.9 million tons of CO2 equivalent (Mt CO2 eq), whose 88 million tons came from the Flemish Region, 54.8 from the Walloon Region and 4 Mt from the Brussels-capital Region. [40]
Being a member of the European Union, Belgium, applied the European Union Emission Trading Scheme set up by the Directive 2003/87/EC. The Kyoto protocol sets a 7.5% reduction of greenhouse gas emission target compared to 1990. Belgium set up a National Allocation Plan at the federal level with target for each of the three regions.
Belgium takes part in the United Nations Framework Convention on Climate Change and has ratified the Kyoto Protocol.
On 14 November 2002, Belgium signed the Cooperation Agreement for the implementation of a National Climate Plan and reporting in the context of the UNFCCC and the Kyoto protocol. The first National Allocation Plan was for the period from 2005 to 2007. The European commission approved it on 20 October 2004. The second allocation plan was for the period 2008–2012 and aims a reduction of 7.5% of green house gas emissions compared to 1990.
By 2019, the Walloon region had decreased 34% of its CO2 emissions, while Flanders had only decreased 8%.
According to Forbes list of billionaires (2011), the Belgian billionaire Wang Xingchun ($1 B 2011) made his wealth in coal business. [41] Wang is a resident of Singapore who holds Belgian citizenship. Wang is the chairman of minerals concern Winsway Coking Coal, an company that imports coal from Mongolia to China that went public in Hong Kong in 2010. [42]
Electricity generation is the process of generating electric power from sources of primary energy. For utilities in the electric power industry, it is the stage prior to its delivery to end users or its storage.
Renewable energy plays an important and growing role in the energy system of the European Union. The Europe 2020 strategy included a target of reaching 20% of gross final energy consumption from renewable sources by 2020, and at least 32% by 2030. The EU27 reached 22% in 2020 and 23% in 2022, up from 9.6% in 2004. These figures are based on energy use in all its forms across all three main sectors, the heating and cooling sector, the electricity sector, and the transport sector.
Electrabel SA is a Belgian energy corporation. It is a subsidiary of French multinational utility company Engie S.A..
Energy in the United Kingdom came mostly from fossil fuels in 2021. Total energy consumption in the United Kingdom was 142.0 million tonnes of oil equivalent in 2019. In 2014, the UK had an energy consumption per capita of 2.78 tonnes of oil equivalent compared to a world average of 1.92 tonnes of oil equivalent. Demand for electricity in 2014 was 34.42 GW on average coming from a total electricity generation of 335.0 TWh.
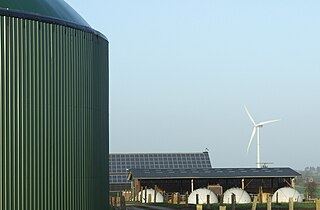
Renewable energy in Germany is mainly based on wind and biomass, plus solar and hydro. Germany had the world's largest photovoltaic installed capacity until 2014, and as of 2021 it has over 58 GW. It is also the world's third country by installed total wind power capacity, 64 GW in 2021 and second for offshore wind, with over 7 GW. Germany has been called "the world's first major renewable energy economy".
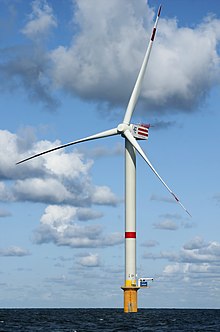
As of 2023, Europe had a total installed wind capacity of 255 gigawatts (GW). In 2017, a total of 15,680 MW of wind power was installed, representing 55% of all new power capacity, and the wind power generated 336 TWh of electricity, enough to supply 11.6% of the EU's electricity consumption.
Energy in Finland describes energy and electricity production, consumption and import in Finland. Energy policy of Finland describes the politics of Finland related to energy. Electricity sector in Finland is the main article regarding electricity in Finland.
Energy in Italy comes mostly from fossil fuels. Among the most used resources are petroleum, natural gas, coal and renewables. Italy has few energy resources, and most supplies are imported.
Energy in Austria describes energy and electricity production, consumption and import in Austria. Austria is very reliant on hydro as an energy source, supported by imported oil and natural gas supplies. It is planned by 2030 to become 100% electricity supplied by renewable sources, primarily hydro, wind and solar.
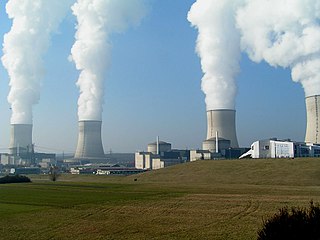
The electricity sector in France is dominated by its nuclear power, which accounted for 71.7% of total production in 2018, while renewables and fossil fuels accounted for 21.3% and 7.1%, respectively. France has the largest share of nuclear electricity in the world, and together with renewable energy supplies, this has helped its grid achieve very low carbon intensity.
The electricity sector in Belgium describes electricity in Belgium. Production by power source in 2009 was 53% nuclear, 40% fossil electricity and 7% renewable electricity. 2% of production was exported in 2009. In 2008 import was 11%. Belgium is highly nuclear dependent country where the share of renewable electricity has been low. The share of renewable electricity was about 2% in 2005. Plan for 2020 is wind 10.5 TWh (9.5%), biomass 11 TWh and PV 1 TWh.
The Polish energy sector is the fifth largest in Europe. In 2022, the country consumed 13.16 TWh of electricity, importing 3 114 GWh thereof.
Energy in Algeria describes energy and electricity production, consumption and import in Algeria. Primary energy use in 2009 in Algeria was 462 TWh and 13 TWh per million persons. Algeria is an OPEC country.
Energy in Sweden describes energy and electricity production, consumption and import in Sweden. Electricity sector in Sweden is the main article of electricity in Sweden. The Swedish climate bill of February 2017 aims to make Sweden carbon neutral by 2045. The Swedish target is to decline emission of climate gases 63% from 1990 to 2030 and international transportation excluding foreign flights 70%. By 2014 just over half of the country's total final energy consumption in electricity, heating and cooling and transport combined was provided by renewables, the highest share amongst the then 28 EU member countries. About a third of Sweden's electricity is generated by nuclear power. In generating a year's worth of this energy, Swedes generate about 4 tonnes of CO2 emissions each. Since 2010, sustainability measures have reduced total emissions even as the population has increased.
Primary energy consumption in Spain in 2015 was mainly composed of fossil fuels. The largest sources are petroleum (42.3%), natural gas (19.8%) and coal (11.6%). The remaining 26.3% is accounted for by nuclear energy (12%) and different renewable energy sources (14.3%). Domestic production of primary energy includes nuclear (44,8%), solar, wind and geothermal (22,4%), biomass and waste (21,1%), hydropower (7,2%) and fossil (4,5%).
Electricity in Cyprus is managed by the Electricity Authority of Cyprus. Power is primarily generated at three fuel oil-burning stations but the use of distributed renewable energy is expanding.
Energy in Luxembourg describes energy and electricity production, consumption and import in Luxembourg. Energy policy of Luxembourg will describe the politics of Luxembourg related to energy in greater detail. Electricity sector in Luxembourg is the main article of electricity in Luxembourg.
Primary energy use in Slovakia was 194 TWh and 36 TWh per million inhabitants in 2009.
Renewable energy in the Czech Republic describes the renewable energy related development in the Energy in the Czech Republic.
In 2008, Net electricity use in Portugal was 51.2 TWh. Portugal imported 9 TWh electricity in 2008. Population was 10.6 million.
{{cite web}}
: CS1 maint: archived copy as title (link){{cite book}}
: CS1 maint: location missing publisher (link)