Global Enabling Trade Report

Last updated
Global Enabling Trade Report 2008 cover.jpg

The Global Enabling Trade Report was first published in 2008 by the World Economic Forum. [1]

Contents

The 2008 report covers 118 major and emerging economies. At the core of the report is the Enabling Trade Index which ranks the countries using data from different sources (e.g., World Economic Forum's Executive Opinion Survey, International Trade Centre, World Bank, the United Nations Conference on Trade and Development (UNCTAD), IATA, ITU, Global Express Association).

The Enabling Trade Index measures the factors, policies and services that facilitate the trade in goods across borders and to destination. It is made up of four sub-indexes:

  1. Market access
  2. Border administration
  3. Transport and communications infrastructure
  4. Business environment

Each of these sub-indexes contains two to three pillars that assess different aspects of a country's trade environment.

2016 rankings

Global Enabling Trade Report 2016 [2]

  1. Flag of Singapore.svg  Singapore 5.97
  2. Flag of the Netherlands.svg  Netherlands 5.70
  3. Flag of Hong Kong.svg  Hong Kong 5.66
  4. Flag of Luxembourg.svg  Luxembourg 5.63
  5. Flag of Sweden.svg  Sweden 5.61
  6. Flag of Finland.svg  Finland 5.60
  7. Flag of Austria.svg  Austria 5.52
  8. Flag of the United Kingdom.svg  United Kingdom 5.52
  9. Flag of Germany.svg  Germany 5.49
  10. Flag of Belgium (civil).svg  Belgium 5.45
  11. Flag of Switzerland.svg   Switzerland 5.45
  12. Flag of Denmark.svg  Denmark 5.42
  13. Flag of France.svg  France 5.37
  14. Flag of Estonia.svg  Estonia 5.32
  15. Flag of Spain.svg  Spain 5.28
  16. Flag of Japan.svg  Japan 5.28
  17. Flag of Norway.svg  Norway 5.27
  18. Flag of New Zealand.svg  New Zealand 5.27
  19. Flag of Iceland.svg  Iceland 5.27
  20. Flag of Ireland.svg  Ireland 5.27
  21. Flag of Chile.svg  Chile 5.26
  22. Flag of the United States.svg  United States 5.24
  23. Flag of the United Arab Emirates.svg  United Arab Emirates 5.23
  24. Flag of Canada (Pantone).svg  Canada 5.15
  25. Flag of the Czech Republic.svg  Czech Republic 5.12
  26. Flag of Australia (converted).svg  Australia 5.10
  27. Flag of South Korea.svg  South Korea 5.04
  28. Flag of Portugal.svg  Portugal 5.01
  29. Flag of Lithuania.svg  Lithuania 5.01
  30. Flag of Israel.svg  Israel 4.99

2014 rankings

Global Enabling Trade Report 2014 [3]

  1. Flag of Singapore.svg  Singapore 5.9
  2. Flag of Hong Kong.svg  Hong Kong 5.5
  3. Flag of the Netherlands.svg  Netherlands 5.3
  4. Flag of New Zealand.svg  New Zealand 5.2
  5. Flag of Finland.svg  Finland 5.2
  6. Flag of the United Kingdom.svg  United Kingdom 5.2
  7. Flag of Switzerland.svg   Switzerland 5.2
  8. Flag of Chile.svg  Chile 5.1
  9. Flag of Sweden.svg  Sweden 5.1
  10. Flag of Germany.svg  Germany 5.1
  11. Flag of Luxembourg.svg  Luxembourg 5.1
  12. Flag of Norway.svg  Norway 5.1
  13. Flag of Japan.svg  Japan 5.1
  14. Flag of Canada (Pantone).svg  Canada 5.0
  15. Flag of the United States.svg  United States 5.0
  16. Flag of the United Arab Emirates.svg  United Arab Emirates 5.0
  17. Flag of Denmark.svg  Denmark 5.0
  18. Flag of Austria.svg  Austria 5.0
  19. Flag of Qatar.svg  Qatar 4.9
  20. Flag of Belgium (civil).svg  Belgium 4.9
  21. Flag of France.svg  France 4.9
  22. Flag of Iceland.svg  Iceland 4.9
  23. Flag of Australia (converted).svg  Australia 4.9
  24. Flag of the Republic of China.svg  Taiwan 4.9
  25. Flag of Malaysia.svg  Malaysia 4.8
  26. Flag of Ireland.svg  Ireland 4.8
  27. Flag of Spain.svg  Spain 4.8
  28. Flag of Estonia.svg  Estonia 4.8
  29. Flag of Mauritius.svg  Mauritius 4.7
  30. Flag of South Korea.svg  South Korea 4.7

2012 rankings

Global Enabling Trade Report 2012 [4]

  1. Flag of Singapore.svg  Singapore 6.14
  2. Flag of Hong Kong.svg  Hong Kong 5.67
  3. Flag of Denmark.svg  Denmark 5.41
  4. Flag of Sweden.svg  Sweden 5.39
  5. Flag of New Zealand.svg  New Zealand 5.34
  6. Flag of Finland.svg  Finland 5.34
  7. Flag of the Netherlands.svg  Netherlands 5.32
  8. Flag of Switzerland.svg   Switzerland 5.29
  9. Flag of Canada (Pantone).svg  Canada 5.22
  10. Flag of Luxembourg.svg  Luxembourg 5.20
  11. Flag of the United Kingdom.svg  United Kingdom 5.18
  12. Flag of Norway.svg  Norway 5.17
  13. Flag of Germany.svg  Germany 5.13
  14. Flag of Chile.svg  Chile 5.12
  15. Flag of Austria.svg  Austria 5.12
  16. Flag of Iceland.svg  Iceland 5.08
  17. Flag of Australia (converted).svg  Australia 5.08
  18. Flag of Japan.svg  Japan 5.08
  19. Flag of the United Arab Emirates.svg  United Arab Emirates 5.07
  20. Flag of France.svg  France 5.03
  21. Flag of Belgium (civil).svg  Belgium 4.96
  22. Flag of Ireland.svg  Ireland 4.96
  23. Flag of the United States.svg  United States 4.90
  24. Flag of Malaysia.svg  Malaysia 4.90
  25. Flag of Oman.svg  Oman 4.86
  26. Flag of Estonia.svg  Estonia 4.85
  27. Flag of Saudi Arabia.svg  Saudi Arabia 4.84
  28. Flag of Israel.svg  Israel 4.82
  29. Flag of the Republic of China.svg  Taiwan 4.81
  30. Flag of Bahrain.svg  Bahrain 4.80

2010 rankings

Global Enabling Trade Report 2010 [5]

  1. Flag of Singapore.svg  Singapore 6.06
  2. Flag of Hong Kong.svg  Hong Kong 5.70
  3. Flag of Denmark.svg  Denmark 5.41
  4. Flag of Sweden.svg  Sweden 5.41
  5. Flag of Switzerland.svg   Switzerland 5.37
  6. Flag of New Zealand.svg  New Zealand 5.33
  7. Flag of Norway.svg  Norway 5.32
  8. Flag of Canada (Pantone).svg  Canada 5.29
  9. Flag of Luxembourg.svg  Luxembourg 5.28
  10. Flag of the Netherlands.svg  Netherlands 5.26
  11. Flag of Iceland.svg  Iceland 5.26
  12. Flag of Finland.svg  Finland 5.25
  13. Flag of Germany.svg  Germany 5.20
  14. Flag of Austria.svg  Austria 5.17
  15. Flag of Australia (converted).svg  Australia 5.13
  16. Flag of the United Arab Emirates.svg  United Arab Emirates 5.12
  17. Flag of the United Kingdom.svg  United Kingdom 5.06
  18. Flag of Chile.svg  Chile 5.06
  19. Flag of the United States.svg  United States 5.03
  20. Flag of France.svg  France 5.02
  21. Flag of Ireland.svg  Ireland 5.00
  22. Flag of Bahrain.svg  Bahrain 4.95
  23. Flag of Estonia.svg  Estonia 4.90
  24. Flag of Belgium (civil).svg  Belgium 4.89
  25. Flag of Japan.svg  Japan 4.80
  26. Flag of Israel.svg  Israel 4.76
  27. Flag of South Korea.svg  South Korea 4.72
  28. Flag of the Republic of China.svg  Taiwan 4.72
  29. Flag of Oman.svg  Oman 4.71
  30. Flag of Malaysia.svg  Malaysia 4.71

2009 rankings

Global Enabling Trade Report 2009 [6]

  1. Flag of Singapore.svg  Singapore 5.97
  2. Flag of Hong Kong.svg  Hong Kong 5.57
  3. Flag of Switzerland.svg   Switzerland 5.44
  4. Flag of Denmark.svg  Denmark 5.44
  5. Flag of Sweden.svg  Sweden 5.44
  6. Flag of Canada (Pantone).svg  Canada 5.35
  7. Flag of Norway.svg  Norway 5.33
  8. Flag of Finland.svg  Finland 5.33
  9. Flag of Austria.svg  Austria 5.29
  10. Flag of the Netherlands.svg  Netherlands 5.27
  11. Flag of New Zealand.svg  New Zealand 5.27
  12. Flag of Germany.svg  Germany 5.24
  13. Flag of Luxembourg.svg  Luxembourg 5.12
  14. Flag of Australia (converted).svg  Australia 5.07
  15. Flag of Ireland.svg  Ireland 5.02
  16. Flag of the United States.svg  United States 5.02
  17. Flag of France.svg  France 5.02
  18. Flag of the United Arab Emirates.svg  United Arab Emirates 4.97
  19. Flag of Chile.svg  Chile 4.96
  20. Flag of the United Kingdom.svg  United Kingdom 4.93
  21. Flag of Belgium (civil).svg  Belgium 4.92
  22. Flag of Estonia.svg  Estonia 4.84
  23. Flag of Japan.svg  Japan 4.78
  24. Flag of Bahrain.svg  Bahrain 4.76
  25. Flag of the Republic of China.svg  Taiwan 4.75
  26. Flag of South Korea.svg  South Korea 4.73
  27. Flag of Spain.svg  Spain 4.72
  28. Flag of Malaysia.svg  Malaysia 4.70
  29. Flag of Israel.svg  Israel 4.66
  30. Flag of Portugal.svg  Portugal 4.63

2008 rankings

Global Enabling Trade Report 2008 [7]

  1. Flag of Hong Kong.svg  Hong Kong 6.04
  2. Flag of Singapore.svg  Singapore 5.71
  3. Flag of Sweden.svg  Sweden 5.66
  4. Flag of Norway.svg  Norway 5.65
  5. Flag of Canada (Pantone).svg  Canada 5.62
  6. Flag of Denmark.svg  Denmark 5.62
  7. Flag of Finland.svg  Finland 5.61
  8. Flag of Germany.svg  Germany 5.58
  9. Flag of Switzerland.svg   Switzerland 5.58
  10. Flag of New Zealand.svg  New Zealand 5.52
  11. Flag of the Netherlands.svg  Netherlands 5.51
  12. Flag of Luxembourg.svg  Luxembourg 5.50
  13. Flag of Japan.svg  Japan 5.43
  14. Flag of the United States.svg  United States 5.42
  15. Flag of Austria.svg  Austria 5.42
  16. Flag of the United Kingdom.svg  United Kingdom 5.30
  17. Flag of Australia (converted).svg  Australia 5.22
  18. Flag of Belgium (civil).svg  Belgium 5.21
  19. Flag of France.svg  France 5.20
  20. Flag of Ireland.svg  Ireland 5.20
  21. Flag of the Republic of China.svg  Taiwan 5.15
  22. Flag of Spain.svg  Spain 5.03
  23. Flag of the United Arab Emirates.svg  United Arab Emirates 4.96
  24. Flag of South Korea.svg  South Korea 4.95
  25. Flag of Estonia.svg  Estonia 4.89
  26. Flag of Portugal.svg  Portugal 4.88
  27. Flag of Chile.svg  Chile 4.88
  28. Flag of Israel.svg  Israel 4.76
  29. Flag of Malaysia.svg  Malaysia 4.75
  30. Flag of Slovakia.svg  Slovakia 4.74

Related Research Articles

This is a list of lists of universities and colleges by country, sorted by continent and region. The lists represent educational institutions throughout the world which provide higher education in tertiary, quaternary, and post-secondary education.

Developed country Country with a developed industry and infrastructure

A developed country, industrialized country, more developed country (MDC), or more economically developed country (MEDC), is a sovereign state that has a developed economy and advanced technological infrastructure relative to other less industrialized nations. Most commonly, the criteria for evaluating the degree of economic development are gross domestic product (GDP), gross national product (GNP), the per capita income, level of industrialization, amount of widespread infrastructure and general standard of living. Which criteria are to be used and which countries can be classified as being developed are subjects of debate.

Swimming at the 1992 Summer Olympics Swimming at the Olympics

At the 1992 Summer Olympics in Barcelona, Spain, 31 swimming events were contested. There was a total of 641 participants from 92 countries competing.

Environmental Performance Index

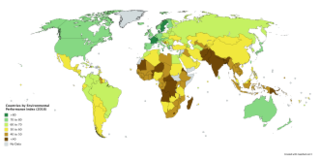
The Environmental Performance Index (EPI) is a method of quantifying and numerically marking the environmental performance of a state's policies. This index was developed from the Pilot Environmental Performance Index, first published in 2002, and designed to supplement the environmental targets set forth in the United Nations Millennium Development Goals.

International Scout and Guide Fellowship

The International Scout and Guide Fellowship (ISGF) is a worldwide organization of adults in support of Scouting and Guiding.

The Global Competitiveness Report (GCR) is a yearly report published by the World Economic Forum. Since 2004, the Global Competitiveness Report ranks countries based on the Global Competitiveness Index, developed by Xavier Sala-i-Martin and Elsa V. Artadi. Before that, the macroeconomic ranks were based on Jeffrey Sachs's Growth Development Index and the microeconomic ranks were based on Michael Porter's Business Competitiveness Index. The Global Competitiveness Index integrates the macroeconomic and the micro/business aspects of competitiveness into a single index.

Travel and Tourism Competitiveness Report

The Travel and Tourism Competitiveness Report was first published in 2007 by the World Economic Forum. The 2007 report covered 124 major and emerging economies. The 2008 report covered 130 countries, the 2009 report expanded to 133 countries, and the 2011 report to 139 countries. The index is a measurement of the factors that make it attractive to develop business in the travel and tourism industry of individual countries, rather than a measure of a country attractiveness as a tourist destination. The report ranks selected nations according to the Travel and Tourism Competitiveness Index (TTCI), which scores from 1 to 6 the performance of a given country in each specific subindex. The overall index is made of three main subindexes: (1) regulatory framework; (2) business environment and infrastructure; and (3) human, cultural, and natural resources. The Report also includes a specific Country Profile for each of the nations evaluated, with each of the scores received to estimate its TTCI, and complementary information regarding key economic indicators from the World Bank, and country indicators from the World Tourism Organization and the World Travel and Tourism Council. The last Travel & Tourism Competitiveness Report was published in 2019.

The Parenteral Drug Association (PDA) is an international non-profit industry trade group for pharmaceutical and biopharmaceutical manufacturers headquartered in Bethesda, MD, USA, with offices in Berlin, Germany, and Singapore.

SMC Corporation is a Japanese TOPIX Large 70 company founded in 1959 as Sintered Metal Corporation, which specializes in pneumatic control engineering to support industrial automation. SMC develops a broad range of control systems and equipment, such as directional control valves, actuators, and air line equipment, to support diverse applications. SMC's head office is located in Sotokanda, Chiyoda-ku, Tokyo, Japan. The company has a global engineering network, with technical facilities in the United States, Europe and China, as well as Japan. Key production facilities are located in China and Singapore, and local production facilities are in United States, Mexico, Brazil, Europe, India, Korea and Australia.

<i>ISS</i> (2000 video game)

International Superstar Soccer is a football video game in the International Superstar Soccer series by Konami. International Superstar Soccer is a game for one or two players, or even up to four players with the PlayStation's multitap.

Athletics at the 2017 Summer Universiade

Athletics was contested at the 2017 Summer Universiade from August 23 to 28 at the Taipei Municipal Stadium in Taipei, Taiwan.

References

  1. Professor Robert Z. Lawrence, Kennedy School of Government, Harvard University, Margareta Drzeniek Hanouz, World Economic Forum, Editors (2008). "Global Enabling Trade Report 2008". World Economic Forum, Geneva, Switzerland. Archived from the original on June 9, 2010. Retrieved 2009-03-11.CS1 maint: multiple names: authors list (link)
  2. http://reports.weforum.org/global-enabling-trade-report-2016/enabling-trade-rankings/
  3. World Economic Forum. "Rankings: Global Enabling Trade Report 2014".
  4. "Global Enabling Trade Report 2012" (PDF). World Economic Forum. Retrieved 2020-08-08.
  5. World Economic Forum. "Rankings: Global Enabling Trade Report 2010" (PDF). Archived from the original (PDF) on 2013-04-27.
  6. Global Enabling Trade Report 2009 at Google Books
  7. Global Enabling Trade Report 2008 at Google Books