This article needs to be updated.(January 2020) |
This article is intended to give an overview of the greenhouse gas emissions in the U.S. state of Kentucky .
This article needs to be updated.(January 2020) |
This article is intended to give an overview of the greenhouse gas emissions in the U.S. state of Kentucky .
The report "Kentucky Greenhouse Gas Inventory" provides a detailed inventory of greenhouse gas emissions and sinks for Kentucky in 1990. Emissions were estimated using methods from EPA's 1995 guidance document State Workbook: Methodologies for Estimating Greenhouse Gas Emissions. In 1990, Kentucky emitted 35.4 million metric tons of carbon equivalent (MMTCE). In addition, Kentucky estimated emissions of 0.4 MMTCE from biofuels. Emissions from biofuels are not included.
The principal of greenhouse gases were carbon dioxide, comprising 87.9 million metric tons (24.0 MMTCE), and methane, with 1.1 million metric tons (6.4 MMTCE). Other emissions included 0.0016 million metric tons of perfluorocarbons (PFCs) (4.8 MMTCE), and 0.003 million metric tons of nitrous oxide (0.2 MMTCE).
The major source of carbon dioxide emissions was fossil fuel combustion (96%), the majority[ quantify ] of which is utility coal.[ clarification needed ] Minor emissions came from cement and lime production and forest/grassland conversion. Carbon dioxide sinks (i.e., an increase in forest carbon storage) offset about 26% of the total carbon dioxide emissions.
Sources of methane emissions were coal mining (73%), domesticated animals (12%), landfills (10%), manure management (3%), and natural gas/oil extraction (2%).
Nitrous oxide emissions were from fertilizer use. Sources of perfluorocarbons were HCFC-22 production (91%) and aluminum production (9%).
Compared to the 1990 U.S. emissions of 6.4 MTCE per capita, Kentucky's emissions were 9.6 MTCE per person. Due to the substantial amount of coal-related activities taking place in Kentucky, the state has high emissions per person. [1]
A great deal of greenhouse gas emissions and toxic pollutants in Kentucky originate in coal-seam fires. These can continue to burn for hundreds of years due to the low supply of oxygen leading to a slow rate of skin burns. [2]
Coal-seam fires in Kentucky include the Truman Shepherd fire in Floyd and Knott counties (1400 t/yr CO2 in 2010), [3] the Ruth Mullins fire in Perry County (726 t/yr CO2 in 2010), [3] the Old Smokey fire in Floyd County, [4] The Truman Shepherd fire was brought down to less than 66 t/yr CO2 by 2013 through mitigating actions. [5]
This section needs to be updated.(May 2019) |
Carbon sequestration is the process of injecting carbon-dioxide into geological formations in order to store it and prevent it entering the atmosphere. Pumping carbon-dioxide into geological formations has been done in the oil industry for some time for the purpose of extracting oil. For this reason the technology is considered proven, at least as far as the physical pumping is concerned. Unmineable coal seams are one possible formation that could be used for this purpose. As of 2010, there are plans to conduct a feasibility study in conjunction with the Kentucky Geological Survey. The Kentucky Carbon Storage Foundation will drill the test well. The facility is intended to serve a coal gasification plant planned by Peabody Energy and ConocoPhillips. [6]

Coal is a combustible black or brownish-black sedimentary rock, formed as rock strata called coal seams. Coal is mostly carbon with variable amounts of other elements, chiefly hydrogen, sulfur, oxygen, and nitrogen. Coal is a type of fossil fuel, formed when dead plant matter decays into peat and is converted into coal by the heat and pressure of deep burial over millions of years. Vast deposits of coal originate in former wetlands called coal forests that covered much of the Earth's tropical land areas during the late Carboniferous (Pennsylvanian) and Permian times. Many significant coal deposits are younger than this and originate from the Mesozoic and Cenozoic eras.
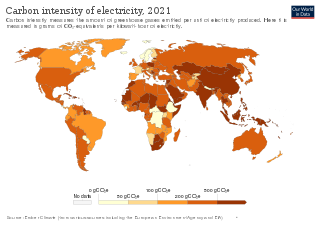
An emission intensity is the emission rate of a given pollutant relative to the intensity of a specific activity, or an industrial production process; for example grams of carbon dioxide released per megajoule of energy produced, or the ratio of greenhouse gas emissions produced to gross domestic product (GDP). Emission intensities are used to derive estimates of air pollutant or greenhouse gas emissions based on the amount of fuel combusted, the number of animals in animal husbandry, on industrial production levels, distances traveled or similar activity data. Emission intensities may also be used to compare the environmental impact of different fuels or activities. In some case the related terms emission factor and carbon intensity are used interchangeably. The jargon used can be different, for different fields/industrial sectors; normally the term "carbon" excludes other pollutants, such as particulate emissions. One commonly used figure is carbon intensity per kilowatt-hour (CIPK), which is used to compare emissions from different sources of electrical power.

The carbon footprint (or greenhouse gas footprint) serves as an indicator to compare the total amount of greenhouse gases emitted from an activity, product, company or country. Carbon footprints are usually reported in tons of emissions (CO2-equivalent) per unit of comparison; such as per year, person, kg protein, km travelled and alike. For a product, its carbon footprint includes the emissions for the entire life cycle from the production along the supply chain to its final consumption and disposal. Similarly for an organization, its carbon footprint includes the direct as well as the indirect emissions caused by the organization (called Scope 1, 2 and 3 in the Greenhouse Gas Protocol that is used for carbon accounting of organizations). Several methodologies and online tools exist to calculate the carbon footprint, depending on whether the focus is on a country, organization, product or individual person. For example, the carbon footprint of a product could help consumers decide which product to buy if they want to be climate aware. In the context of climate change mitigation activities, the carbon footprint can help distinguish those economic activities with a high footprint from those with a low footprint. In other words, the carbon footprint concept allows everyone to make comparisons between the climate-relevant impacts of individuals, products, companies, countries. In doing so, it helps to devise strategies and priorities for reducing the carbon footprint.

Coal pollution mitigation, sometimes called clean coal, is a series of systems and technologies that seek to mitigate the health and environmental impact of coal; in particular air pollution from coal-fired power stations, and from coal burnt by heavy industry.

Carbon capture and storage (CCS) is a process in which a relatively pure stream of carbon dioxide (CO2) from industrial sources is separated, treated and transported to a long-term storage location. For example, the carbon dioxide stream that is to be captured can result from burning fossil fuels or biomass. Usually the CO2 is captured from large point sources, such as a chemical plant or biomass plant, and then stored in an underground geological formation. The aim is to reduce greenhouse gas emissions and thus mitigate climate change.

Bayswater Power Station is a bituminous (black) coal-powered thermal power station with four 660 megawatts (890,000 hp) Tokyo Shibaura Electric (Japan) steam driven turbo alternators for a combined capacity of 2,640 megawatts (3,540,000 hp). Commissioned between 1985 and 1986, the station is located 16 kilometres (10 mi) from Muswellbrook, and 28 km (17 mi) from Singleton in the Hunter Region of New South Wales, Australia.

Greenhouse gas emissions from human activities strengthen the greenhouse effect, contributing to climate change. Most is carbon dioxide from burning fossil fuels: coal, oil, and natural gas. The largest emitters include coal in China and large oil and gas companies. Human-caused emissions have increased atmospheric carbon dioxide by about 50% over pre-industrial levels. The growing levels of emissions have varied, but have been consistent among all greenhouse gases. Emissions in the 2010s averaged 56 billion tons a year, higher than any decade before. Total cumulative emissions from 1870 to 2017 were 425±20 GtC from fossil fuels and industry, and 180±60 GtC from land use change. Land-use change, such as deforestation, caused about 31% of cumulative emissions over 1870–2017, coal 32%, oil 25%, and gas 10%.
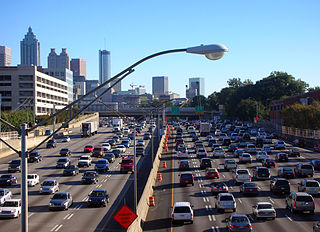
The United States produced 5.2 billion metric tons of carbon dioxide equivalent greenhouse gas (GHG) emissions in 2020, the second largest in the world after greenhouse gas emissions by China and among the countries with the highest greenhouse gas emissions per person. In 2019 China is estimated to have emitted 27% of world GHG, followed by the United States with 11%, then India with 6.6%. In total the United States has emitted a quarter of world GHG, more than any other country. Annual emissions are over 15 tons per person and, amongst the top eight emitters, is the highest country by greenhouse gas emissions per person. However, the IEA estimates that the richest decile in the US emits over 55 tonnes of CO2 per capita each year. Because coal-fired power stations are gradually shutting down, in the 2010s emissions from electricity generation fell to second place behind transportation which is now the largest single source. In 2020, 27% of the GHG emissions of the United States were from transportation, 25% from electricity, 24% from industry, 13% from commercial and residential buildings and 11% from agriculture. In 2021, the electric power sector was the second largest source of U.S. greenhouse gas emissions, accounting for 25% of the U.S. total. These greenhouse gas emissions are contributing to climate change in the United States, as well as worldwide.

The Global Carbon Project (GCP) is an organisation that seeks to quantify global greenhouse gas emissions and their causes. Established in 2001, its projects include global budgets for three dominant greenhouse gases—carbon dioxide, methane, and nitrous oxide —and complementary efforts in urban, regional, cumulative, and negative emissions.
This is a list of climate change topics.
Fugitive emissions are leaks and other irregular releases of gases or vapors from a pressurized containment – such as appliances, storage tanks, pipelines, wells, or other pieces of equipment – mostly from industrial activities. In addition to the economic cost of lost commodities, fugitive emissions contribute to local air pollution and may cause further environmental harm. Common industrial gases include refrigerants and natural gas, while less common examples are perfluorocarbons, sulfur hexafluoride, and nitrogen trifluoride.
Greenhouse gas emissions by Australia totalled 533 million tonnes CO2-equivalent based on greenhouse gas national inventory report data for 2019; representing per capita CO2e emissions of 21 tons, three times the global average. Coal was responsible for 30% of emissions. The national Greenhouse Gas Inventory estimates for the year to March 2021 were 494.2 million tonnes, which is 27.8 million tonnes, or 5.3%, lower than the previous year. It is 20.8% lower than in 2005. According to the government, the result reflects the decrease in transport emissions due to COVID-19 pandemic restrictions, reduced fugitive emissions, and reductions in emissions from electricity; however, there were increased greenhouse gas emissions from the land and agriculture sectors.

Carbon dioxide removal (CDR), also known as carbon removal, greenhouse gas removal (GGR) or negative emissions, is a process in which carbon dioxide gas is removed from the atmosphere by deliberate human activities and durably stored in geological, terrestrial, or ocean reservoirs, or in products. In the context of net zero greenhouse gas emissions targets, CDR is increasingly integrated into climate policy, as an element of climate change mitigation strategies. Achieving net zero emissions will require both deep cuts in emissions and the use of CDR. CDR can counterbalance emissions that are technically difficult to eliminate, such as some agricultural and industrial emissions.
The Chicago Climate Action Plan (CCAP) is Chicago's climate change mitigation and adaptation strategy that was adopted in September 2008. The CCAP has an overarching goal of reducing Chicago's greenhouse gas emissions to 80 percent below 1990 levels by 2050, with an interim goal of 25 percent below 1990 levels by 2020.
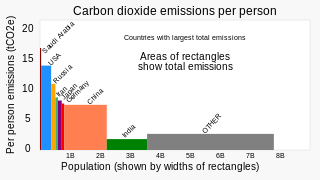
Greenhouse gas emissions by China are the largest of any country in the world both in production and consumption terms, and stem mainly from coal burning in China, including coal-fired power stations, coal mining, and blast furnaces producing iron and steel. When measuring production-based emissions, China emitted over 14 gigatonnes (Gt) CO2eq of greenhouse gases in 2019, 27% of the world total. When measuring in consumption-based terms, which adds emissions associated with imported goods and extracts those associated with exported goods, China accounts for 13 gigatonnes (Gt) or 25% of global emissions.

Greenhouse gas emissionsbyRussia are mostly from fossil gas, oil and coal. Russia emits 2 or 3 billion tonnes CO2eq of greenhouse gases each year; about 4% of world emissions. Annual carbon dioxide emissions alone are about 12 tons per person, more than double the world average. Cutting greenhouse gas emissions, and therefore air pollution in Russia, would have health benefits greater than the cost. The country is the world's biggest methane emitter, and 4 billion dollars worth of methane was estimated to leak in 2019/20.
The GHG Protocol Corporate Standard is an initiative for the global standardisation of emission of Greenhouse Gases in order that corporate entities should measure, quantify, and provide reportage of their own emission levels so that global emissions are made manageable. The relevant gases, as described by the 11 December 1997 Kyoto Protocol, that was implemented 16 February 2005, are: carbon dioxide, hydrofluorocarbons, methane, nitrous oxide, nitrogen trifluoride, perfluorocarbons and sulphur hexafluoride. The protocol itself is under the management of the World Resources Institute and the World Business Council for Sustainable Development. The GHGP was launched in 1998 and introduced in 2001.
![]() This article incorporates public domain material from Kentucky Greenhouse Gas Emissions and Sinks Inventory: Summary (PDF). U.S. Environmental Protection Agency.
This article incorporates public domain material from Kentucky Greenhouse Gas Emissions and Sinks Inventory: Summary (PDF). U.S. Environmental Protection Agency.