Kentucky's 3rd congressional district | |||
---|---|---|---|
Representative |
| ||
Distribution |
| ||
Population (2022) | 742,826 [2] | ||
Median household income | $63,327 [3] | ||
Ethnicity |
| ||
Cook PVI | D+9 [4] |
Kentucky's 3rd congressional district is a congressional district in the U.S. state of Kentucky. It encompasses almost all of Louisville Metro, which, since the merger of 2003, is consolidated with Jefferson County, though other incorporated cities exist within the county, such as Shively and St. Matthews. The far eastern portions of Louisville Metro are part of the 2nd congressional district.
The district is currently represented by Democrat Morgan McGarvey. With a Cook Partisan Voting Index rating of D+9, it is the only Democratic district in Kentucky. [4]
The district's character is very different from the rest of Kentucky. It is entirely contained within Jefferson County, and in contrast to the rest of the state, it is urban and leans Democratic. It has the highest percentage of African Americans in the state, who are concentrated in and near Louisville. It is a cosmopolitan, diverse district, with major businesses, health care organizations and universities.
Until January 1, 2006, Kentucky did not track party affiliation for registered voters who were neither Democratic nor Republican. [5] The Kentucky voter registration card does not explicitly list anything other than Democratic Party, Republican Party, or Other, with the "Other" option having a blank line and no instructions on how to register as something else. [6]
Year (Sept.) | Democratic | Republican | Other | Independent | Libertarian | Green | Constitution | Reform | Socialist Worker's | Male | Female | Registered | ||||||||||||
---|---|---|---|---|---|---|---|---|---|---|---|---|---|---|---|---|---|---|---|---|---|---|---|---|
Voters | % | Voters | % | Voters | % | Voters | % | Voters | % | Voters | % | Voters | % | Voters | % | Voters | % | Voters | % | Voters | % | Voters | % | |
2017 | 328,432 | 57.835 | 183,755 | 32.358 | 35,988 | 6.337 | 17,632 | 3.105 | 1,568 | 0.276 | 421 | 0.074 | 58 | 0.01 | 4 | 0.001 | 21 | 0.004 | 261,561 | 46.059 | 306,317 | 53.941 | 567,879 | 100 |
2018 | 335,172 | 57.984 | 185,426 | 32.078 | 36,011 | 6.23 | 19,204 | 3.322 | 1,724 | 0.298 | 397 | 0.069 | 63 | 0.011 | 7 | 0.001 | 40 | 0.007 | 266,355 | 46.079 | 311,688 | 53.921 | 578,044 | 100 |
2019 | 343,512 | 58.24 | 187,470 | 31.784 | 36,222 | 6.141 | 20,313 | 3.444 | 1,832 | 0.311 | 347 | 0.059 | 78 | 0.013 | 6 | 0.001 | 38 | 0.006 | 272,144 | 46.14 | 317,525 | 53.834 | 589,818 | 100 |
2020 | 354,146 | 58.045 | 194,002 | 31.797 | 34,855 | 5.713 | 24,185 | 3.964 | 2,317 | 0.38 | 408 | 0.067 | 116 | 0.019 | 24 | 0.004 | 73 | 0.012 | 282,897 | 46.367 | 326,906 | 53.58 | 610,126 | 100 |
2021 | 352,605 | 57.916 | 192,258 | 31.579 | 35,335 | 5.804 | 25,549 | 4.196 | 2,407 | 0.395 | 437 | 0.072 | 122 | 0.02 | 26 | 0.004 | 82 | 0.013 | 282,681 | 46.431 | 325,822 | 53.517 | 608,821 | 100 |
2022 | 100 |
Election results from statewide races | ||
---|---|---|
Year | Office | Results |
2000 | Kentucky | Gore 50–48% |
2004 | Kentucky | Kerry 51–49% |
2008 | Kentucky | Obama 56–43% |
2012 | Kentucky | Obama 56–43% |
2016 | Kentucky | Clinton 55–40% |
Senate | Gray 60–40% | |
2019 | Governor | Beshear 68–30% |
Attorney General | Stumbo 61–39% | |
2020 | Kentucky | Biden 60–38% |
Senate | McGrath 61–36% | |
2022 | Senate | Booker 60–40% |
2023 | Governor | Beshear 71–29% |
Party | Candidate | Votes | % | |
---|---|---|---|---|
Democratic | Fred M. Vinson (incumbent) | 575,191 | ||
Democratic | John Y. Brown Sr. | 574,270 | ||
Democratic | Andrew J. May (incumbent) | 574,189 | ||
Democratic | Brent Spence (incumbent) | 574,079 | ||
Democratic | Virgil Chapman (incumbent) | 573,750 | ||
Democratic | Glover H. Cary (incumbent) | 573,505 | ||
Democratic | William Voris Gregory (incumbent) | 573,269 | ||
Democratic | Cap R. Carden (incumbent) | 573,257 | ||
Democratic | Finley Hamilton | 573,024 | ||
Republican | Hillard H. Smith | 391,868 | ||
Republican | Robert E. Lee Blackburn | 391,674 | ||
Republican | William Lewis | 390,982 | ||
Republican | George P. Ellison | 390,739 | ||
Republican | D.E. McClure | 390,474 | ||
Republican | J.C. Speight | 390,370 | ||
Republican | Hugh H. Asher | 390,148 | ||
Republican | B.T. Rountree | 390,041 | ||
Republican | Frank B. Russell | 389,950 | ||
Socialist | John T. Scopes [7] | 3,273 | ||
Socialist | J.J. Thobe | 3,264 | ||
Socialist | C.E. Trimble | 3,260 | ||
Socialist | W.G. Haag | 3,259 | ||
Socialist | E. L. Nance | 3,256 | ||
Socialist | E.C. Schulz | 3,256 | ||
Socialist | J.M. Woodward | 3,255 | ||
Socialist | H.L. Harwood | 3,254 | ||
Socialist | D.S. Bennett | 3,252 | ||
Communist | Frank Reynolds | 241 | ||
Communist | George N. Conway | 236 | ||
Total votes | ||||
Turnout | {{{votes}}} | |||
Democratic hold | ||||
Party | Candidate | Votes | % | |
---|---|---|---|---|
Democratic | Emmet O'Neal | 48,664 | 56.20 | |
Republican | Frank M. Drake | 36,922 | 42.64 | |
Independent | Peter J. Gnau | 414 | 0.48 | |
Socialist | Clell G. Fowler | 395 | 0.46 | |
Socialist Labor | William H. Brann | 165 | 0.19 | |
Communist | J. Stuart McIntyre | 38 | 0.04 | |
Total votes | 86,598 | 100.00 | ||
Turnout | {{{votes}}} | |||
Democratic hold | ||||
Party | Candidate | Votes | % | |
---|---|---|---|---|
Democratic | Emmet O'Neal (incumbent) | 85,034 | 60.30 | |
Republican | W. A. Armstrong | 52,600 | 37.30 | |
Union | Jerry V. Spencer | 3,206 | 2.27 | |
Socialist | Sara Kasdan | 170 | 0.12 | |
Total votes | 93,588 | 100.00 | ||
Turnout | {{{votes}}} | |||
Democratic hold | ||||
Party | Candidate | Votes | % | |
---|---|---|---|---|
Democratic | Emmet O'Neal (incumbent) | 57,227 | 61.15 | |
Republican | Frank A. Ropke | 36,361 | 38.85 | |
Total votes | 93,588 | 100.00 | ||
Turnout | {{{votes}}} | |||
Democratic hold | ||||
Party | Candidate | Votes | % | |
---|---|---|---|---|
Democratic | Emmet O'Neal (incumbent) | 96,253 | 60.00 | |
Republican | Ben. J. Brumleve | 64,053 | 40.00 | |
Total votes | 160,306 | 100.00 | ||
Turnout | {{{votes}}} | |||
Democratic hold | ||||
Party | Candidate | Votes | % | |
---|---|---|---|---|
Democratic | Emmet O'Neal (incumbent) | 39,866 | 55.16 | |
Republican | Joett Ross Todd | 32,404 | 44.84 | |
Total votes | 72,270 | 100.00 | ||
Turnout | {{{votes}}} | |||
Democratic hold | ||||
Party | Candidate | Votes | % | |||
---|---|---|---|---|---|---|
Republican | Garland R. Hubbard | 79,922 | 62.00 | |||
Prohibition | Bessie Graham | 308 | 0.24 | |||
Democratic | Frank L. Chelf | 48,671 | 37.76 | |||
Total votes | 128,901 | 100.00 | ||||
Turnout | {{{votes}}} | |||||
Republican gain from Democratic | ||||||
Party | Candidate | Votes | % | |
---|---|---|---|---|
Republican | Thurston Ballard Morton | 61,899 | 58.12 | |
Democratic | Emmet O'Neil | 44,599 | 41.88 | |
Total votes | 106,498 | 100.00 | ||
Turnout | {{{votes}}} | |||
Republican hold | ||||
Party | Candidate | Votes | % | |
---|---|---|---|---|
Republican | Thruston Ballard Morton (incumbent) | 74,168 | 52.96 | |
Democratic | Ralph H. Logan | 64,877 | 46.33 | |
Progressive | Alfred M. Carroll | 686 | 0.49 | |
Prohibition | Robert Jack Garrison | 315 | 0.22 | |
Total votes | 140,046 | 100.00 | ||
Turnout | {{{votes}}} | |||
Republican hold | ||||
Party | Candidate | Votes | % | |
---|---|---|---|---|
Republican | Thruston Ballard Morton (incumbent) | 62,363 | 55.53 | |
Democratic | Alex P. Humphrey | 49,935 | 44.47 | |
Total votes | 112,298 | 100.00 | ||
Turnout | {{{votes}}} | |||
Republican hold | ||||
Party | Candidate | Votes | % | |
---|---|---|---|---|
Republican | John M Robsion, Jr | 95,041 | 54.01 | |
Democratic | Boman L. Shamburger | 80,347 | 45.66 | |
Independent | H. A. I. Rosenberg | 573 | 0.33 | |
Total votes | 175,961 | 100.00 | ||
Turnout | {{{votes}}} | |||
Republican hold | ||||
Party | Candidate | Votes | % | |
---|---|---|---|---|
Republican | John M Robsion, Jr (incumbent) | 72,073 | 50.20 | |
Democratic | Harrison M Robertson | 71,500 | 49.80 | |
Total votes | 143,573 | 100.00 | ||
Turnout | {{{votes}}} | |||
Republican hold | ||||
Party | Candidate | Votes | % | |
---|---|---|---|---|
Democratic | Phillip Ardery | 84,912 | 43.21 | |
Republican | John M Robsion, Jr (incumbent) | 111,598 | 56.79 | |
Total votes | 196,510 | 100.00 | ||
Turnout | {{{votes}}} | |||
Republican hold | ||||
Party | Candidate | Votes | % | |||
---|---|---|---|---|---|---|
Democratic | Frank W Burke | 73,121 | 52.16 | |||
Republican | John M Robsion (incumbent) | 67,059 | 47.84 | |||
Total votes | 140,180 | 100.00 | ||||
Turnout | {{{votes}}} | |||||
Democratic gain from Republican | ||||||
Party | Candidate | Votes | % | |
---|---|---|---|---|
Democratic | Frank W. Burke (incumbent) | 115,421 | 50.25 | |
Republican | Henry R. Heyburn | 114,263 | 49.75 | |
Total votes | 229,684 | 100.00 | ||
Turnout | {{{votes}}} | |||
Democratic hold | ||||
Party | Candidate | Votes | % | |||
---|---|---|---|---|---|---|
Democratic | Frank W. Burke (incumbent) | 91,544 | 49.18 | |||
Republican | M. G. "Gene" Snyder | 94,579 | 50.82 | |||
Total votes | 229,684 | 100.00 | ||||
Turnout | {{{votes}}} | |||||
Republican gain from Democratic | ||||||
Party | Candidate | Votes | % | |||
---|---|---|---|---|---|---|
Democratic | Charles P. Farnsley | 117,892 | 53.82 | |||
Republican | M.G. "Gene" Snyder (incumbent) | 101,168 | 46.18 | |||
Total votes | 219,060 | 100.00 | ||||
Turnout | {{{votes}}} | |||||
Democratic gain from Republican | ||||||
Party | Candidate | Votes | % | |||
---|---|---|---|---|---|---|
Democratic | Norbert Blume | 46,240 | 40.99 | |||
Republican | William O. Cowger | 66,577 | 59.01 | |||
Total votes | 112,817 | 100.00 | ||||
Turnout | {{{votes}}} | |||||
Republican gain from Democratic | ||||||
Party | Candidate | Votes | % | |
---|---|---|---|---|
Republican | William O. Cowger (incumbent) | 70,318 | 55.95 | |
Democratic | Tom Ray | 55,366 | 44.05 | |
Total votes | 125,684 | 100.00 | ||
Turnout | {{{votes}}} | |||
Republican hold | ||||
Party | Candidate | Votes | % | |||
---|---|---|---|---|---|---|
Republican | William O. Cowger (incumbent) | 49,891 | 48.32 | |||
Democratic | Romano L. Mazzoli | 50,102 | 48.52 | |||
American | Ronald W. Watson | 3,265 | 3.16 | |||
Total votes | 103,258 | 100.00 | ||||
Turnout | {{{votes}}} | |||||
Democratic gain from Republican | ||||||
Party | Candidate | Votes | % | |
---|---|---|---|---|
Democratic | Romano L. Mazzoli (incumbent) | 86,810 | 62.15 | |
Republican | Phil Kaelin, Jr | 51,634 | 36.97 | |
American | William P. Chambers | 1,227 | 0.88 | |
Total votes | 139,671 | 100.00 | ||
Turnout | {{{votes}}} | |||
Democratic hold | ||||
Party | Candidate | Votes | % | |
---|---|---|---|---|
Republican | Vincent N. Barclay | 28,813 | 26.56 | |
Democratic | Romano L. Mazzoli (incumbent) | 37,346 | 69.67 | |
American | William P. Chambers | 3,383 | 3.12 | |
Independent | Luther J. Wilson | 708 | 0.65 | |
Total votes | 108,475 | 100.00 | ||
Turnout | {{{votes}}} | |||
Democratic hold | ||||
Party | Candidate | Votes | % | |
---|---|---|---|---|
Republican | Denzil J. Ramsey | 58,019 | 41.22 | |
Democratic | Romano L. Mazzoli (incumbent) | 80,496 | 57.19 | |
American | William P. Chambers | 2,229 | 1.58 | |
Total votes | 140,744 | 100.00 | ||
Turnout | {{{votes}}} | |||
Democratic hold | ||||
Party | Candidate | Votes | % | |
---|---|---|---|---|
Democratic | Romano L. Mazzoli (incumbent) | 37,346 | 65.67 | |
Republican | Norbert D. Leveronne | 17,785 | 31.27 | |
Independent | Tom Beckham | 1,312 | 2.31 | |
Socialist Workers | John Cumbler | 428 | 0.75 | |
Total votes | 56,871 | 100.00 | ||
Turnout | {{{votes}}} | |||
Democratic hold | ||||
Party | Candidate | Votes | % | |
---|---|---|---|---|
Democratic | Romano L. Mazzoli (incumbent) | 85,873 | 63.74 | |
Republican | Richard Cesler | 46,681 | 34.65 | |
American | Robert D. Vessels | 468 | 0.35 | |
Citizens | John Cumbler | 1,272 | 0.94 | |
Libertarian | Henry G. Logsdon | 430 | 0.32 | |
Total votes | 134,724 | 100.00 | ||
Turnout | {{{votes}}} | |||
Democratic hold | ||||
Party | Candidate | Votes | % | |
---|---|---|---|---|
Republican | Carl Brown | 45,900 | 32.19 | |
Democratic | Romano L. Mazzoli (incumbent) | 92,849 | 65.11 | |
Independent | Norbert D. Leveronne | 2,840 | 1.99 | |
Libertarian | Dan Murray | 608 | 0.43 | |
Socialist Workers | Craig Honts | 400 | 0.28 | |
Total votes | 142,597 | 100.00 | ||
Turnout | {{{votes}}} | |||
Democratic hold | ||||
Party | Candidate | Votes | % | |
---|---|---|---|---|
Republican | Suzanne M. Warner | 68,185 | 31.67 | |
Democratic | Romano L. Mazzoli (incumbent) | 145,680 | 67.67 | |
Independent | Peggy Kreiner | 1,273 | 0.59 | |
Write-In | 139 | 0.06 | ||
Total votes | 215,277 | 100.00 | ||
Turnout | {{{votes}}} | |||
Democratic hold | ||||
Party | Candidate | Votes | % | |
---|---|---|---|---|
Republican | Lee Holmes | 29,348 | 26.15 | |
Democratic | Romano L. Mazzoli (incumbent) | 81,943 | 73.01 | |
Socialist Workers | Estelle Debates | 899 | 0.80 | |
Write-In | 43 | 0.04 | ||
Total votes | 112,233 | 100.00 | ||
Turnout | {{{votes}}} | |||
Democratic hold | ||||
Party | Candidate | Votes | % | |
---|---|---|---|---|
Republican | Philip Dunnagan | 57,387 | 30.30 | |
Democratic | Romano L. Mazzoli (incumbent) | 131,981 | 69.70 | |
Total votes | 189,368 | 100.00 | ||
Turnout | {{{votes}}} | |||
Democratic hold | ||||
Party | Candidate | Votes | % | |
---|---|---|---|---|
Republican | Al Brown | 55,188 | 39.44 | |
Democratic | Romano L. Mazzoli | 84,750 | 60.56 | |
Total votes | 139,938 | 100.00 | ||
Turnout | {{{votes}}} | |||
Democratic hold | ||||
Party | Candidate | Votes | % | |
---|---|---|---|---|
Democratic | Romano L. Mazzoli (incumbent) | 148,066 | 52.74 | |
Republican | Susan B. Stokes | 132,689 | 47.26 | |
Write-In | Patricia Metten | 15 | 0.005 | |
Total votes | 280,770 | 100.00 | ||
Turnout | {{{votes}}} | |||
Democratic hold | ||||
Party | Candidate | Votes | % | |
---|---|---|---|---|
Democratic | Mike Ward | 67,663 | 44.36 | |
Republican | Susan B. Stokes | 67,238 | 44.08 | |
U.S. Taxpayers' Party (United States) | Richard Lewis | 17,591 | 11.53 | |
Write-In | Valerie Cohen | 31 | 0.02 | |
Total votes | 152,523 | 100.00 | ||
Turnout | {{{votes}}} | |||
Democratic hold | ||||
Party | Candidate | Votes | % | |||
---|---|---|---|---|---|---|
Republican | Anne Northup | 126,625 | 50.26 | |||
Democratic | Mike Ward (Incumbent) | 125,326 | 49.74 | |||
Total votes | 251,951 | 100.00 | ||||
Turnout | {{{votes}}} | |||||
Republican gain from Democratic | ||||||
Party | Candidate | Votes | % | |
---|---|---|---|---|
Republican | Anne Northup (Incumbent) | 100,690 | 52.02 | |
Democratic | Chris Gorman | 92,865 | 47.98 | |
Total votes | 193,555 | 100.00 | ||
Turnout | {{{votes}}} | |||
Republican hold | ||||
Party | Candidate | Votes | % | |
---|---|---|---|---|
Republican | Anne Northup (Incumbent) | 142,106 | 52.87 | |
Democratic | Eleanor Jordon | 118,875 | 44.23 | |
Libertarian | Donna Walker Mancini | 7,804 | 2.90 | |
Total votes | 268,785 | 100.00 | ||
Turnout | {{{votes}}} | 67.9 | ||
Republican hold | ||||
Party | Candidate | Votes | % | |
---|---|---|---|---|
Republican | Anne Northup (Incumbent) | 118,228 | 51.61 | |
Democratic | Jack Conway | 110,846 | 48.39 | |
Total votes | 229,074 | 100.00 | ||
Turnout | {{{votes}}} | |||
Republican hold | ||||
Party | Candidate | Votes | % | |
---|---|---|---|---|
Republican | Anne Northup (Incumbent) | 197,736 | 60.26 | |
Democratic | Tony Miller | 124,040 | 37.80 | |
Libertarian | George C. Dick | 6,363 | 1.94 | |
Total votes | 328,139 | 100.00 | ||
Turnout | {{{votes}}} | |||
Republican hold | ||||
Party | Candidate | Votes | % | |||
---|---|---|---|---|---|---|
Democratic | John Yarmuth | 122,471 | 50.62 | |||
Republican | Anne Northup (Incumbent) | 116,555 | 48.18 | |||
Libertarian | Donna Walker Mancini | 2,134 | 0.88 | |||
Constitution | W. Ed Parker | 774 | 0.32 | |||
Total votes | 241,934 | 100.00 | ||||
Turnout | {{{votes}}} | |||||
Democratic gain from Republican | ||||||
Party | Candidate | Votes | % | |
---|---|---|---|---|
Democratic | John Yarmuth (Incumbent) | 203,843 | 59.37 | |
Republican | Anne Northup | 139,527 | 40.64 | |
Libertarian | Ed Martin | Republican sued; votes not counted | 0.00 | |
Total votes | 343,370 | 100.00 | ||
Turnout | {{{votes}}} | |||
Democratic hold | ||||
Party | Candidate | Votes | % | |
---|---|---|---|---|
Democratic | John Yarmuth (Incumbent) | 139,940 | 54.68 | |
Republican | Todd Lally | 112,627 | 44.01 | |
Libertarian | Ed Martin | 2,029 | 0.79 | |
Independent | Michael Hansen | 1,334 | 0.52 | |
Total votes | 255,930 | 100.00 | ||
Turnout | {{{votes}}} | |||
Democratic hold | ||||
Party | Candidate | Votes | % | |
---|---|---|---|---|
Democratic | John Yarmuth (Incumbent) | 206,385 | 63.96 | |
Republican | Brooks Wicker | 111,452 | 34.54 | |
Independent | Robert L. DeVore, Jr. | 4.819 | 1.49 | |
Total votes | 322,656 | 100.0 | ||
Turnout | {{{votes}}} | |||
Democratic hold | ||||
Party | Candidate | Votes | % | |
---|---|---|---|---|
Democratic | John Yarmuth (Incumbent) | 157,056 | 63.5 | |
Republican | Michael MacFarlane | 87,981 | 35.6 | |
Independent | Gregory Peter Puccetti | 2,318 | 0.9 | |
Total votes | 247,355 | 100 | ||
Democratic hold | ||||
Party | Candidate | Votes | % | |
---|---|---|---|---|
Democratic | John Yarmuth (Incumbent) | 212,401 | 63.5 | |
Republican | Harold Bratcher | 122,093 | 36.5 | |
Total votes | 334,494 | 100.00 | ||
Democratic hold | ||||
Party | Candidate | Votes | % | |
---|---|---|---|---|
Democratic | John Yarmuth (Incumbent) | 173,002 | 62.1 | |
Republican | Vickie Yates Glisson | 101,930 | 36.6 | |
Libertarian | Gregory Boles | 3,788 | 1.4 | |
Total votes | 278,720 | 100.00 | ||
Democratic hold | ||||
Party | Candidate | Votes | % | |
---|---|---|---|---|
Democratic | John Yarmuth (Incumbent) | 230,672 | 62.7 | |
Republican | Rhonda Palazzo | 137,425 | 37.3 | |
Total votes | 368,097 | 100.00 | ||
Democratic hold | ||||
Party | Candidate | Votes | % | |
---|---|---|---|---|
Democratic | Morgan McGarvey | 160,920 | 61.9 | |
Republican | Stuart Ray | 98,637 | 38.0 | |
Daniel Cobble (write-in) | 30 | 0.01% | ||
Total votes | 259,587 | 100.00 | ||
Democratic hold | ||||
Year | District 3 | All Districts |
---|---|---|
1935–1943 | ||
1943–1953 | ||
1953–1943 | ||
1963–1973 | ||
1973–1983 | ||
1983–1993 | ||
1993–2003 | ||
2003–2013 | ||
2013–2023 | ||
Texas's 2nd congressional district of the United States House of Representatives is in the southeastern portion of the state of Texas. It encompasses parts of northern and eastern Harris County and southern Montgomery County, Texas.
Since becoming a U.S. state in 1959, Alaska has been entitled to one member in the United States House of Representatives, elected in the state's sole, at-large congressional district. By area, Alaska's congressional district is the largest congressional district in the United States and the third-largest electoral district represented by a single member in the world, behind only Yakutsk district in Russia and Nunavut's sole electoral district in Canada.
Louisiana's 2nd congressional district contains nearly all of the city of New Orleans and stretches west and north to Baton Rouge. The district is currently represented by Democrat Troy Carter. With a Cook Partisan Voting Index rating of D+25, it is the only Democratic district in Louisiana.
Georgia's 5th congressional district is a congressional district in the U.S. state of Georgia. The district was represented by Democrat John Lewis from January 3, 1987, until his death on July 17, 2020. Kwanza Hall was elected to replace Lewis on December 1, 2020, and served until January 3, 2021, when Nikema Williams took his place. Hall was elected in a special election for the balance of Lewis' 17th term. He chose not to run in the general election for a full two-year term, which was won by Williams.
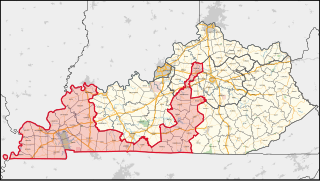
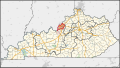
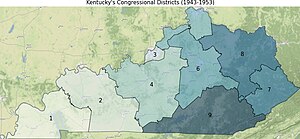
Kentucky's 1st congressional district is a congressional district in the U.S. state of Kentucky. Located in Western Kentucky, and stretching into Central Kentucky, the district takes in Henderson, Hopkinsville, Madisonville, Paducah, Murray, Danville, and Frankfort. The district is represented by Republican James Comer who won a special election to fill the seat of Rep. Ed Whitfield who resigned in September 2016. Comer also won election to the regular term to begin January 3, 2017.
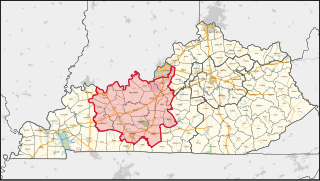
Kentucky's 2nd congressional district is a congressional district in the U.S. state of Kentucky. Located in west central Kentucky, the district includes Bowling Green, Owensboro, Elizabethtown, and a portion of eastern Louisville. The district has not seen an incumbent defeated since 1884.
Kentucky's 4th congressional district is a congressional district in the U.S. state of Kentucky. Located in the northeastern portion of the state, it is a long district that follows the Ohio River. However, the district is dominated by its far western portion, comprising the eastern suburbs of Louisville and Northern Kentucky, the Kentucky side of the Cincinnati area.
Kentucky's 5th congressional district is a congressional district in the U.S. state of Kentucky. Located in the heart of Appalachia in Southeastern Kentucky, it represents much of the Eastern Kentucky Coalfield. The rural district is the second most impoverished district in the nation and, as of the 2010 U.S. census, has the highest percentage of White Americans in the nation. It contains the counties of Bell, Boyd, Breathitt, Clay, Elliot, Floyd, Harlan, Jackson, Johnson, Knott, Knox, Laurel, Lawrence, Lee, Lincoln, Leslie, Letcher, Magoffin, Martin, McCreary, Menifee, Morgan, Owsley, Perry, Pike, Pulaski, Rockcastle, Rowan, Wayne, Whitley, Wolfe, and parts of Bath, and Carter counties. Within the district are the economic leading cities of Ashland, Pikeville, Prestonsburg, Middlesboro, Hazard, Jackson, Morehead, London, and Somerset. It is the most rural district in the United States, with 76.49% of its population in rural areas. It has been represented by Republican Hal Rogers since 1981.
Kentucky's 6th congressional district is a congressional district in the U.S. state of Kentucky. Based in Central Kentucky, the district contains the cities of Lexington, Richmond, and Georgetown. The district is currently represented by Republican Andy Barr.
Ohio's 10th congressional district is represented by Representative Mike Turner (R). The district is based in southwestern Ohio and consists of Montgomery County, Greene County, and a portion of Clark County.
Arizona's 4th congressional district is a congressional district located in the U.S. state of Arizona. It is represented by Democrat Greg Stanton as of the 2022 election. The district is located entirely within Maricopa County.
New York's 20th congressional district is a congressional district for the United States House of Representatives in New York's Capital District. It includes all of Albany, Saratoga, and Schenectady counties, and portions of Rensselaer county.
New York's 16th congressional district is a congressional district for the United States House of Representatives represented by Jamaal Bowman.
Alabama's 7th congressional district is a United States congressional district in Alabama that elects a representative to the United States House of Representatives. The district encompasses Choctaw, Dallas, Greene, Hale, Lowndes, Marengo, Pickens, Perry, Sumter and Wilcox counties, and portions of Clarke, Jefferson, Montgomery and Tuscaloosa counties. The district encompasses portions of the Birmingham, Montgomery and Tuscaloosa/Northport urban areas. The largest city entirely within the district is Selma.
Arkansas's 2nd congressional district is a congressional district located in the central part of the U.S. state of Arkansas and includes the state capital of Little Rock, its suburbs, and surrounding areas. The district leans Republican, with a Cook Partisan Voting Index rating of R+9. However, due to the influence of heavily Democratic Little Rock, it is still considered the least Republican congressional district in Arkansas, which has an all-Republican congressional delegation.
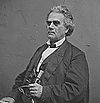
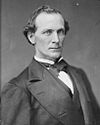
The 2nd congressional district of Tennessee is a congressional district in East Tennessee. It has been represented by Republican Tim Burchett since January 2019. Although the district has taken many forms over the years, it has been centered on Knoxville since 1853. During the American Civil War era, the area was represented in Congress by Horace Maynard. Maynard switched parties many times but was pro-U.S. and did not resign from Congress when Tennessee seceded. Maynard entered Congress in 1857 but did not leave entirely until 1875.
Missouri's 1st congressional district is in the eastern portion of the state. It includes all of St. Louis City and much of northern St. Louis County, including the cities of Maryland Heights, University City, Ferguson and Florissant. With a Cook Partisan Voting Index rating of D+27, it is the most Democratic district in Missouri. Roughly half of the district's population is African American.
Missouri's second congressional district is in the eastern portion of the state, primarily consisting of the suburbs south and west of St. Louis, including Arnold, Town and Country, Wildwood, Chesterfield, and Oakville. The district includes all of Franklin County and portions of St. Louis, St. Charles, and Warren counties. Following redistricting in 2010, the St. Louis Post-Dispatch reported that the district now included more Democratic-leaning voters than it had its 2001–2010 boundaries, but still leaned Republican as a whole. The latest U.S. Census Electorate Profile for the 2nd congressional district estimates there are 581,131 citizens of voting age living in 293,984 households. A primarily suburban district, MO-02 is the wealthiest of Missouri's congressional districts.
Georgia's 7th congressional district is a congressional district in the U.S. state of Georgia. It is currently represented by Democrat Lucy McBath.
Indiana's 5th congressional district is a congressional district in the U.S. state of Indiana comprising Hamilton, Madison, Delaware, Grant, and Tipton counties, as well as the large majority of Howard County. Much of its population is located in the northern suburbs of Indianapolis, including the cities of Carmel, Noblesville, and Fishers, while other population centers include Muncie, Kokomo, Anderson, and Marion. The district is predominantly white and is the wealthiest congressional district in Indiana, as measured by median income.
{{cite web}}
: Missing or empty |title=
(help)