List of U.S. cities by adjusted per capita personal income

Last updated

List of U.S. cities by adjusted per capita personal income estimates the per capita personal income (PCPI) of residents of United States' Metropolitan statistical areas (MSA). A MSA is defined as a central city or cities and their surrounding area of influence. The PCPI is adjusted by differences in the cost of living, called "regional price parities" by the Bureau of Economic Analysis. The effect of adjusting the per capita personal income by the cost of living is to narrow the difference in the standard of living between most high-income cities and most low-income cities.

The BEA defines regional price parities as an estimate of "the differences in price levels across states and metropolitan areas for a given year and are expressed as a percentage of the overall national price level." [1] The BEA defines personal income as follows:

Personal income is the income received by, or on behalf of, all persons from all sources: from participation as laborers in production, from owning a home or business, from the ownership of financial assets, and from government and business in the form of transfers. It includes income from domestic sources as well as the rest of world. It does not include realized or unrealized capital gains or losses. Personal income is estimated before the deduction of personal income taxes and other personal taxes and is reported in current dollars (no adjustment is made for price changes). [2]

Per Capita Personal Income (PCPI) is a more inclusive estimate of the average standard of living of residents in the U.S. than measures of per capita income. PCPI "includes wages, benefits, proprietor income, dividends, interest, rent, and transfer payments" such as Social Security, veteran's benefits, farm subsidies, welfare, and food stamps. [3]

The difference in estimates of per capita income and per capita personal income is large. In 2019, the U.S. Census Bureau calculated a per capita income of the United States as 34,103 dollars. [4] The U.S. Bureau of Economic Analysis calculated the PCPI as 56,490 dollars. [5]

A more valid accounting of the differences in the standard of living of residents in different citizens requires recognition that prices vary from state to state and city to city. In general, a dollar has more purchasing power in the poorer cities than it does in the richer cities. The difference in housing costs from city to city is especially important. The Bureau of Economic Analysis has calculated that the regional price parity in 2019 of the 50 largest MSAs ranges from 88.3 in Birmingham, Alabama (which has the lowest cost of living of the 50 most populous MSAs) to 126.7 in San Jose, California (the highest cost of living of the 50 most populous MSAs). An income of $0.88 in Birmingham equals an income of $1.27 in San Jose with the U.S as a whole having an average PCPI of $1.00. To put it another way, the purchasing power of a dollar compared to the U.S. average is $1.13 in Birmingham and $0.79 in San Jose. The net impact of accounting for differences in the purchasing power of a dollar in different MSAs is to narrow the gap in the standard of living between rich and poor cities. [6]

The statistical analysis is complicated by the various definitions of what constitutes a "city." There are three commonly used definitions:

The population and per capita personal income estimates of metropolitan statistical areas are used in the following table.

Standard Metropolitan statistical areas by PCPI, adjusted by regional price parity

50 largest metropolitan areas Per Capita Personal Income (PCPI) (2019) [7] Rank in PCPI before adjustmentPurchasing power of $1.00 (2019) [8] PCPI after adjustments for purchasing power of dollarRank in PCPI after adjustment
1. New York City-Newark-Jersey City, NY-NJ-PA MSA $79,8444$0.80$63,8757
2. Los Angeles-Long Beach-Anaheim, CA MSA $66,6848$0.84$56,01534
3. Chicago-Naperville-Elgin, IL-IN-WI MSA $63,50014$0.97$61,59518
4. Dallas-Fort Worth-Arlington, TX MSA $58,72522$0.99$58,13827
5. Houston-The Woodlands-Sugar Land, TX MSA $58,89020$0.98$57,71228
6. Washington-Arlington-Alexandria, DC-VA-MD-WV MSA $74,3856$0.85$63,2279
7. Miami-Fort Lauderdale-West Palm Beach, FL MSA $60,96616$0.90$54,86939
8. Philadelphia-Camden-Wilmington, PA-NJ-DE-MD MSA $66,5969$0.95$63,22610
9. Atlanta-Sandy Springs-Alpharetta, GA MSA $54,55732$1.02$55,64836
10. Phoenix-Mesa-Chandler, AZ MSA $48,06547$1.01$48,54648
11. Boston-Worcester-Providence, MA-RI-NH-CT CSA $81,4983$0.87$70,9033
12. San Francisco-Oakland-Berkeley, CA MSA $104,2912$0.74$77,1752
13. Riverside-San Bernardino-Ontario, CA MSA $42,24250$0.93$39,28550
14. Detroit–Warren–Dearborn, MI MSA $54,17235$1.04$56,33932
15. Seattle-Tacoma-Bellevue, WA MSA $78,0735$0.87$67,9244
16. Minneapolis-St. Paul-Bloomington, MN-WI MSA $64,22511$0.97$62,29813
17. San Diego-Chula Vista-Carlsbad, CA MSA $63,72613$0.85$54,16741
18. Tampa-St. Petersburg-Clearwater, FL MSA $48, 90843$1.01$49,39747
19 Denver-Aurora-Lakewood, CO MSA $67,2367$0.96$64,5475
20. St. Louis, MO-IL MSA $56,29327$1.11$63,18511
21. Baltimore-Columbia-Towson, MD MSA $63,98812$0.95$60,78921
22. Charlotte-Concord-Gastonia, NC-SC MSA $53,91643$1.06$57,15130
23. Orlando-Kissimmee-Sanford, FL MSA $45,15649$1.01$45,60849
24. San Antonio-New Braunfels, TX MSA $48,69446$1.07$52,10645
25. Portland-Vancouver-Hillsboro, OR-WA MSA $59,92119$0.95$56,92531
26. Sacramento-Roseville-Folsom, CA MSA $58,84321$0.95$55,90135
27. Pittsburgh-New Castle-Weirton, PA-OH-WV CSA $60,22718$1.01$60,82920
28. Las Vegas-Henderson-Paradise, NV MSA $48,80645$1.03$50,27046
29. Austin-Round Rock-Georgetown, TX MSA $61,97715$1.01$62,59712
30. Cincinnati, OH-KY-IN MSA $56,03329$1.10$61,63616
31. Kansas City, MO-KS MSA $55,00931$1.08$59,40624
32. Columbus, OH MSA $52,47740$1.09$57,20029
33. Indianapolis-Carmel-Anderson, IN MSA $56,36026$1.10$61,96615
34. Cleveland-Elyria, OH MSA $55,45130$1.11$61, 55117
35. San Jose-Sunnyvale-Santa Clara, CA MSA $114,0801$0.79$90,1231
36. Nashville-Davidson–Murfreesboro–Franklin, TN MSA $60,68017$1.06$64,3216
37. Virginia Beach-Norfolk-Newport News, VA-NC MSA $52,01137$1.04$54,09142
38. Providence-Warwick, RI-MA MSA $56,13828$1.00$56,13833
39. Milwaukee-Waukesha, WI MSA $58,45724$1.06$62,06014
40. Jacksonville, FL MSA $51,42136$1.05$53,99243
41. Oklahoma City, OK MSA $48,86044$1.11$54,23540
42. Raleigh-Cary, NC MSA $57,85125$1.04$60,16523
43. Memphis, TN-MS-AR MSA $47,98548$1.12$53,74344
44. Richmond, VA MSA $58,62823$1.04$60,97319
45. New Orleans-Metairie, LA MSA $54,46333$1.07$58,27526
46. Louisville/Jefferson County, KY-IN MSA $52,13438$1.12$58,39025
47. Salt Lake City, UT MSA $54,45034$1.01$54,99538
48. Hartford-East Hartford-Middletown, CT MSA $65,15210$0.98$63,8498
49. Buffalo-Niagara Falls, NY MSA $52,33139$1.06$55,47137
50. Birmingham-Hoover, AL MSA $53,37441$1.13$60,31322
United States $56,490$1.00$56,490

Related Research Articles

<span class="mw-page-title-main">Gross domestic product</span> Market value of goods and services produced within a country

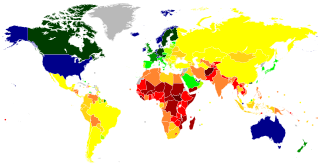
Gross domestic product (GDP) is a monetary measure of the market value of all the final goods and services produced in a specific time period by a country or countries. GDP is most often used by the government of a single country to measure its economic health. Due to its complex and subjective nature, this measure is often revised before being considered a reliable indicator.

<span class="mw-page-title-main">Per capita income</span> Average income of an economy

Per capita income (PCI) or total income measures the average income earned per person in a given area in a specified year. It is calculated by dividing the area's total income by its total population.

Purchasing power parity (PPP) is a measure of the price of specific goods in different countries and is used to compare the absolute purchasing power of the countries' currencies. PPP is effectively the ratio of the price of a basket of goods at one location divided by the price of the basket of goods at a different location. The PPP inflation and exchange rate may differ from the market exchange rate because of tariffs, and other transaction costs.

<span class="mw-page-title-main">Cost of living</span> Cost to maintain a standard of living

Cost of living is the cost of maintaining a certain standard of living. Changes in the cost of living over time can be operationalized in a cost-of-living index. Cost of living calculations are also used to compare the cost of maintaining a certain standard of living in different geographic areas. Differences in cost of living between locations can be measured in terms of purchasing power parity rates. An sharp rise in the cost of living can trigger a cost of living crisis where purchasing power is lost and the previous lifestyle is no longer affordable.

<span class="mw-page-title-main">Gross national income</span> Total domestic and foreign economic output claimed by residents of a country

The gross national income (GNI), previously known as gross national product (GNP), is the total domestic and foreign output claimed by residents of a country, consisting of gross domestic product (GDP), plus factor incomes earned by foreign residents, minus income earned in the domestic economy by nonresidents. Comparing GNI to GDP shows the degree to which a nation's GDP represents domestic or international activity. GNI has gradually replaced GNP in international statistics. While being conceptually identical, it is calculated differently. GNI is the basis of calculation of the largest part of contributions to the budget of the European Union. In February 2017, Ireland's GDP became so distorted from the base erosion and profit shifting ("BEPS") tax planning tools of U.S. multinationals, that the Central Bank of Ireland replaced Irish GDP with a new metric, Irish Modified GNI. In 2017, Irish GDP was 162% of Irish Modified GNI.

<span class="mw-page-title-main">Lynchburg metropolitan area</span> Metropolitan Statistical Area in Virginia, United States

The Lynchburg Metropolitan Statistical Area is a United States Metropolitan Statistical Area (MSA) in the state of Virginia, as defined by the Office of Management and Budget (OMB) as of June 2003. As of the 2000 census, the MSA had a population of 228,616. In 2009 this was estimated to have risen to 247,447; as of 2016, the Lynchburg MSA was estimated to have a population of 260,320, making it the fifth-largest metro area in the state.

<span class="mw-page-title-main">Billings Metropolitan Statistical Area</span>

Gross metropolitan product (GMP) is a monetary measure of the value of all final goods and services produced within a metropolitan statistical area during a specified period. GMP estimates are commonly used to compare the relative economic performance among such areas.

<span class="mw-page-title-main">Household income in the United States</span> US family income

Household income is an economic standard that can be applied to one household, or aggregated across a large group such as a county, city, or the whole country. It is commonly used by the United States government and private institutions to describe a household's economic status or to track economic trends in the US.

Per capita personal income in the United States was estimated for 2021 by the International Monetary Fund to be US $68,309. One of the most commonly used metrics for gauging economic performance and shifting fortunes of local economies is per capita income (PCI). It is measured as the amount of wage and compensation disbursements, other labor income, proprietors' income with inventory valuation and capital consumption adjustments, persons' rental income with capital consumption adjustments, personal dividend income, personal interest income, and transfer payments to persons, less personal social insurance contributions. The Per Capita Personal Income of the United States defines the personal income of a specific area, earned by or on behalf of all of the persons who live in the area. As a result, personal income figures are presented by the income recipients' place of residence. This measure of income is calculated as the personal income of the residents of a given area divided by the resident population of the area. The Bureau of Economic Analysis (BEA) uses the United States Census Bureau's annual midyear population projections to calculate per capita personal income for states and counties. Except for college students and other seasonal populations, which are counted on April 1, the population for all other groups is counted on July 1.

<span class="mw-page-title-main">Personal income in the United States</span>

Personal income is an individual's total earnings from wages, investment interest, and other sources. The Bureau of Labor Statistics reported a median weekly personal income of $1,037 for full-time workers in the United States in Q1 2022. For the year 2020, the U.S. Census Bureau estimates that the median annual earnings for all workers was $41,535; and more specifically estimates that median annual earnings for those who worked full-time, year round, was $56,287.

The Lafayette-West Lafayette, Indiana Metropolitan Statistical Area, as defined by the United States Census Bureau, is an area consisting of three counties in Indiana, anchored by the cities of Lafayette and West Lafayette. As of the July 1, 2021, the MSA had an estimated population of 224,709. Metro area population in 2021 is 237,130 and was 235,066 in 2020, a growth of 16% over 2010. In 2010, the Lafayette, Indiana, metro area population was 210,297.

References

  1. "Regional Price Parities by State and Metro Area". Bureau of Economic Analysis. Retrieved 25 January 2021.
  2. "Personal Income by County and Metropolitan Area, 2019" (PDF). Bureau of Economic Analysis. Retrieved 24 January 2021.
  3. "What is the difference between GDP and personal Income?". Montana.gov: Official State Website. Retrieved 24 January 2021.
  4. "Quick Facts: United States Census Bureau". United States Census Bureau. Retrieved 24 January 2021.
  5. "Press Release: Real Personal Income by State and Metro Area in 2019" (PDF). Bureau of Economic Analysis. Retrieved 24 January 2021.
  6. Sauter, Michael B. (25 November 2020). "Arkansas, Mississippi are among the states where a dollar has the highest value". USA Today: Money. Retrieved 24 January 2021.
  7. Personal Income BEA.
  8. Press Release BEA.