Manufacturing output in the United States is at an all-time high as of 2023, but employment in the sector has been stagnant following a lengthy decline in the late 20th century.
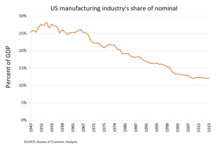
As of December 2016, the U.S. manufacturing industry employed 12.35 million people. A year later, in December 2017, U.S. manufacturing employment grew by 207,000, or 1.7%, employees.[3] Though still a large part of the US economy, in Q1 2018 manufacturing contributed less to GDP than the 'Finance, insurance, real estate, rental, and leasing' sector, the 'Government' sector, or 'Professional and business services' sector.[3]
Manufacturing output recovered from the Great Recession, reaching an all-time high in 2021, but manufacturing employment has been declining since the 1990s, giving rise to what is known as a "jobless recovery," which made job creation or preservation in the manufacturing sector an important topic in the 2016 United States presidential election.[4]
Employment
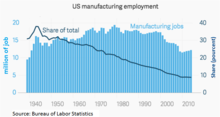
U.S. manufacturing employmentU.S. manufacturing industry's share of nominal GDP
Manufacturing jobs helped build out the U.S. middle class following World War II, as the U.S. established pro-labor policies and faced limited global competition. Between 1980 and 1985, and then again 2001 to 2009, there were precipitous declines in US manufacturing jobs; it is estimated that 1/3 of U.S. manufacturing jobs vanished in the eight years between 2001 and 2009, and few have returned, the worst period for U.S. manufacturing since the Great Depression.[5]
Since 1979, the number of U.S. manufacturing employment has been declining, especially the sharp decline in 2001 and 2007. The way in which employment in the U.S. manufacturing industry has fallen provides a series of potential policy responses including insights into how the industry is changing, and unemployment.[6]
There are several possible explanations for the decline. Bill Lazonick argues that legalization of companies buying their own shares of stock in 1982 has led to sustained stock market bubbles that distorted investment away from physical plant.[7] Others point to automation or developments outside the United States, such as the rise of China, globalized free trade, and supply chain innovation. These have arguably resulted in the off-shoring of thousands of U.S. manufacturing facilities and millions of manufacturing jobs to lower-wage countries. Meanwhile, technological innovation has increased productivity significantly, meaning that manufacturing output in the United States has increased by 80% since the 1980s, despite large job losses in the manufacturing sector during that same period.[8][9]
The Bureau of Labor Statistics (BLS) forecast in October 2017 that manufacturing employment would fall from 12.3 million in 2016 to 11.6 million in 2026, a decline of 736,000 employees over a decade. As a share of employment, manufacturing was estimated to fall from 7.9% of the total U.S. economy in 2016 to 6.9% of it in 2026, continuing a long-term downward trend.[10]
The U.S. manufacturing industry employed 12.4 million people in March 2017,[3] generating output (nominal GDP) of $2.2 trillion in Q3 2016, with real GDP of $1.9 trillion in 2009 dollars.[11] The share of persons employed in manufacturing relative to total employment has steadily declined since the 1960s. Employment growth in industries such as construction, finance, insurance and real estate, and services industries played a significant role in reducing manufacturing's overall share of U.S. employment. In 1990, services surpassed manufacturing as the largest contributor to overall private industry production, and then the finance, insurance and real estate sector surpassed manufacturing in 1991.
Since the entry of China into the World Trade Organization in December 2001, the decline in manufacturing jobs has accelerated.[8] The U.S. goods trade deficit (imports greater than exports) with China was approximately $350 billion in 2016.[12] However it is possible that the import of goods from China is a result rather than a cause. The US stock market also ended a sustained fourteen year bubble in 2001, and the ensuing job loss pushed a significant portion of US population below the poverty line.
The Economist reported in January 2017 that manufacturing historically created good paying jobs for workers without a college education, particularly for men. The jobs paid well enough so that women did not have to work when they had young children. Unions were strong and owners did not want to risk strikes in their factories due to large capital investments and significant on the job training. Such jobs are much less available in the post-2001 era in the U.S. though they remain available in Germany, Switzerland and Japan, leading to calls to bring those jobs back from overseas, establish protectionism, and reduce immigration. Making it illegal for companies to purchase shares of their own stock has not yet gained traction as a remedy for the diversion of operating profits away from reinvestment in equipment and people. Manufacturing continues to evolve, due to factors such as information technology, supply chain innovations such as containerization, companies un-bundling tasks that used to be in one location or business, reduced barriers to trade, and competition from low-cost developing countries such as China and Mexico. Competition from high wage nations such as Germany is also increasing.[4]
History
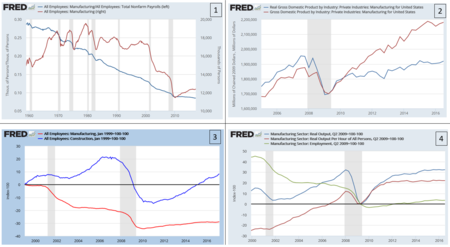
Panel showing four manufacturing charts, illustrating trends in employment, output, and productivity
Between 1980 and 1985, U.S. manufacturing was impacted negatively as Japanese productivity rose at a rapid rate, leading to a fall of 12% in Japanese products, and the increase in U.S. interest rates that led to the appreciation of the U.S. dollar. This was the opposite policy from that which a rise in Japanese productivity would have dictated, and the US policy action made Japanese products 30% cheaper than American until 1986. The US machine tool sector never recovered from this body blow.[13] Between 1983 and 2005, U.S. exports grew by 340%, with exports of manufactured goods increasing by 407% over this period.
In 1983, the primary export commodities of the U.S. was transportation equipment, computer and electronic products, agricultural products, machinery (except electrical), chemicals, and food and kindred products. Together these commodities totaled 69 percent of total U.S. exports. By 2005, the primary export commodities were largely the same: computer and electronic products, transportation equipment, chemicals, machinery (except electrical), miscellaneous manufactured commodities, and agricultural products. Together these commodities accounted for 69 percent of total U.S. merchandise exports.
Between 1983 and 2005, exports of computer and electronic products grew by 493%, overtaking transportation as the leading export commodity, which grew by 410%. Though agricultural products exports grew by 26% during this period, its share of overall merchandise exports fell from 12% in 1983 to 4% in 2005.
In 2005, the top markets for U.S. exports were Canada (24%), Mexico (13%), Japan (6%), China (5%), United Kingdom (4%), Germany (4%), South Korea (3%), the Netherlands (3%), France (2%), and Taiwan (2%). Between 1983 and 2005, exports to Mexico increased by 1,228%, allowing it to replace Japan as the second-largest market for U.S. exports.
In the first quarter of 2010, overall U.S. merchandise exports increased by 20 percent compared to the first quarter of 2009, with manufactured goods exports increasing by 20 percent. As in 2009, the highest export commodities were transportation equipment, computer and electronic products, chemicals, machinery (except electrical), agricultural products, and miscellaneous manufactured commodities.
In the first quarter of 2010, the primary markets for U.S. merchandise exports were Canada, Mexico, China, Japan, the United Kingdom, Germany, South Korea, Brazil, the Netherlands, and Singapore. With the exception of the Netherlands, exports to all of these countries increased in the first quarter of 2010, compared to the same quarter in 2009. Notably, exports to Canada increased by 22 percent, Mexico by 28 percent, and China by 47 percent over this period. Exports to the two NAFTA partners accounted for nearly one-third (32%) of U.S. merchandise trade in the first quarter of 2010.
The panel chart in this section includes four diagrams describing manufacturing labor, output, and productivity historical trends through 2016:
Figure 1-Job measures: The blue line (left axis) is the ratio of manufacturing jobs to the total number of non-farm payroll jobs. It has declined since the 1960s as manufacturing jobs fell and services expanded. The red line (right axis) is the number of manufacturing jobs (000s), which had fallen by nearly one-third since the late 1990s.[14]
Figure 2-Output measures: Real (inflation adjusted) GDP (blue line) and nominal GDP (red line) from the manufacturing sector. While both rose from the trough due to the Great Recession, the real GDP had yet to regain its pre-crisis (2007) level as of 2016.[15]
Figure 3-Job measures, indexed: The red line shows the percent change in manufacturing jobs, measured relative to the 1999 as the starting point. The blue line shows construction jobs. Both were below pre-crisis levels in 2016.[16]
Figure 4-Productivity measures, indexed: Measured from the end of the recession (June 2009), employment (green line) is up about 5%, but real output is up over 30%, indicating a significant gain in productivity (i.e., output per labor hour).[17]
Forecast
Bethlehem Steel in Bethlehem, Pennsylvania was one of the world's leading steel manufacturers for most of the 20th century. But in 1982, it discontinued most of its operations, declared bankruptcy in 2001, and was dissolved in 2003.
10.5 of the 11.5 million net jobs created (90%) over the 2016–2026 period would be in services. The service jobs growth rate would be about 0.8%. However, the goods producing sector, which includes manufacturing, would only add 219,000 jobs over that period, growing at a rate of 0.1%.[18]
Manufacturing employment would fall from 12.3 million in 2016 to 11.6 million in 2026, a decline of 736,000. As a share of employment, manufacturing would fall from 7.9% in 2016 to 6.9% in 2026.[10]
Employment in production occupations (a subset of manufacturing) was expected to fall from 9.4 million in 2016 to 9.0 million in 2026 (a 4% decline), falling from 6.0% of employment to 5.4%.[19]
According to the Semiconductor Industries Association, by the end of 2022, the chip industry has committed almost $200 billion to build and expand 40 plants in 16 states, creating 40,000 future jobs. According to the Natural Resources Defense Council, a similar amount has been promised to US factories making electric cars and batteries.[20]
U.S. manufacturing employment has declined steadily as a share of total employment, from around 28% in 1960 to 8% in March 2017. Manufacturing employment has fallen from 17.2 million persons in December 2000 to 12.4 million in March 2017, a decline of about 5.7 million or about one-third even as the U.S.population ballooned from 220 million to 330 million in the same time frame.[3] An estimated 1–2 million of the job losses in manufacturing 1999–2011 were due to competition with China (the China shock), which entered the World Trade Organization in December 2001.[8] The Economic Policy Institute estimated that the trade deficit with China cost about 2.7 million jobs between 2001 and 2011, including manufacturing and other industries.[21]
While U.S. manufacturing employment is down, output was near a record level in 2017 in real GDP terms, indicating productivity (output per worker) has also improved significantly.[22] This is likely due to automation, global supply chains, process improvements, and other technology changes.[8]
Economist Paul Krugman argued in December 2016 that "America's shift away from manufacturing doesn't have much to do with trade, and even less to do with trade policy." He also cited the work of other economists indicating that the declines in manufacturing employment from 1999 to 2011 due to trade policy generally and trade with China specifically were "less than a fifth of the absolute loss of manufacturing jobs over the period" but that the effects were significant for regions directly impacted by those losses.[23]
Modern overview
The United States is the world's third largest manufacturer (after China and the European Union) with a record high real output in Q1 2018 of $2.00 trillion (i.e., adjusted for inflation in 2009 Dollars) about one percent above the 2007 peak before the Great Recession of $1.95 trillion.[11] The U.S. manufacturing industry employed 12.35 million people in December 2016 and 12.56 million in December 2017, an increase of 207,000 or 1.7%.[3]
Historically, manufacturing has provided relatively well-paid blue-collar jobs, although this has been affected by globalization and automation.
Manufacturing continues to evolve, due to factors such as information technology, supply chain innovations such as containerization, companies un-bundling tasks that used to be in one location or business, reduced barriers to trade, and competition from low-cost developing countries such as China and Mexico.[4]
Manufacturing is conducted among globally distributed supply chains, with various stages of production conducted in different countries.[24] For example, automotive parts may be manufactured in the U.S., shipped to Mexico for assembly, then sent back to the U.S. In some cases, the components of the final product cross the border multiple times. An estimated 40% of the value of U.S. imports from Mexico is from content produced in the U.S.; this figure is 25% for Canada but only 4% for China. This "production sharing" is an indication of the integrated nature of the supply chains between the U.S., Mexico and Canada in the NAFTA region.[25]
Trade balance
During 2016, the U.S. exported $1,051 billion in manufactured goods and imported $1,920 billion, a manufacturing goods deficit of $868 billion. The largest exports were transportation equipment ($252B), Chemicals ($174B), Computers and Electronic Products ($116B) and "Machinery-Except Electrical" ($109B).[26]
Industries
As of 2019, durable and nondurable goods manufacturing account for $3.1t and $3t of gross output of GDP, respectively.[27]
However, 2023 research from McKinsey states that GDP numbers don't accurately capture manufacturing's economic impact. In its findings, while manufacturing accounted for 11 percent of US GDP and 8 percent of direct employment, it drove 20 percent of capital investment, 30 percent of productivity growth, 60 percent of the country's exports, and garnered 70 percent of business research and development funding. [28]
"The United States' share of global manufacturing activity declined from 28% in 2002, following the end of the 2001 U.S. recession, to 16.5% in 2011. Since then, the U.S. share has risen to 18.6%, the largest share since 2009. These estimates are based on the value of each country's manufacturing in U.S. dollars; part of the decline in the U.S. share was due to a 23% decline in the value of the dollar between 2002 and 2011, and part of the rise since 2011 is attributable to a stronger dollar.
China displaced the United States as the largest manufacturing country in 2010. Again, part of China's rise by this measure has been due to the appreciation of its currency, the renminbi, against the U.S. dollar. The reported size of China's manufacturing sector decreased slightly in 2015 due to currency adjustments.
Manufacturing output, measured in each country's local currency adjusted for inflation, has been growing more slowly in the United States than in China, South Korea, Germany, and Mexico, but more rapidly than in most European countries and Canada.
Employment in manufacturing has fallen in most major manufacturing countries over the past quarter-century. In the United States, manufacturing employment since 1990 has declined in line with the changes in Western Europe and Japan, although the timing of the decline has differed from country to country.
U.S. manufacturers spend far more on research and development (R&D) than those in any other country, but manufacturers' R&D spending is rising more rapidly in several other countries.
Manufacturers in many countries appear to be spending increasing amounts on R&D, relative to their value added. U.S. manufacturers spend approximately 11% of value added on R&D, an increase of more than three percentage points since 2002. A large proportion of U.S. manufacturers' R&D takes place in high technology sectors, such as pharmaceutical, electronics, and aircraft manufacturing, whereas in most other countries the largest share of R&D occurs in medium-technology sectors such as automotive and machinery manufacturing."[29]
McCormack, Richard; Prestowitz, Clyde; Heidenger, Kate; Russo, John (2009). Manufacturing a Better Future for America. Alliance for American Manufacturing. p.0615288197.
Related Research Articles
The economy of Canada is a highly developed mixed economy, with the world's tenth-largest economy as of 2023, and a nominal GDP of approximately US$2.117 trillion. Canada is one of the world's largest trading nations, with a highly globalized economy. In 2021, Canadian trade in goods and services reached $2.016 trillion. Canada's exports totalled over $637 billion, while its imported goods were worth over $631 billion, of which approximately $391 billion originated from the United States. In 2018, Canada had a trade deficit in goods of $22 billion and a trade deficit in services of $25 billion. The Toronto Stock Exchange is the tenth-largest stock exchange in the world by market capitalization, listing over 1,500 companies with a combined market capitalization of over US$3 trillion.
The economy of Eritrea has undergone extreme changes after the War of Independence. It experienced considerable growth in recent years, indicated by an improvement in gross domestic product in 2011 of 8.7 percent and in 2012 of 7.5% over 2011, and has a total of $8.090 billion as of 2020. However, worker remittances from abroad are estimated to account for 32 percent of gross domestic product.
The economy of Ethiopia is a mixed and transition economy with a large public sector. The government of Ethiopia is in the process of privatizing many of the state-owned businesses and moving toward a market economy. The banking, telecommunication and transportation sectors of the economy are dominated by government-owned companies.
The economy of Honduras is based mostly on agriculture, which accounts for 14% of its gross domestic product (GDP) in 2013. The country's leading export is coffee (US$340 million), which accounted for 22% of the total Honduran export revenues. Bananas, formerly the country's second-largest export until being virtually wiped out by 1998's Hurricane Mitch, recovered in 2000 to 57% of pre-Mitch levels. Cultivated shrimp is another important export sector. Since the late 1970s, towns in the north began industrial production through maquiladoras, especially in San Pedro Sula and Puerto Cortés.
The economy of Kyrgyzstan is heavily dependent on the agricultural sector. Cotton, tobacco, wool, and meat are the main agricultural products, although only tobacco and cotton are exported in any quantity. According to Healy Consultants, Kyrgyzstan's economy relies heavily on the strength of industrial exports, with plentiful reserves of gold, mercury and uranium. The economy also relies heavily on remittances from foreign workers. Following independence, Kyrgyzstan was progressive in carrying out market reforms, such as an improved regulatory system and land reform. In 1998, Kyrgyzstan was the first Commonwealth of Independent States (CIS) country to be accepted into the World Trade Organization. Much of the government's stock in enterprises has been sold. Kyrgyzstan's economic performance has been hindered by widespread corruption, low foreign investment and general regional instability. Despite those issues, Kyrgyzstan is ranked 70th on the ease of doing business index.
The economy of Nicaragua is focused primarily on the agricultural sector. Nicaragua itself is the least developed country in Central America, and the second poorest in the Americas by nominal GDP. In recent years, under the administrations of Daniel Ortega, the Nicaraguan economy has expanded somewhat, following the Great Recession, when the country's economy actually contracted by 1.5%, due to decreased export demand in the American and Central American markets, lower commodity prices for key agricultural exports, and low remittance growth. The economy saw 4.5% growth in 2010 thanks to a recovery in export demand and growth in its tourism industry. Nicaragua's economy continues to post growth, with preliminary indicators showing the Nicaraguan economy growing an additional 5% in 2011. Consumer Price inflation have also curtailed since 2008, when Nicaragua's inflation rate hovered at 19.82%. In 2009 and 2010, the country posted lower inflation rates, 3.68% and 5.45%, respectively. Remittances are a major source of income, equivalent to 15% of the country's GDP, which originate primarily from Costa Rica, the United States, and European Union member states. Approximately one million Nicaraguans contribute to the remittance sector of the economy.
The economy of Pakistan is classified as a developing economy. It is the 24th-largest in terms of GDP based on purchasing power parity (PPP) and 46th largest in terms of nominal GDP. As of 2023, the country has a population of 232 million people. According to the International Monetary Fund (IMF), on a per capita income basis, Pakistan ranked 161st by GDP (nominal) and 138th by GDP (PPP).
The economy of Paraguay is a market economy that is highly dependent on agriculture products. In recent years, Paraguay's economy has grown as a result of increased agricultural exports, especially soybeans. Paraguay has the economic advantages of a young population and vast hydroelectric power. Its disadvantages include the few available mineral resources, and political instability. The government welcomes foreign investment.
The economy of Eswatini is fairly diversified. Agriculture, forestry and mining account for about 13 percent of Eswatini's GDP whereas manufacturing represent 37 percent of GDP. Services – with government services in the lead – constitute the other 50 percent of GDP.
The United States is a highly developed/advanced market economy. It is the world's largest economy by nominal GDP, and the second-largest by purchasing power parity (PPP) behind China. It has the world's seventh-highest per capita GDP (nominal) and the eighth-highest per capita GDP (PPP) as of 2022. The U.S. accounted for 25.4% of the global economy in 2022 in nominal terms, and around 15.6% in PPP terms. The U.S. dollar is the currency of record most used in international transactions and is the world's reserve currency, backed by a large U.S. treasuries market, its role as the reference standard for the petrodollar system, and its linked eurodollar. Several countries use it as their official currency and in others it is the de facto currency.
The electronics industry in China grew rapidly after the liberalization of the economy under the national strategic policy of accelerating the "informatization" of its industrial development. Subsequently, labour costs have risen and creating wealth for citizens. The industry has been a major contribution to the modernization of China and the development of new job opportunities. There are many instances of labour exploitation and subpar working conditions.
Industry is 39.4% of China's gross domestic product (GDP) in 2022. In 2007, industry contributed 46.7 percent of GDP in 2010 and occupied 27 percent of the workforce. In 2015, the manufacturing industrial sectors contributed to 40% of China's GDP. The manufacturing sector produced 44.1 percent of GDP in 2004 and accounted for 11.3 percent of total employment in 2006.
The economy of Antigua and Barbuda is service-based, with tourism and government services representing the key sources of employment and income. Tourism accounts directly or indirectly for more than half of GDP and is also the principal earner of foreign exchange in Antigua and Barbuda. However, a series of violent hurricanes since 1995 resulted in serious damage to tourist infrastructure and periods of sharp reductions in visitor numbers. In 1999 the budding offshore financial sector was seriously hurt by financial sanctions imposed by the United States and United Kingdom as a result of the loosening of its money-laundering controls. The government has made efforts to comply with international demands in order to get the sanctions lifted. The dual island nation's agricultural production is mainly directed to the domestic market; the sector is constrained by the limited water supply and labor shortages that reflect the pull of higher wages in tourism and construction. Manufacturing comprises enclave-type assembly for export with major products being bedding, handicrafts, and electronic components. Prospects for economic growth in the medium term will continue to depend on income growth in the industrialized world, especially in the US, which accounts for about one-third of all tourist arrivals. Estimated overall economic growth for 2000 was 2.5%. Inflation has trended down going from above 2 percent in the 1995-99 period and estimated at 0 percent in 2000.
North American Free Trade Agreement's impact on United States employment has been the object of ongoing debate since the 1994 inception of the North American Free Trade Agreement (NAFTA) with Canada and Mexico. NAFTA's proponents believe that more jobs were ultimately created in the USA. Opponents see the agreements as having been costly to well-paying American jobs.
Unemployment in the United States discusses the causes and measures of U.S. unemployment and strategies for reducing it. Job creation and unemployment are affected by factors such as economic conditions, global competition, education, automation, and demographics. These factors can affect the number of workers, the duration of unemployment, and wage levels.
The share of the industry of Colombia in the country's gross domestic product (GDP) has shifted significantly in the last few decades. Data from the World Bank show that between 1965 and 1989 the share of industry—including construction, manufacturing, and mining—increased from 27 percent to 38 percent of GDP. However, since then the share has fallen considerably, down to approximately 29 percent of GDP in 2007. This pattern is about the average for middle-income countries.
The textile industry is the largest manufacturing industry in Pakistan. Pakistan is the eighth largest exporter of textile commodities in Asia. Textile sector contributes 8.5% to the GDP of Pakistan. In addition, the sector employs about 45% of the total labor force in the country. Pakistan is the fourth largest producer of cotton with the third largest spinning capacity in Asia after China and India and contributes 5% to the global spinning capacity. At present, there are 1,221 ginning units, 442 spinning units, 124 large spinning units and 425 small units which produce textile.
Deindustrialisation refers to the process of social and economic change caused by the removal or reduction of industrial activity and employment in a country or region, especially heavy industry or manufacturing industry. Deindustrialisation is common to all mature Western economies, as international trade, social changes, and urbanisation have changed the financial demographics after World War II. Phenomena such as the mechanisation of labour render industrial societies obsolete, and lead to the de-establishment of industrial communities.
Job creation and unemployment are affected by factors such as aggregate demand, global competition, education, automation, and demographics. These factors can affect the number of workers, the duration of unemployment, and wage rates.
The North American Free Trade Agreement of 1994's effects on Mexico have long been overshadowed by the debate on the Agreement's effects on the economy of the United States. As a kind partner in the agreement, the effects that NAFTA has had on the Mexican economy is essential to understanding NAFTA on a whole. A key factor in this discussion is the way the Agreement was presented to Mexico; namely, that it would increase development of the Mexican economy by providing more middle class jobs that would enable more Mexicans to lift themselves out of the lower classes. Thus, wages, employment, attitudes, and migration all present essential areas of analyses to understand effects NAFTA has had on the Mexican economy.
This page is based on this Wikipedia article Text is available under the CC BY-SA 4.0 license; additional terms may apply. Images, videos and audio are available under their respective licenses.