Net international investment position

Last updated
US Net International Investment Position US Net International Investment Position.png
US Net International Investment Position

The net international investment position (NIIP) is the difference in the external financial assets and liabilities of a country. [1] External debt of a country includes government debt and private debt. External assets publicly and privately held by a country's legal residents are also taken into account when calculating NIIP. [2] Commodities and currencies tend to follow a cyclical pattern of significant valuation changes, which is also reflected in NIIP.

Contents

The International investment position (IIP) of a country is a financial statement of the value and composition of its external financial assets and liabilities. A positive NIIP value indicates that a nation is a creditor nation, while a negative value indicates that it is a debtor nation.

World

In 1980, the United States net international-creditor position was bigger than the total net creditor-positions of all the other countries in the world. [3] Only six years later, in 1986, when the nation’s international investment position was at a year-end negative $107.4 billion, the U.S. became a net-debtor nation for the first time since 1914, when its nominal debt had reached $2 billion. [4] By 1990, the U.S. was the world's largest debtor [3] By end-2020, the country’s net international-investment position was a negative $14 trillion, an amount representing how much more the U.S. owed to the rest of the world than the rest of the world owed to the U.S. [5] At the end of 2022, it stood at a negative -$16 trillion. [6]

List of countries and regions by net international investment position (NIIP)

Countries and regionsDateNIIP [7]

(US$MM)

Date GDP [8]

(US$MM)

DateNIIP

(%GDP)

Flag of Albania.svg  Albania 2021Q1-9,028202117,1382019−52.1
Flag of Andorra.svg  Andorra 2020+7,658 [9] [10] 20202,890 [10] 2020265 [9]
Flag of Argentina.svg  Argentina 2021Q1+128,6272021418,150201926.3
Flag of Armenia.svg  Armenia 2021Q1-10,124202112,2512019−73.1
Flag of Australia (converted).svg  Australia 2021Q1-664,90020211,617,5432021−41.1
Flag of Austria.svg  Austria 2021Q1+58,6622021481,7962023Q217.6 [11]
Flag of Bangladesh.svg  Bangladesh 2021Q1-44,6732021352,9082019−13.5
Flag of Belarus.svg  Belarus 2021Q1-31,417202160,7252021−51.7
Flag of Belgium (civil).svg  Belgium 2021Q1+263,1322021578,9962023Q259.1 [11]
Flag of Bhutan.svg  Bhutan 2021Q1-2,58520212,4802021−104.2
Flag of Brazil.svg  Brazil 2021Q1-460,18120211,491,7722019−39.6
Flag of Bulgaria.svg  Bulgaria 2021Q1-17,228202177,7822023Q2−13.2 [11]
Flag of Cambodia.svg  Cambodia 2021Q1-25,658202127,2392021−94.2
Flag of Canada (Pantone).svg  Canada 2021Q1+1,105,74420211,883,487202158.7
Flag of Chile.svg  Chile 2021Q1-28,9892021307,9382021−9.4
Flag of the Democratic Republic of the Congo.svg  Democratic Republic of the Congo 2018-19,779202155,0882018−42.0
Flag of Colombia.svg  Colombia 2021Q1-171,9152021295,6102019−51.7
Flag of the People's Republic of China.svg  People's Republic of China 2021Q1+2,140,041202116,642,318202112.9
Flag of Croatia.svg  Croatia 2020-31,558202165,2172023Q2−25.1 [11]
Flag of Cyprus.svg  Cyprus 2021Q1-35,545202126,4792023Q2−99.7 [11]
Flag of the Czech Republic.svg  Czech Republic 2021Q1-24,5072021276,1092023Q2−16.9 [11]
Flag of Denmark.svg  Denmark 2021Q1+278,3072021392,5702023Q261.7 [11]
Flag of Egypt.svg  Egypt 2021Q1-209,5992021394,2842021−53.2
Flag of Estonia.svg  Estonia 2021Q1-6,872202135,1872023Q2−22.7 [11]
Flag of Finland.svg  Finland 2021Q1+24,3032021300,4842023Q23.1 [11]
Flag of France.svg  France 2021Q1-889,17120212,938,2712023Q2−29.9 [11]
Flag of Germany.svg  Germany 2021Q1+3,055,92220214,319,2862023Q268.6 [11]
Flag of Greece.svg  Greece 2021Q1-352,2722021209,8572023Q2−144.2 [11]
Flag of Hong Kong.svg  Hong Kong 2021Q1+2,163,1552021368,6332021586.8
Flag of Hungary.svg  Hungary 2021Q1-74,4502021176,5432023Q2−50.6 [11]
Flag of Iceland.svg  Iceland 2021Q1+8,466202124,1552019(Q1)21 [12]
Flag of India.svg  India 2021-379,30020213,049,704March 2020−14 [13]
Flag of Indonesia.svg  Indonesia 2021Q1-268,59720211,158,7832019−30.4
Flag of Ireland.svg  Ireland 2020Q3-705,9622021476,6632023Q2−108.8 [11]
Flag of Israel.svg  Israel 2021Q1+190,5552021446,708202142.7
Flag of Italy.svg  Italy 2021Q1+40,17620212,106,2872023Q25.3 [11]
Flag of Japan.svg  Japan 2021Q1+3,375,84920215,378,136202162.8
Flag of Kazakhstan.svg  Kazakhstan 2021Q1-74,2042021187,8362019−36.2
Flag of Kuwait.svg  Kuwait 2020+89,8472021126,930201969.7
Flag of Latvia.svg  Latvia 2021Q1-11,806202137,7202023Q2−26.2 [11]
Flag of Lithuania.svg  Lithuania 2021Q1-7,821202162,1982023Q2−2.6 [11]
Flag of Luxembourg.svg  Luxembourg 2021Q1+40,328202184,0772021Q243.4 [11]
Flag of Malaysia.svg  Malaysia 2021Q1+25,5892021387,09320205.9
Flag of Malta.svg  Malta 2020Q3+9,100202116,4762023Q276.4 [11]
Flag of Mexico.svg  Mexico 2021Q1-586,52820211,192,4802019−51.4
Flag of Mongolia.svg  Mongolia 2021Q1-37,419202114,2332021−262.9
Flag of Montenegro.svg  Montenegro 2018-9,04420215,6512018−178.8
Flag of Mozambique.svg  Mozambique 2021Q1-59,996202113,9572021−429.9
Flag of the Netherlands.svg  Netherlands 2021Q1+959,04920211,012,5982023Q268.5 [11]
Flag of New Zealand.svg  New Zealand 2021Q1-112,4882021243,3322019−46.2
Flag of Nicaragua.svg  Nicaragua 2020-14,456202112,2832019−119.9
Flag of Nigeria.svg  Nigeria 2020-85,2112021514,0492019−16.3
Flag of Norway.svg  Norway 2021Q1+1,175,7812021444,5192021264.5
Flag of Pakistan.svg  Pakistan 2021Q1-116,9352021262,7992021−44.5
Flag of Panama.svg  Panama 2020-64,857202159,3772020−122.5
Flag of Peru.svg  Peru 2020Q2-86,0782021225,9182018−37.4
Flag of the Philippines.svg  Philippines 2021Q1-15,3222021402,6382020−5.6
Flag of Poland.svg  Poland 2021Q1-254,6232021642,1212023Q2−32.2 [11]
Flag of Portugal.svg  Portugal 2021Q1-246,9612021257,3912023Q2−76.9 [11]
Flag of Romania.svg  Romania 2021Q1-121,4382021289,1302023Q2−40.0 [11]
Flag of Russia.svg  Russia 2021Q1+458,53320211,710,734202126.8
Flag of Saudi Arabia.svg  Saudi Arabia 2021Q1+587,8832021804,921202173.0
Flag of Serbia.svg  Serbia 2021Q1-49,970202160,4352019−88.5
Flag of Singapore.svg  Singapore 2021Q1+1,035,0822021374,9342021276.1
Flag of Slovakia.svg  Slovakia 2021Q1-67,7852021117,6642023Q2−57.6 [11]
Flag of Slovenia.svg  Slovenia 2021Q1-4,876202159,1322023Q20.7 [11]
Flag of South Africa.svg  South Africa 2021Q1+97,3422021329,529202129.5
Flag of South Korea.svg  South Korea 2021Q1+477,51720211,806,707202126.4
Flag of Spain.svg  Spain 2021Q1-1,096,59420211,461,5522023Q2−56.6 [11]
Flag of Sudan.svg  Sudan 2018-85,180202135,8272018−248.5
Flag of Sweden.svg  Sweden 2021Q1+116,4272021625,9482023Q244.0 [11]
Flag of Switzerland (Pantone).svg  Switzerland 2021Q1+808,3732021824,734202198.0
Flag of the Republic of China.svg  Taiwan 2020+1,371,420 [14] 2021759,1042020205.1
Flag of Thailand.svg  Thailand 2021Q1+36,2512021538,735201911.0
Flag of Tunisia.svg  Tunisia 2019-63,678202144,2652019−162.6
Flag of Turkey.svg  Turkey 2021Q2-280,6242021794,5302021−35.3
Flag of Uganda.svg  Uganda 2019-18,640202141,2712019−60.8
Flag of Ukraine.svg  Ukraine 2021Q1-21,6132021164,5932021−13.1
Flag of the United Kingdom.svg  United Kingdom 2021Q1-802,20220213,124,6502021−25.7
Flag of the United States (23px).png  United States 2022Q4-16,112,100202220,182,5002022Q4 [15] −79.8
Flag of Uzbekistan.svg  Uzbekistan 2021Q1+18,494202161,203202130.2
Flag of Zambia.svg  Zambia 2020Q3-28,177202118,9552019−116.5

See also

Related Research Articles

<span class="mw-page-title-main">Balance of trade</span> Difference between the monetary value of exports and imports

Balance of trade can be measured in terms of commercial balance, or net exports. Balance of trade is the difference between the monetary value of a nation's exports and imports over a certain time period. Sometimes a distinction is made between a balance of trade for goods versus one for services. The balance of trade measures a flow variable of exports and imports over a given period of time. The notion of the balance of trade does not mean that exports and imports are "in balance" with each other.

In economics, a recession is a business cycle contraction that occurs when there is a general decline in economic activity. Recessions generally occur when there is a widespread drop in spending. This may be triggered by various events, such as a financial crisis, an external trade shock, an adverse supply shock, the bursting of an economic bubble, or a large-scale anthropogenic or natural disaster.

In finance, default is failure to meet the legal obligations of a loan, for example when a home buyer fails to make a mortgage payment, or when a corporation or government fails to pay a bond which has reached maturity. A national or sovereign default is the failure or refusal of a government to repay its national debt.

<span class="mw-page-title-main">Current account (balance of payments)</span> Record of imports, exports, and net capital transfers of a country

In macroeconomics and international finance, a country's current account records the value of exports and imports of both goods and services and international transfers of capital. It is one of the two components of the balance of payments, the other being the capital account. Current account measures the nation's earnings and spendings abroad and it consists of the balance of trade, net primary income or factor income and net unilateral transfers, that have taken place over a given period of time. The current account balance is one of two major measures of a country's foreign trade. A current account surplus indicates that the value of a country's net foreign assets grew over the period in question, and a current account deficit indicates that it shrank. Both government and private payments are included in the calculation. It is called the current account because goods and services are generally consumed in the current period.

In economics, hot money is the flow of funds from one country to another in order to earn a short-term profit on interest rate differences and/or anticipated exchange rate shifts. These speculative capital flows are called "hot money" because they can move very quickly in and out of markets, potentially leading to market instability.

A country's gross external debt is the liabilities that are owed to nonresidents by residents. The debtors can be governments, corporations or citizens. External debt may be denominated in domestic or foreign currency. It includes amounts owed to private commercial banks, foreign governments, or international financial institutions such as the International Monetary Fund (IMF) and the World Bank.

<span class="mw-page-title-main">Government debt</span> Total amount of debt owed to lenders by a government/state

A country's gross government debt is the financial liabilities of the government sector. Changes in government debt over time reflect primarily borrowing due to past government deficits. A deficit occurs when a government's expenditures exceed revenues. Government debt may be owed to domestic residents, as well as to foreign residents. If owed to foreign residents, that quantity is included in the country's external debt.

<span class="mw-page-title-main">Paris Club</span> International organization

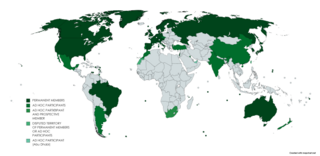
Paris Club is a group of major creditor countries aiming to provide a sustainable way to tackle debt problems in debtor countries.

Foreign exchange reserves are cash and other reserve assets such as gold and silver held by a central bank or other monetary authority that are primarily available to balance payments of the country, influence the foreign exchange rate of its currency, and to maintain confidence in financial markets. Reserves are held in one or more reserve currencies, nowadays mostly the United States dollar and to a lesser extent the euro.

<span class="mw-page-title-main">Latin American debt crisis</span> Financial crisis during the 1970s and 1980s

The Latin American debt crisis was a financial crisis that originated in the early 1980s, often known as La Década Perdida, when Latin American countries reached a point where their foreign debt exceeded their earning power, and they could not repay it.

“Global debt” refers to the total amount of money owed by all sectors, including governments, businesses, and households worldwide.

A sovereign default is the failure or refusal of the government of a sovereign state to pay back its debt in full when due. Cessation of due payments may either be accompanied by that government's formal declaration that it will not pay its debts (repudiation), or it may be unannounced. A credit rating agency will take into account in its gradings capital, interest, extraneous and procedural defaults, and failures to abide by the terms of bonds or other debt instruments.

<span class="mw-page-title-main">Foreign trade of the United States</span> Overview of the topic

Foreign trade of the United States comprises the international imports and exports of the United States. The country is among the top three global importers and exporters.

The external debt of India is the debt the country owes to foreign creditors. The debtors can be the Union government, state governments, corporations or citizens of India. The debt includes money owed to private commercial banks, foreign governments, or international financial institutions such as the International Monetary Fund (IMF) and World Bank.

Debt-trap diplomacy is a term to describe an international financial relationship where a creditor country or institution extends debt to a borrowing nation partially, or solely, to increase the lender's political leverage. The creditor country is said to extend excessive credit to a debtor country with the intention of extracting economic or political concessions when the debtor country becomes unable to meet its repayment obligations. The conditions of the loans are often not publicized. The borrowed money commonly pays for contractors and materials sourced from the creditor country.

The national debt of Pakistan, or simply Pakistani debt, is the total public debt, or unpaid borrowed funds carried by the Government of Pakistan, which includes measurement as the face value of the currently outstanding treasury bills (T-bills) that have been issued by the federal government.

References

  1. Bivens, L. Josh (December 14, 2004). "Debt and the dollar: The United States damages future living standards by borrowing itself into a deceptively deep hole". Epinet.org. Archived from the original on January 20, 2008. Retrieved 2009-06-28.
  2. Ministry of Economic and Finance of Argentina International Investment Position Methodology page.1
  3. 1 2 Aliber, Robert (31 January 2021). "Why did the United States Evolve from the Largest International Creditor in 1980 to the Largest International Debtor in 1990?". Atlantic Economic Journal. 48: 405–411. Retrieved 14 April 2023.
  4. "U.S. Becomes the World's Largest Debtor Country". Los Angeles Times . Associated Press. 24 June 1986. Retrieved 14 April 2023.
  5. "U.S. International Investment Position, Fourth Quarter and Year 2020". BEA News. Bureau of Economic Analysis. 31 March 2021. Retrieved 14 April 2023.
  6. "U.S. International Investment Position, 4th Quarter and Year 2022" (PDF). BEA News. Bureau of Economic Analysis. 29 March 2023. Retrieved 14 April 2023.
  7. "IMF Data". data.imf.org. Retrieved 30 May 2021.
  8. "Report for Selected Country Groups and Subjects". International Monetary Fund.
  9. 1 2 "Fitch Upgrades Andorra to 'A-'; Outlook Stable". 8 July 2022. Retrieved 16 June 2023.
  10. 1 2 "GDP (current US$) - Andorra". World Bank. 2021. Retrieved 16 June 2023.
  11. 1 2 3 4 5 6 7 8 9 10 11 12 13 14 15 16 17 18 19 20 21 22 23 24 25 26 27 "Net international investment position - quarterly data, % of GDP". Eurostat. 1 January 2024. Retrieved 1 January 2024.
  12. Central Bank of Iceland
  13. "India's International Investment Position (IIP), March 2020". Reserve Bank of India. Retrieved 2021-01-30.
  14. Central Bank of the Republic of China (Taiwan)
  15. "Gross Domestic Product (Third Estimate), Corporate Profits, and GDP by Industry, Fourth Quarter and Year 2022" (PDF). BEA News. Bureau of Economic Analysis. 30 March 2023. Retrieved 14 April 2023.

Statistics