Norwich South (UK Parliament constituency)

Last updated

Norwich South
Borough constituency
for the House of Commons
NorwichSouth2007Constituency.svg
Boundary of Norwich South in Norfolk
EnglandNorfolk.svg
Location of Norfolk within England
County Norfolk
Electorate 73,569 (December 2010) [1]
Major settlements Norwich
Current constituency
Created 1950
Member of Parliament Clive Lewis (Labour)
SeatsOne
Created from Norwich

Norwich South is a constituency in Norfolk represented in the House of Commons of the Parliament of the United Kingdom, [n 1] since 2015 by Clive Lewis, of the Labour Party. [n 2]

Contents

History

The constituency was created by the Representation of the People Act 1948 for the 1950 general election, when the two-seat Norwich constituency was divided into Norwich North and Norwich South. The Labour MP for this seat from 1997 to 2010 was Charles Clarke who served in the cabinet for five years from 2001 to 2006, first as Minister without Portfolio, then as Secretary of State for Education and Skills and latterly as Home Secretary.

Norwich South was Labour's safest seat in Norfolk until 2005. Although it was lost to the Conservatives in 1983, it was regained by Labour in 1987 and was the only Labour seat in Norfolk until 1997. In 2005 the Labour majority was cut by over 5000, leaving Norwich North as the safest Labour seat in the county.

At the 2010 election, the seat was considered a three-way marginal between the incumbent Labour party, the Liberal Democrats and the Conservatives. The seat was also targeted by the Green Party. The Liberal Democrats won the seat, with the lowest percentage share of the vote in a constituency in the 2010 election. The loss was considered an embarrassment for the Labour Party as it was the seat of a former Home Secretary.

In the 2015 election, Norwich South was one of the Green Party's target seats, and due to the tiny majority of just 310 votes for the Liberal Democrat Simon Wright over Labour in the previous election, it was a key Labour target. In the event, Wright came fourth with under half his 2010 vote, behind the Greens, Conservatives and Labour, whose left-wing candidate Clive Lewis won the seat with a 10.6% swing from the Liberal Democrats to Labour. The Green Party share of the vote actually fell by 1% compared to 2010, with the Conservative vote slightly increasing.

In the 2017 election, UKIP did not contest the seat but endorsed the Conservatives. [2] Clive Lewis increased Labour's vote share by 22 percentage points to win 31,311 votes (61.0%), the most votes any party has ever won in the constituency. This happened despite the Conservative share of the vote also increasing by 7.1%. The swing was entirely from the Liberal Democrats (who had held the seat from 2010 to 2015) whose vote fell to 5.5%, and the Green Party (who had made the seat a top target in 2015) who dropped to 2.9%, their worst result in Norwich South since 1997.

Although Lewis's share of the vote fell in the 2019 election, he still held the seat with a comfortable majority of 24.7%.

Boundaries and boundary changes

1950–1974

1974–1983

Further to the Second Periodic Review of Westminster Constituencies a redistribution of seats was enacted in 1970. However, in the case of the two Norwich constituencies, this was superseded before the February 1974 general election by the Parliamentary Constituencies (Norwich) Order 1973 which followed on from a revision of the County Borough of Norwich wards in 1971, resulting in a realignment of the boundary with Norwich North.

1983–1997

Extended northwards, gaining southern parts of Norwich North.

1997–2010

The two District of South Norfolk wards were transferred from the constituency of South Norfolk.

2010–2024

Norwich South (UK Parliament constituency)
Map of boundaries 2010-2024

The villages of Cringleford and Colney were returned to South Norfolk. In Norwich, the part of the Crome ward around Morse Road became part of Norwich North, while the area around Mousehold Street in Thorpe Hamlet moved to Norwich South.

Following their review of parliamentary constituencies in Norfolk that concluded in 2007 and came into effect for the 2010 general election, the Boundary Commission for England created a slightly modified Norwich South constituency. The changes were necessary to re-align the constituency boundaries with the new local government ward boundaries introduced in South Norfolk and Norwich in 2003 and 2004 respectively and to take account of Norfolk being awarded an additional, ninth constituency by the Boundary Commission.

Current

Further to the 2023 Periodic Review of Westminster constituencies, which came into effect for the 2024 general election, the contents of the constituency are unchanged, but there were minor changes to the boundaries following modifications to local authority ward boundaries. The area of Costessey around Richmond Road was transferred to Norwich South, and the area of Crome (formerly Thorpe Hamlet) ward around Mousehold Street was transferred back to Norwich North. [8]

There had been an earlier proposal in the Boundary Commission draft recommendations to transfer the whole of the Old Costessey ward over to the Norwich South constituency and move Thorpe Hamlet into Norwich North, but that was scrapped, according to the Local Democracy Reporting Service. [9] (A proposal in the 2018 previous boundary review to move Cringleford and Old Costessey into Norwich South and Wensum ward into Norwich North was also scrapped).

Members of Parliament

ElectionMember [10] Party
1950 Henry Strauss Conservative
1955 Geoffrey Rippon Conservative
1964 Christopher Norwood Labour
1970 Thomas Stuttaford Conservative
February 1974 John Garrett Labour
1983 John Powley Conservative
1987 John Garrett Labour
1997 Charles Clarke Labour
2010 Simon Wright Liberal Democrats
2015 Clive Lewis Labour

Elections

Norwich South election results Norwich South election results.png
Norwich South election results

Elections in the 2020s

General election 2024: Norwich South
PartyCandidateVotes%±%
Reform UK Graham Burton [11]
Labour Clive Lewis [12]
Green Jamie Osborn [13]
Liberal Democrats Sean Bennett [14]
Conservative David Simister-Thomas [15]
Majority
Turnout

Elections in the 2010s

General election 2019: Norwich South [16]
PartyCandidateVotes%±%
Labour Clive Lewis 27,766 53.7 ―7.3
Conservative Michael Spencer15,00629.0―1.6
Liberal Democrats James Wright4,7769.2+3.7
Green Catherine Rowett 2,4694.8+1.9
Brexit Party Sandy Gilchrist1,6563.2New
Majority12,76024.7―5.7
Turnout 51,67366.4―2.8
Labour hold Swing
General election 2017: Norwich South
PartyCandidateVotes%±%
Labour Clive Lewis 31,311 61.0 +21.7
Conservative Lana Hempsall15,71530.6+7.1
Liberal Democrats James Wright2,8415.5−8.1
Green Richard Bearman1,4922.9−11.0
Majority15,59630.4+14.6
Turnout 51,35969.2+4.5
Labour hold Swing +7.3
General election 2015: Norwich South [17]
PartyCandidateVotes%±%
Labour Clive Lewis 19,033 39.3 +10.6
Conservative Lisa Townsend 11,37923.5+0.6
Green Lesley Grahame6,74913.9−1.0
Liberal Democrats Simon Wright 6,60713.6−15.8
UKIP Steve Emmens4,5399.4+7.0
Class War David Peel960.2New
Independent Cengiz Ceker600.1New
Majority7,65415.8N/A
Turnout 48,46364.7+0.1
Labour gain from Liberal Democrats Swing +5.0
General election 2010: Norwich South [18]
PartyCandidateVotes%±%
Liberal Democrats Simon Wright 13,960 29.4 -0.6
Labour Charles Clarke 13,65028.7-8.7
Conservative Antony Little10,90222.9+1.1
Green Adrian Ramsay 7,09514.9+7.5
UKIP Stephen Emmens1,1452.4+0.9
BNP Len Heather6971.5N/A
Workers Revolutionary Gabriel Polley1020.20.0
Majority3100.7N/A
Turnout 47,55164.6N/A
Liberal Democrats win (new seat)

*NB boundary changes occurred between 2005 and 2010.

Elections in the 2000s

General election 2005: Norwich South [19]
PartyCandidateVotes%±%
Labour Charles Clarke 15,904 37.7 −7.8
Liberal Democrats Andrew Aalders-Dunthorne12,25129.0+6.4
Conservative Antony Little9,56722.7−2.1
Green Adrian Ramsay 3,1017.4+4.0
UKIP Vandra Ahlstrom5971.4+0.3
English Democrat Christine Constable4661.1New
Legalise Cannabis Don Barnard2190.5−1.0
Workers Revolutionary Roger Blackwell850.2New
Majority3,6538.7-12.0
Turnout 42,19065.0+5.2
Labour hold Swing −7.1
General election 2001: Norwich South [20]
PartyCandidateVotes%±%
Labour Charles Clarke 19,367 45.5 −6.2
Conservative Andrew French10,55124.8+1.1
Liberal Democrats Andrew Aalders-Dunthorne9,64022.6+4.0
Green Adrian Holmes1,4343.4+2.0
Legalise Cannabis Alun Buffrey6201.50.0
Socialist Alliance Edward Manningham5071.2New
UKIP Tarquin Mills4731.1New
Majority8,81620.7-7.3
Turnout 42,59259.8−12.8
Labour hold Swing -3.6

Elections in the 1990s

General election 1997: Norwich South [21] [22]
PartyCandidateVotes%±%
Labour Charles Clarke 26,267 51.7 +3.0
Conservative Bashir Khanbhai 12,02823.7−12.9
Liberal Democrats Andrew Aalders-Dunthorne9,45718.6+5.7
Referendum David Holdsworth1,4642.9New
Legalise Cannabis Howard Marks 7651.5New
Green Adrian Holmes7361.4−0.2
Natural Law Bryan Parsons840.20.0
Majority14,23928.0+15.9
Turnout 50,80172.6−8.0
Labour hold Swing +8.0
General election 1992: Norwich South [23] [24]
PartyCandidateVotes%±%
Labour John Garrett 24,965 48.7 +10.8
Conservative David Baxter18,78436.6−0.7
Liberal Democrats Christopher Thomas6,60912.9−12.0
Green Adrian Holmes8031.6New
Natural Law Bryan Parsons1040.2New
Majority6,18112.1+11.5
Turnout 51,26580.60.0
Labour hold Swing +5.7

Elections in the 1980s

General election 1987: Norwich South [25]
PartyCandidateVotes%±%
Labour John Garrett 19,666 37.9 +2.6
Conservative John Powley 19,33037.3−1.5
SDP Charles Hardie12,89624.9+0.4
Majority3360.6N/A
Turnout 51,89280.6+4.2
Labour gain from Conservative Swing +2.1
General election 1983: Norwich South [26]
PartyCandidateVotes%±%
Conservative John Powley 18,998 38.8 −2.8
Labour John Garrett 17,28635.3−9.6
SDP Charles Hardie11,96824.5New
Ecology Anthony D. Carter4681.0New
National Front Peter C. Williams1450.3−0.4
Independent Jon C. Ward910.2N/A
Majority1,7123.5N/A
Turnout 48,95676.4−3.8
Conservative gain from Labour Swing +3.4

Elections in the 1970s

General election 1979: Norwich South
PartyCandidateVotes%±%
Labour John Garrett 16,240 44.9 −2.2
Conservative I. Coutts15,04241.6+4.1
Liberal P. Mackintosh4,61812.8−2.6
National Front Andrew Fountaine 2640.7New
Majority1,1983.3-6.3
Turnout 36,16480.2+1.7
Labour hold Swing −3.2
General election October 1974: Norwich South
PartyCandidateVotes%±%
Labour John Garrett 16,590 47.1 +5.8
Conservative M. Tomison13,18537.5−2.0
Liberal P.G. Smith5,42915.4−3.9
Majority3,4059.6+7.8
Turnout 35,20478.5−5.5
Labour hold Swing +3.9
General election February 1974: Norwich South
PartyCandidateVotes%±%
Labour John Garrett 15,393 41.3 −3.4
Conservative Thomas Stuttaford 14,74139.5−7.5
Liberal L. Parker7,18319.3+11.0
Majority6521.8N/A
Turnout 37,31784.0+5.8
Labour gain from Conservative Swing +2.1
General election 1970: Norwich South [27]
PartyCandidateVotes%±%
Conservative Thomas Stuttaford 17,067 47.0 +1.8
Labour Conrad Ascher16,24144.7−10.1
Liberal Lesley Parker3,0318.3New
Majority8262.3N/A
Turnout 36,33978.2−5.0
Conservative gain from Labour Swing +6.0

Elections in the 1960s

General election 1966: Norwich South [28]
PartyCandidateVotes%±%
Labour Christopher Norwood 19,163 54.8 +3.9
Conservative Anthony Gurney15,80845.2−3.9
Majority3,3559.6+7.8
Turnout 34,97183.2+0.5
Labour hold Swing +3.9
General election 1964: Norwich South
PartyCandidateVotes%±%
Labour Christopher Norwood 17,973 50.9 +4.0
Conservative Geoffrey Rippon 17,36249.1−4.0
Majority6111.8N/A
Turnout 35,33582.7+0.5
Labour gain from Conservative Swing +4.0

Elections in the 1950s

General election 1959: Norwich South
PartyCandidateVotes%±%
Conservative Geoffrey Rippon 19,128 53.1 +0.6
Labour George Wallace 16,88446.9−0.6
Majority2,2446.2+1.2
Turnout 36,01282.2+3.9
Conservative hold Swing +0.6
General election 1955: Norwich South [29]
PartyCandidateVotes%±%
Conservative Geoffrey Rippon 18,659 52.5 0.0
Labour Mabel Tylecote 16,90147.50.0
Majority1,7585.00.0
Turnout 35,56078.3−6.0
Conservative hold Swing 0.0
General election 1951: Norwich South [30]
PartyCandidateVotes%±%
Conservative Henry Strauss 19,082 52.5 −0.8
Labour Mabel Tylecote 17,23447.5+0.8
Majority1,8485.0-1.6
Turnout 36,31684.3−0.7
Conservative hold Swing −0.8
General election 1950: Norwich South [31]
PartyCandidateVotes%±%
Conservative Henry Strauss 18,693 53.3
Labour Mabel Tylecote 16,36846.7
Majority2,3256.6
Turnout 35,06185.0
Conservative win (new seat)

See also

Notes

  1. A borough constituency (for the purposes of election expenses and type of returning officer)
  2. As with all constituencies, the constituency elects one Member of Parliament (MP) by the first past the post system of election at least every five years.

Related Research Articles

<span class="mw-page-title-main">North Norfolk (UK Parliament constituency)</span> Parliamentary constituency in the United Kingdom, 1868 onwards

North Norfolk is a constituency represented in the House of Commons of the UK Parliament since 2019 by Duncan Baker, a Conservative.

<span class="mw-page-title-main">Bethnal Green and Bow (UK Parliament constituency)</span> UK Parliament constituency in England since 1997

Bethnal Green and Bow is a constituency in Greater London, represented in the House of Commons of the UK Parliament since 2010 by Rushanara Ali of the Labour Party.

<span class="mw-page-title-main">Southampton Itchen (UK Parliament constituency)</span>

Southampton, Itchen is a constituency represented in the House of Commons of the UK Parliament since 2015 by Royston Smith, a Conservative member of parliament. Discounting the Speaker returned in the early 1970s in two elections, local voters have elected the MP from only two parties alternately for various periods, with one party reaffiliation (defection) between elections when the Labour Party split in the 1980s.

<span class="mw-page-title-main">Norwich North (UK Parliament constituency)</span> Parliamentary constituency in the United Kingdom, 1950 onwards

Norwich North is a constituency represented in the House of Commons of the UK Parliament since 2009 by Conservative Chloe Smith.

<span class="mw-page-title-main">South West Norfolk (UK Parliament constituency)</span> Parliamentary constituency in the United Kingdom, 1885 onwards

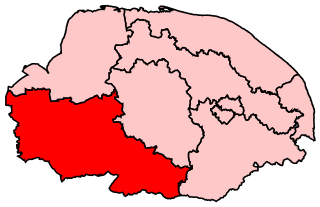
South West Norfolk is a constituency represented in the House of Commons of the UK Parliament since 2010 by Liz Truss of the Conservative Party, who served as Prime Minister of the United Kingdom from September to October 2022.

<span class="mw-page-title-main">Rushcliffe (UK Parliament constituency)</span> Nottinghamshire constituency from 1885

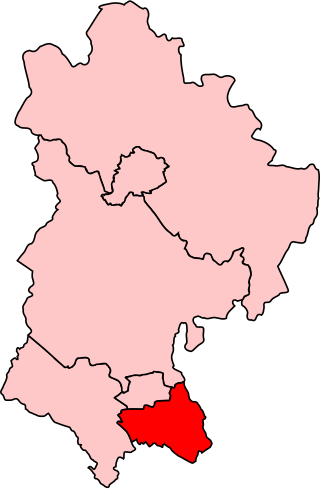
Rushcliffe is a constituency in Nottinghamshire represented in the House of Commons of the UK Parliament from 2019 by Ruth Edwards, a Conservative.

<span class="mw-page-title-main">Cardiff South and Penarth (UK Parliament constituency)</span> Parliamentary constituency in the United Kingdom, 1983 onwards

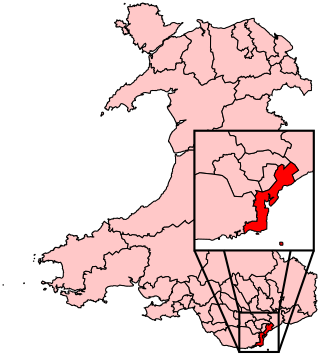
Cardiff South and Penarth is a constituency created in 1983 represented in the House of Commons of the UK Parliament since 2012 by Stephen Doughty, a Labour Co-op MP. It is the largest such entity in Wales, with an electorate of 75,175 and one of the most ethnically diverse.

<span class="mw-page-title-main">North West Norfolk (UK Parliament constituency)</span> Parliamentary constituency in the United Kingdom 1885-1918 & since 1974

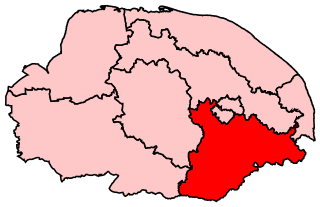
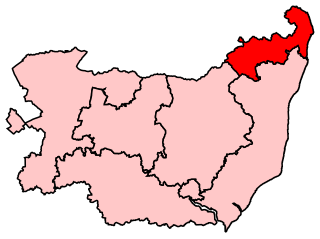
North West Norfolk is a constituency represented in the House of Commons of the UK Parliament since 2019 by James Wild, a Conservative.

<span class="mw-page-title-main">Erewash (UK Parliament constituency)</span> UK Parliament constituency since 1983

Erewash is a constituency in Derbyshire represented in the House of Commons of the UK Parliament since 2015 by Maggie Throup, a Conservative.

<span class="mw-page-title-main">Luton South (UK Parliament constituency)</span> Parliamentary constituency in the United Kingdom, 1983 onwards

Luton South is a constituency in Bedfordshire represented in the House of Commons of the UK Parliament since 2019 by Rachel Hopkins, a member of the Labour Party.

<span class="mw-page-title-main">South Norfolk (UK Parliament constituency)</span> Parliamentary constituency in the United Kingdom, 1868 onwards

South Norfolk is a constituency represented in the House of Commons of the UK Parliament since 2001 by Richard Bacon, a Conservative.

<span class="mw-page-title-main">Rochford and Southend East (UK Parliament constituency)</span> Parliamentary constituency in the United Kingdom, 1997 onwards

Rochford and Southend East is a constituency represented in the House of Commons of the UK Parliament since 2005 by Sir James Duddridge, a Conservative.

<span class="mw-page-title-main">Waveney (UK Parliament constituency)</span> Parliamentary constituency in the United Kingdom, 1983 onwards

Waveney is a constituency represented in the House of Commons of the UK Parliament from 2010 to 2024 by Peter Aldous, a Conservative. It returned one Member of Parliament (MP) to the House of Commons of the Parliament of the United Kingdom.

<span class="mw-page-title-main">Sutton and Cheam (UK Parliament constituency)</span> Parliamentary constituency in the United Kingdom, 1945 onwards

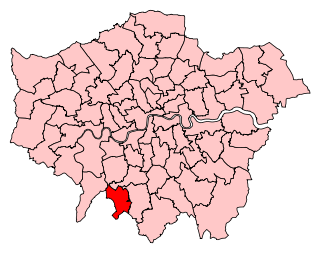
Sutton and Cheam is a constituency in Greater London represented in the House of Commons of the UK Parliament since 2015 by Paul Scully, a Conservative.

<span class="mw-page-title-main">Bristol North West (UK Parliament constituency)</span> Constituency represented in the House of Commons

Bristol North West is a constituency represented in the House of Commons of the UK Parliament since 2017 by Darren Jones of the Labour Party.

<span class="mw-page-title-main">2009 Norfolk County Council election</span> 2009 UK local government election

The Norfolk County Council election took place on 4 June 2009, coinciding with local elections for all county councils in England.

<span class="mw-page-title-main">2011 Norwich City Council election</span> 2011 city council election for Norwich, England

The 2011 Norwich City Council election took place on 5 May 2011 to elect members of Norwich City Council in England. One third of seats were up for election. This was on the same day as other local elections and the nationwide referendum on the Alternative Vote.

<span class="mw-page-title-main">2014 Norwich City Council election</span> 2014 city council election for Norwich, England

Council elections for the Norwich City Council were held on 22 May 2014 as part of the 2014 United Kingdom local elections. The elections were moved from earlier on in May to coincide with the East of England 2014 European Parliament election.

References

  1. "Electorate Figures – Boundary Commission for England". 2011 Electorate Figures. Boundary Commission for England. 4 March 2011. Archived from the original on 6 November 2010. Retrieved 13 March 2011.
  2. Grimmer, Dan. "UKIP announce they will not have Norwich general election candidates and urge supporters to 'lend' votes to Conservatives". Eastern Daily Press. Archant Community Media. Retrieved 28 May 2020.
  3. "Representation of the People Act, 1948". Legislation.gov.uk. Retrieved 15 March 2019.
  4. "The Parliamentary Constituencies (Norwich) Order 1973". Legislation.gov.uk. Retrieved 15 March 2019.
  5. "The Parliamentary Constituencies (England) Order 1983". Legislation.gov.uk. Retrieved 15 March 2019.
  6. "The Parliamentary Constituencies (England) Order 1995". Legislation.gov.uk. Retrieved 15 March 2019.
  7. "The Parliamentary Constituencies (England) Order 2007". Legislation.gov.uk. Retrieved 15 March 2019.
  8. "The Parliamentary Constituencies Order 2023". Schedule I Part 2 Eastern region.
  9. "Parliamentary constituencies affect Norfolk/Suffolk border".
  10. Leigh Rayment's Historical List of MPs – Constituencies beginning with "N" (part 3)
  11. "Norwich South Constituency". Reform UK . Retrieved 23 May 2024.
  12. "Clive Lewis MP confirms he will fight next general election". Norwich Evening News. Retrieved 2 December 2023.
  13. "Councillor set to stand for parliament at next election". Eastern Daily Press. Retrieved 2 December 2023.
  14. "Sean Bennett is the Lib Dem Candidate for Norwich South". Eastern Daily Press. Retrieved 2 December 2023.
  15. "Tories select David Simister-Thomas for Norwich South seat". Eastern Daily Press. Retrieved 2 December 2023.
  16. "Norwich South Parliamentary constituency". BBC News. Retrieved 19 November 2019.
  17. "Election Data 2015". Electoral Calculus. Archived from the original on 17 October 2015. Retrieved 17 October 2015.
  18. "Election Data 2010". Electoral Calculus. Archived from the original on 26 July 2013. Retrieved 17 October 2015.
  19. "Election Data 2005". Electoral Calculus. Archived from the original on 15 October 2011. Retrieved 18 October 2015.
  20. "Election Data 2001". Electoral Calculus. Archived from the original on 15 October 2011. Retrieved 18 October 2015.
  21. "Election Data 1997". Electoral Calculus. Archived from the original on 15 October 2011. Retrieved 18 October 2015.
  22. "Norwich South". The Guardian. Archived from the original on 19 February 2014.
  23. "Election Data 1992". Electoral Calculus. Archived from the original on 15 October 2011. Retrieved 18 October 2015.
  24. "UK General Election results April 1992". Richard Kimber's Political Science Resources. Politics Resources. 9 April 1992. Archived from the original on 8 May 2015. Retrieved 6 December 2010.
  25. "Election Data 1987". Electoral Calculus. Archived from the original on 15 October 2011. Retrieved 18 October 2015.
  26. "Election Data 1983". Electoral Calculus. Archived from the original on 15 October 2011. Retrieved 18 October 2015.
  27. The Times' Guide to the House of Commons. 1970.
  28. The Times' Guide to the House of Commons. 1966.
  29. The Times' Guide to the House of Commons. 1955.
  30. The Times' Guide to the House of Commons. 1951.
  31. The Times' Guide to the House of Commons. 1950.

52°37′N1°16′E / 52.62°N 1.27°E / 52.62; 1.27