This article needs additional citations for verification .(July 2013) |
Opinion polling for UK general elections |
---|
1987 election |
Opinion polls |
1992 election |
Opinion polls |
1997 election |
Opinion polls |
2001 election |
Opinion polls |
2005 election |
Opinion polls |
Prior to the 1997 general election, various organisations carried out opinion polling to gauge voting intentions. Results of such polls are displayed in this list.
The date range for these opinion polls is from the previous general election to the election on 1 May 1997.
Most opinion polls do not cover Northern Ireland, since its 18 seats were not contested by the political parties standing for election in the rest of the United Kingdom.
By the end of 1992 Labour had established a lead over the Conservatives which lasted until the 1997 election.
Survey end date | Pollster/Client | Con | Lab | Lib Dem | Lead |
---|---|---|---|---|---|
1 May | 1997 general election | 30.7% | 43.2% | 16.8% | 12.5% |
30 Apr | ICM/Guardian | 33% | 43% | 18% | 10% |
30 Apr | Gallup/Telegraph | 33% | 46% | 16% | 13% |
30 Apr | MORI/Evening Standard | 29% | 47% | 19% | 18% |
29 Apr | Gallup/Telegraph | 31% | 51% | 13% | 20% |
29 Apr | Harris/Independent | 31% | 48% | 15% | 17% |
29 Apr | MORI/Times | 27% | 51% | 15% | 24% |
29 Apr | NOP/Reuters | 28% | 50% | 14% | 22% |
28 Apr | Gallup/Channel 4 | 31% | 49% | 14% | 18% |
28 Apr | Gallup/Telegraph | 29% | 51% | 13% | 22% |
27 Apr | Gallup/Telegraph | 30% | 49% | 14% | 19% |
26 Apr | Gallup/Sunday Telegraph | 31% | 48% | 13% | 17% |
25 Apr | Gallup/Telegraph | 32% | 48% | 14% | 16% |
25 Apr | ICM/Observer | 32% | 47% | 16% | 15% |
25 Apr | NOP/Sunday Times | 29% | 47% | 16% | 18% |
24 Apr | Gallup/Telegraph | 32% | 48% | 12% | 16% |
24 Apr | MORI/Independent on Sunday | 29% | 53% | 12% | 24% |
23 Apr | Gallup/Telegraph | 30% | 50% | 12% | 20% |
22 Apr | Gallup/Channel 4 | 31% | 50% | 13% | 19% |
22 Apr | Gallup/Telegraph | 30% | 51% | 12% | 21% |
22 Apr | MORI/Times | 27% | 48% | 17% | 21% |
21 Apr | Gallup/Telegraph | 32% | 48% | 12% | 16% |
21 Apr | ICM/Guardian | 37% | 42% | 14% | 5% |
20 Apr | Gallup/Telegraph | 32% | 48% | 13% | 16% |
20 Apr | Harris/Independent | 30% | 48% | 15% | 18% |
19 Apr | Gallup/Sunday Telegraph | 31% | 50% | 13% | 19% |
18 Apr | Gallup/Telegraph | 32% | 50% | 13% | 18% |
18 Apr | ICM/Observer | 31% | 48% | 15% | 17% |
18 Apr | NOP/Sunday Times | 29% | 47% | 17% | 18% |
17 Apr | Gallup/Telegraph | 31% | 50% | 12% | 19% |
16 Apr | Gallup/Telegraph | 31% | 50% | 11% | 19% |
15 Apr | Gallup/Telegraph | 30% | 51% | 12% | 21% |
15 Apr | MORI/Times | 32% | 49% | 13% | 17% |
14 Apr | Gallup/Telegraph | 32% | 49% | 14% | 17% |
14 Apr | Harris/Independent | 31% | 49% | 13% | 18% |
14 Apr | ICM/Guardian | 31% | 45% | 19% | 14% |
14 Apr | MORI/Evening Standard | 29% | 50% | 15% | 21% |
13 Apr | Gallup/Telegraph | 30% | 50% | 14% | 20% |
12 Apr | Gallup/Sunday Telegraph | 31% | 50% | 13% | 19% |
12 Apr | Gallup/Telegraph | 32% | 49% | 14% | 17% |
11 Apr | Gallup/Telegraph | 32% | 52% | 11% | 20% |
11 Apr | ICM/Observer | 32% | 48% | 15% | 16% |
11 Apr | NOP/Sunday Times | 28% | 49% | 16% | 21% |
10 Apr | Gallup/Telegraph | 30% | 52% | 11% | 22% |
9 Apr | Gallup/Telegraph | 29% | 53% | 12% | 24% |
8 Apr | Gallup/Telegraph | 32% | 51% | 11% | 19% |
8 Apr | MORI/Times | 34% | 49% | 12% | 15% |
7 Apr | Gallup/Telegraph | 33% | 53% | 10% | 20% |
7 Apr | Harris/Independent | 28% | 54% | 12% | 26% |
7 Apr | ICM/Guardian | 34% | 46% | 15% | 12% |
6 Apr | Gallup/Telegraph | 30% | 55% | 10% | 25% |
4 Apr | ICM/Observer | 30% | 50% | 14% | 20% |
4 Apr | MORI/Independent on Sunday | 30% | 55% | 9% | 25% |
4 Apr | NOP/Reuters | 29% | 52% | 11% | 23% |
4 Apr | NOP/Sunday Times | 26% | 53% | 12% | 27% |
3 Apr | Gallup/Channel 4 | 30% | 54% | 11% | 24% |
3 Apr | Harris/Central News | 29% | 55% | 11% | 26% |
1 Apr | MORI/Times | 28% | 55% | 11% | 27% |
31 Mar | Harris/Independent | 28% | 52% | 14% | 24% |
31 Mar | ICM/Guardian | 32% | 46% | 17% | 14% |
28 Mar | Gallup/Telegraph | 31% | 52% | 11% | 21% |
24 Mar | Harris/Independent | 28% | 56% | 10% | 28% |
24 Mar | MORI/Times | 29% | 50% | 14% | 21% |
21 Mar | Gallup/Sunday Telegraph | 27% | 56% | 11% | 29% |
17 Mar | Gallup/Telegraph | 28.5% | 56.5% | 9.5% | 28% |
17 Mar | Harris/Independent | 27% | 58% | 10% | 31% |
14 Mar | NOP/Reuters | 29% | 54% | 11% | 25% |
13 Mar | NOP/Sunday Times | 26% | 54% | 13% | 28% |
10 Mar | Harris/Independent | 26% | 53% | 14% | 27% |
9 Mar | ORB/Ladbrokes | 26% | 56% | 12% | 30% |
4 Mar | Gallup/Telegraph | 28% | 54% | 12.5% | 26% |
3 Mar | Harris/Independent | 30% | 55% | 10% | 25% |
2 Mar | ICM/Guardian | 30% | 48% | 16% | 18% |
24 Feb | MORI/Times | 31% | 52% | 11% | 21% |
21 Feb | NOP/Reuters | 29% | 51% | 14% | 22% |
13 Feb | NOP/Sunday Times | 30% | 49% | 13% | 19% |
4 Feb | Gallup/Telegraph | 34% | 49% | 12% | 15% |
2 Feb | ICM/Guardian | 32% | 48% | 15% | 16% |
28 Jan | MORI/Times | 30% | 55% | 11% | 25% |
16 Jan | NOP/Sunday Times | 31% | 54% | 12% | 23% |
15 Jan | Gallup/Telegraph | 32.5% | 50.5% | 10.5% | 18% |
5 Jan | ICM/Guardian | 31% | 48% | 16% | 17% |
5 Jan | ORB/Ladbrokes | 30% | 53% | 12% | 23% |
Survey end date | Pollster/Client | Con | Lab | Lib Dem | Lead |
---|---|---|---|---|---|
14 Dec | ICM/Observer | 30% | 50% | 14% | 20% |
9 Dec | MORI/Times | 30% | 51% | 13% | 21% |
2 Dec | Gallup/Telegraph | 22% | 59% | 12% | 37% |
1 Dec | ICM/Guardian | 31% | 50% | 15% | 19% |
29 Nov | MORI/Euro | 30% | 52% | 13% | 22% |
14 Nov | NOP/Sunday Times | 26% | 56% | 13% | 30% |
11 Nov | MORI/Times | 33% | 50% | 12% | 17% |
5 Nov | Gallup/Telegraph | 28% | 55% | 11% | 17% |
2 Nov | ICM/Guardian | 34% | 47% | 15% | 13% |
1 Nov | MORI/Mail on Sunday | 30% | 54% | 12% | 24% |
28 Oct | MORI/Times | 28% | 56% | 12% | 18% |
21 Oct | MORI | 27% | 54% | 12% | 17% |
17 Oct | NOP/Sunday Times | 33% | 47% | 14% | 24% |
14 Oct | MORI | 30% | 53% | 12% | 23% |
7 Oct | MORI | 29% | 54% | 13% | 25% |
5 Oct | ICM/Guardian | 31% | 49% | 16% | 18% |
4 Oct | Gallup/Telegraph | 24% | 57% | 15% | 33% |
3 Oct | NOP/Sunday Times | 25% | 57% | 13% | 32% |
1 Oct | Gallup/Telegraph | 27.5% | 52% | 15% | 24.5% |
24 Sep | Gallup/Telegraph | 27% | 54% | 13.5% | 27% |
23 Sep | MORI/Times | 29% | 52% | 14% | 23% |
19 Sep | NOP/Sunday Times | 31% | 50% | 14% | 19% |
9 Sep | MORI | 28% | 56% | 12% | 28% |
7 Sep | ICM/Guardian | 32% | 47% | 16% | 15% |
3 Sep | Gallup/Telegraph | 25.5% | 58.5% | 11% | 33% |
25 Aug | MORI/Times | 30% | 51% | 13% | 27% |
15 Aug | NOP/Sunday Times | 28% | 54% | 14% | 26% |
12 Aug | MORI | 30% | 52% | 13% | 22% |
5 Aug | Gallup/Telegraph | 25% | 59% | 11% | 34% |
3 Aug | ICM/Guardian | 33% | 45% | 19% | 12% |
28 Jul | MORI/Times | 29% | 53% | 12% | 24% |
25 Jul | NOP/Sunday Times | 29% | 51% | 16% | 22% |
6 Jul | ICM/Guardian | 30% | 45% | 21% | 15% |
1 Jul | Gallup/Telegraph | 26% | 54.5% | 14.5% | 28.5% |
1 Jul | MORI | 32% | 52% | 12% | 20% |
24 Jun | MORI/Times | 31% | 52% | 12% | 21% |
20 Jun | NOP/Sunday Times | 27% | 55% | 15% | 28% |
10 Jun | MORI | 27% | 56% | 13% | 29% |
6 Jun | ICM/Guardian | 30% | 46% | 19% | 16% |
3 Jun | Gallup/Telegraph | 22.5% | 57% | 16% | 34.5% |
2 Jun | ICM/Guardian | 30% | 46% | 19% | 16% |
30 May | 1996 Northern Ireland Forum election [1] | ||||
26 May | MORI/Times | 27% | 54% | 15% | 27% |
16 May | NOP/Sunday Times | 27% | 52% | 17% | 25% |
13 May | MORI | 27% | 56% | 13% | 29% |
6 May | Gallup/Telegraph | 24.5% | 55.5% | 15.5% | 31% |
5 May | ICM/Guardian | 28% | 45% | 21% | 17% |
3 May | ICM/Sunday Express | 26% | 52% | 15% | 26% |
2 May | 1996 local elections [2] | ||||
27 Apr | MORI/Sun | 29% | 54% | 13% | 25% |
25 Apr | NOP/Sunday Times | 28% | 52% | 16% | 24% |
22 Apr | MORI/Times | 28% | 54% | 14% | 26% |
13 Apr | ICM/Guardian | 29% | 50% | 17% | 21% |
1 Apr | Gallup/Telegraph | 26% | 55.5% | 15.5% | 29.5% |
25 Mar | MORI/Times | 28% | 57% | 13% | 29% |
14 Mar | NOP/Sunday Times | 27% | 55% | 14% | 28% |
11 Mar | MORI | 29% | 55% | 13% | 26% |
4 Mar | Gallup/Telegraph | 23% | 57.5% | 16% | 34.5% |
4 Mar | ICM/Guardian | 31% | 45% | 20% | 14% |
26 Feb | MORI/Times | 26% | 57% | 14% | 31% |
16 Feb | NOP/Sunday Times | 25% | 54% | 16% | 29% |
12 Feb | MORI | 26% | 57% | 14% | 31% |
5 Feb | Gallup/Telegraph | 28% | 54.5% | 14.5% | 26.5% |
4 Feb | ICM/Guardian | 31% | 47% | 19% | 16% |
29 Jan | MORI | 28% | 54% | 15% | 26% |
22 Jan | MORI/Times | 29% | 55% | 13% | 26% |
19 Jan | NOP/Sunday Times | 25% | 54% | 18% | 25% |
17 Jan | NOP | 33% | 47% | 14% | 14% |
8 Jan | Gallup/Telegraph | 21% | 60.5% | 14.5% | 39.5% |
6 Jan | ICM/Guardian | 26% | 48% | 22% | 22% |
3 Jan | NOP/Sunday Times | 29% | 52% | 13% | 23% |
Survey end date | Pollster/Client | Con | Lab | Lib Dem | Lead |
---|---|---|---|---|---|
15 Dec | NOP/Sunday Times | 25% | 55% | 16% | 30% |
14 Dec | ICM/Observer | 30% | 50% | 14% | 20% |
9 Dec | ICM/Guardian | 26% | 48% | 22% | 22% |
4 Dec | Gallup/Telegraph | 23% | 62% | 12% | 39% |
4 Dec | MORI/Times | 28% | 55% | 13% | 27% |
1 Dec | NOP/Sunday Times | 25% | 57% | 15% | 32% |
20 Nov | MORI/Times | 26% | 56% | 14% | 30% |
17 Nov | NOP/Sunday Times | 27% | 56% | 13% | 29% |
5 Nov | ICM/Guardian | 31% | 48% | 16% | 17% |
30 Oct | Gallup/Telegraph | 21.5% | 61% | 14.5% | 39.5% |
23 Oct | MORI/Times | 27% | 56% | 13% | 29% |
20 Oct | NOP/Sunday Times | 23% | 59% | 15% | 36% |
7 Oct | ICM/Guardian | 30% | 47% | 19% | 17% |
2 Oct | Gallup/Telegraph | 25.5% | 55.5% | 14% | 30% |
25 Sep | MORI/Times | 28% | 51% | 16% | 23% |
15 Sep | NOP/Sunday Times | 27% | 53% | 17% | 26% |
9 Sep | ICM/Guardian | 31% | 48% | 17% | 17% |
4 Sep | Gallup/Telegraph | 26.5% | 54.5% | 14% | 28% |
28 Aug | MORI/Times | 25% | 56% | 15% | 31% |
18 Aug | NOP/Sunday Times | 24% | 57% | 15% | 33% |
5 Aug | ICM/Guardian | 31% | 48% | 17% | 17% |
31 Jul | Gallup/Telegraph | 22.5% | 57.5% | 14.5% | 35% |
31 Jul | ICM/Express | 24% | 58% | 14% | 34% |
24 Jul | MORI/Times | 26% | 59% | 12% | 33% |
21 Jul | MORI/LWT | 30% | 52% | 13% | 22% |
21 Jul | NOP/Sunday Times | 26% | 55% | 14% | 29% |
8 Jul | ICM/Guardian | 32% | 47% | 17% | 15% |
4 Jul | John Major is re-elected leader of the Conservative Party [3] | ||||
3 Jul | Gallup/Telegraph | 25.5% | 57% | 13% | 31.5% |
3 Jul | MORI/European | 33% | 52% | 10% | 19% |
27 Jun | MORI/Economist | 31% | 55% | 11% | 24% |
26 Jun | MORI/Times | 29% | 56% | 13% | 27% |
24 Jun | MORI/Mail on Sunday | 32% | 54% | 11% | 22% |
10 Jun | ICM/Guardian | 24% | 53% | 19% | 29% |
5 Jun | Gallup/Telegraph | 20% | 59.5% | 14.5% | 39.5% |
22 May | MORI/Times | 22% | 58% | 16% | 36% |
13 May | ICM/Guardian | 29% | 48% | 19% | 19% |
8 May | Gallup/Telegraph | 23% | 55.5% | 16.5% | 32.5% |
4 May | 1995 local elections [4] | ||||
24 Apr | MORI/Times | 26% | 56% | 15% | 30% |
8 Apr | ICM/Guardian | 26% | 51% | 18% | 25% |
6 Apr | 1995 Scottish local elections [5] | ||||
3 Apr | Gallup/Telegraph | 23% | 57.5% | 15% | 34.5% |
24 Mar | MORI/Sunday Times | 25% | 59% | 12% | 34% |
20 Mar | MORI/Times | 25% | 57% | 13% | 32% |
11 Mar | ICM/Guardian | 27% | 52% | 17% | 25% |
27 Feb | Gallup/Telegraph | 20.5% | 60.5% | 15% | 40% |
20 Feb | MORI/Times | 24% | 58% | 14% | 34% |
11 Feb | ICM/Guardian | 31% | 49% | 17% | 18% |
30 Jan | Gallup/Telegraph | 23.5% | 59.5% | 13% | 36% |
23 Jan | MORI/Times | 27% | 56% | 14% | 29% |
14 Jan | ICM/Guardian | 30% | 48% | 18% | 18% |
13 Jan | Harris/Sunday Times | 25% | 60% | 12% | 35% |
9 Jan | Gallup/Telegraph | 18.5% | 62% | 14% | 43.5% |
Survey end date | Pollster/Client | Con | Lab | Lib Dem | Lead |
---|---|---|---|---|---|
19 Dec | MORI/Times | 22% | 61% | 13% | 39% |
9 Dec | ICM/Observer | 26% | 53% | 17% | 27% |
5 Dec | Gallup/Telegraph | 21.5% | 61% | 13.5% | 39.5% |
3 Dec | ICM/Guardian | 31% | 49% | 17% | 18% |
21 Nov | MORI/Times | 24% | 55% | 17% | 31% |
5 Nov | ICM/Guardian | 31% | 49% | 16% | 18% |
31 Oct | Gallup/Telegraph | 21.5% | 56.5% | 17% | 35% |
24 Oct | MORI/Times | 25% | 57% | 14% | 32% |
8 Oct | ICM/Guardian | 32% | 49% | 15% | 17% |
3 Oct | Gallup/Telegraph | 25.5% | 54% | 16.5% | 28.5% |
27 Sep | Gallup/Telegraph | 21% | 57.5% | 15.5% | 36.5% |
26 Sep | MORI/Economist | 25% | 52% | 18% | 27% |
26 Sep | MORI/Times | 25% | 54% | 17% | 29% |
16 Sep | NOP/Independent | 28% | 50% | 17% | 22% |
10 Sep | ICM/Guardian | 33% | 45% | 18% | 12% |
5 Sep | Gallup/Telegraph | 22% | 56.5% | 17% | 34.5% |
26 Aug | NOP/Independent on Sunday | 26% | 54% | 16% | 28% |
22 Aug | MORI/Times | 23% | 56% | 18% | 33% |
6 Aug | ICM/Guardian | 28% | 49% | 19% | 21% |
1 Aug | Gallup/Telegraph | 23% | 56.5% | 14.5% | 33.5% |
21 Jul | Tony Blair becomes leader of the Labour Party [6] | ||||
18 Jul | MORI/Times | 23% | 51% | 21% | 28% |
9 Jul | ICM/Guardian | 31% | 44% | 21% | 13% |
4 Jul | Gallup/Telegraph | 26.5% | 51% | 17.5% | 24.5% |
20 Jun | MORI/Times | 24% | 52% | 20% | 28% |
10 Jun | ICM/Sunday Express | 26.5% | 45.5% | 19% | 19% |
9 June | 1994 European Parliament election [7] | ||||
6 Jun | MORI/Times | 23% | 50% | 22% | 27% |
4 Jun | ICM/Daily Express | 27% | 45% | 22% | 19% |
31 May | MORI/GMB | 22% | 46% | 22% | 24% |
30 May | Gallup/ Telegraph | 21% | 54% | 21.5% | 33% |
23 May | MORI/Times | 27% | 46% | 23% | 19% |
21 May | ICM/Guardian | 30% | 44% | 20% | 14% |
17 May | ICM/Express | 26% | 48% | 23% | 22% |
14 May | MORI/Sunday Times | 26% | 49% | 20% | 23% |
9 May | Gallup/Telegraph | 24.5% | 45.5% | 25% | 20.5% |
7 May | ICM/Guardian | 29% | 44% | 24% | 17% |
5 May | 1994 local elections [8] | ||||
25 Apr | MORI/Times | 26% | 47% | 23% | 21% |
20 Apr | NOP/Independent | 26% | 48% | 21% | 22% |
9 Apr | ICM/Guardian | 30% | 42% | 22% | 12% |
4 Apr | Gallup/Telegraph | 26.5% | 51.5% | 17.5% | 25% |
1 Apr | MORI/Evening Standard | 28% | 46% | 22% | 18% |
31 Mar | NOP/Independent on Sunday | 26% | 50% | 20% | 24% |
28 Mar | MORI/Times | 27% | 49% | 20% | 22% |
12 Mar | ICM/Guardian | 29% | 44% | 22% | 15% |
28 Feb | Gallup/Telegraph | 25% | 48.5% | 21% | 23.5% |
28 Feb | MORI/Times | 28% | 47% | 21% | 19% |
12 Feb | ICM/Guardian | 30% | 44% | 21% | 14% |
31 Jan | Gallup/Telegraph | 26% | 45.5% | 23% | 19.5% |
27 Jan | Audience Selection/Sunday Mirror | 28% | 41% | 24% | 13% |
24 Jan | MORI/Times | 28% | 48% | 20% | 20% |
11 Jan | Gallup/Telegraph | 25.5% | 46.5% | 20.5% | 21% |
11 Jan | MORI/Sun | 30% | 46% | 20% | 16% |
8 Jan | ICM/Guardian | 31% | 43% | 21% | 12% |
Survey end date | Pollster/Client | Con | Lab | Lib Dem | Lead |
---|---|---|---|---|---|
14 Dec | ICM/Observer | 26% | 48% | 23% | 22% |
13 Dec | MORI/Times | 29% | 47% | 20% | 18% |
6 Dec | Gallup/Telegraph | 27% | 48.5% | 20% | 21.5% |
4 Dec | ICM/Guardian | 31% | 42% | 23% | 11% |
22 Nov | MORI/Times | 29% | 47% | 22% | 18% |
13 Nov | NOP/Sunday Times | 27% | 47% | 21% | 20% |
6 Nov | ICM/Guardian | 34% | 38% | 24% | 4% |
1 Nov | Gallup/Telegraph | 24% | 46.5% | 25.5% | 22.5% |
25 Oct | MORI/Times | 29% | 45% | 23% | 16% |
9 Oct | ICM/Guardian | 36% | 39% | 20% | 3% |
9 Oct | ICM/Sunday Express | 30% | 40% | 26% | 10% |
27 Sep | Gallup/Telegraph | 23% | 44.5% | 27% | 21.5% |
24 Sep | ICM/Sunday Express | 27% | 41% | 26% | 14% |
21 Sep | Gallup/Telegraph | 23.5% | 44% | 26.5% | 20.5% |
20 Sep | MORI/Times | 29% | 43% | 25% | 14% |
11 Sep | ICM/Guardian | 29% | 40% | 26% | 11% |
6 Sep | Gallup/Telegraph | 25.5% | 46.5% | 23% | 21% |
23 Aug | MORI/Times | 28% | 42% | 25% | 14% |
7 Aug | ICM/Guardian | 30% | 36% | 27% | 6% |
1 Aug | Gallup/Telegraph | 23% | 44.5% | 27% | 21.5% |
30 Jul | MORI/Sunday Times | 27% | 41% | 28% | 14% |
26 Jul | MORI/Times | 27% | 44% | 25% | 17% |
23 Jul | MORI/Sunday Times | 34% | 44% | 18% | 10% |
5 Jul | Gallup/Telegraph | 24.5% | 43% | 26.5% | 18.5% |
3 Jul | ICM/Guardian | 32% | 37% | 25% | 5% |
28 Jun | MORI/Times | 28% | 46% | 23% | 18% |
12 Jun | MORI/Sunday Times | 29% | 44% | 22% | 15% |
11 Jun | NOP/Independent on Sunday | 27% | 42% | 26% | 15% |
5 Jun | ICM/Guardian | 31% | 38% | 26% | 7% |
31 May | Gallup/Telegraph | 25% | 49% | 23% | 24% |
24 May | MORI/Times | 28% | 44% | 24% | 16% |
19 May | 1993 Northern Ireland local elections | ||||
8 May | ICM/Guardian | 32% | 38% | 24% | 6% |
6 May | 1993 local elections [9] | ||||
3 May | Gallup/Telegraph | 30% | 47% | 17.5% | 17% |
26 Apr | MORI/Times | 32% | 46% | 20% | 14% |
10 Apr | ICM/Guardian | 34% | 39% | 21% | 5% |
1 Apr | Gallup/Telegraph | 30.5% | 49% | 15.5% | 18.5% |
29 Mar | MORI/Times | 32% | 47% | 17% | 15% |
6 Mar | ICM/Guardian | 36% | 41% | 18% | 5% |
1 Mar | Gallup/Telegraph | 32% | 49% | 14% | 17% |
22 Feb | MORI/Times | 34% | 46% | 16% | 12% |
6 Feb | ICM/Guardian | 37% | 39% | 18% | 2% |
1 Feb | Gallup/Telegraph | 33.5% | 46% | 15.5% | 12.5% |
26 Jan | MORI/CCC | 38% | 44% | 13% | 8% |
21 Jan | MORI/Sunday Times | 37% | 45% | 14% | 8% |
11 Jan | Gallup/Telegraph | 33.5% | 45.5% | 14.5% | 12% |
9 Jan | ICM/Guardian | 39% | 37% | 18% | 2% |
Survey end date | Pollster/Client | Con | Lab | Lib Dem | Lead |
---|---|---|---|---|---|
15 Dec | MORI/Sunday Times | 34% | 47% | 16% | 13% |
5 Dec | ICM/Guardian | 36% | 41% | 18% | 5% |
1 Dec | MORI/Sunday Times | 34% | 47% | 15% | 13% |
30 Nov | Gallup/Telegraph | 29% | 52% | 14% | 23% |
20 Nov | ICM/Express | 33% | 49% | 14% | 16% |
12 Nov | Harris/Observer | 32% | 51% | 14% | 19% |
8 Nov | Harris/World in Action | 30% | 53% | 13% | 23% |
7 Nov | ICM/Guardian | 36% | 40% | 19% | 4% |
2 Nov | Gallup/Telegraph | 32.5% | 50% | 13% | 17.5% |
30 Oct | NOP/Independent on Sunday | 34% | 47% | 14% | 13% |
27 Oct | MORI/Sunday Times | 35% | 45% | 15% | 10% |
19 Oct | Gallup | 29% | 51% | 14% | 22% |
12 Oct | Gallup | 36% | 45% | 14% | 9% |
10 Oct | ICM/Guardian | 38% | 38% | 19% | Tie |
29 Sep | MORI/Sunday Times | 37% | 43% | 16% | 6% |
28 Sep | Gallup/Telegraph | 37% | 44% | 15% | 7% |
21 Sep | Gallup/Telegraph | 37% | 42% | 17% | 5% |
19 Sep | MORI/Sunday Times | 39% | 43% | 15% | 4% |
18 Sep | NOP/Independent on Sunday | 39% | 41% | 16% | 3% |
17 Sep | Harris/Observer | 36% | 44% | 16% | 8% |
7 Sep | Gallup | 43% | 41% | 12% | 2% |
5 Sep | ICM/Guardian | 39% | 35% | 19% | 4% |
2 Sep | MORI/Sunday Times | 41% | 44% | 13% | 3% |
21 Aug | MORI/Times | 38% | 44% | 14% | 6% |
14 Aug | NOP/Independent on Sunday | 43% | 39% | 14% | 4% |
8 Aug | ICM/Guardian | 41% | 36% | 17% | 5% |
3 Aug | Gallup | 40.5% | 45% | 12% | 4.5% |
28 Jul | MORI/Sunday Times | 39% | 43% | 15% | 4% |
18 Jul | John Smith becomes leader of the Labour Party [10] | ||||
16 Jul | Harris/Observer | 44% | 38% | 15% | 6% |
6 Jul | Gallup | 42% | 38% | 16% | 4% |
4 Jul | ICM/Guardian | 45% | 36% | 15% | 9% |
23 Jun | MORI/Sunday Times | 42% | 39% | 16% | 3% |
18 Jun | Harris/Observer | 46% | 36% | 15% | 10% |
6 Jun | ICM/Guardian | 45% | 36% | 16% | 9% |
1 Jun | Gallup | 45% | 37% | 17% | 8% |
26 May | MORI/Sunday Times | 43% | 38% | 16% | 5% |
17 May | Audience Selection | 45% | 37% | 13% | 8% |
14 May | Harris/Observer | 46% | 37% | 13% | 9% |
9 May | ICM/Guardian | 45% | 34% | 17% | 11% |
8 May | 1992 local elections [11] | ||||
4 May | Gallup | 42% | 39% | 17% | 3% |
28 Apr | MORI/Sunday Times | 43% | 38% | 16% | 5% |
16 Apr | Harris/Observer | 44% | 36% | 17% | 8% |
12 Apr | Gallup | 39% | 38% | 19% | 1% |
11 Apr | Audience Selection | 42% | 36% | 18% | 6% |
9 Apr | 1992 general election | 41.9% | 34.4% | 17.8% | 7.5% |
All poll data from BBC News. [12]
Pollster | Client | Date(s) conducted | Sample size | Lab | SNP | Con | Lib Dem | Lead |
---|---|---|---|---|---|---|---|---|
1992 election | 9 Apr 1992 | – | 39.0% | 21.5% | 25.6% | 13.1% | 13.4% | |
System 3 | The Herald | 20-24 Mar 1997 | 1,006 | 52% | 20% | 17% | 9% | 32% |
System 3 | The Herald | 27-30 Mar 1997 | 1,003 | 53% | 26% | 12% | 9% | 27% |
ICM | The Scotsman | 29-31 Mar 1997 | 1,000 | 47% | 22% | 20% | 9% | 25% |
NOP | Scot S Times | 2 Apr 1997 | 844 | 49% | 25% | 18% | 6% | 24% |
System 3 | The Herald | 5-6 Apr 1997 | 1,081 | 51% | 23% | 14% | 10% | 28% |
ICM | The Scotsman | 11-13 Apr 1997 | 1,000 | 42% | 23% | 19% | 15% | 19% |
System 3 | The Herald | 12-14 Apr 1997 | 1,000 | 52% | 24% | 13% | 9% | 28% |
NOP | Scot S Times | 17 Apr 1997 | 950 | 47% | 28% | 15% | 8% | 19% |
ICM | The Scotsman | 18-20 Apr 1997 | 1,000 | 47% | 21% | 18% | 11% | 26% |
System 3 | The Herald | 19-20 Apr 1997 | 1,080 | 47% | 21% | 18% | 11% | 26% |
NOP | Scot S Times | 24 Apr 1997 | 1,000 | 49% | 24% | 14% | 12% | 25% |
ICM | The Scotsman | 25-27 Apr 1997 | 1,000 | 46% | 21% | 18% | 13% | 25% |
System 3 | The Herald | 26-27 Apr 1997 | 1,084 | 50% | 26% | 14% | 9% | 25% |
1997 election | 1 May 1997 | – | 45.6% | 22.1% | 17.5% | 13.0% | 23.5% |
The 2001 United Kingdom general election was held on Thursday 7 June 2001, four years after the previous election on 1 May 1997, to elect 659 members to the House of Commons. The governing Labour Party was re-elected to serve a second term in government with another landslide victory with a 167 majority, returning 412 members of Parliament versus 418 from the 1997 general election, a net loss of six seats, though with a significantly lower turnout than before—59.4%, compared to 71.6% at the previous election. The number of votes Labour received fell by nearly three million. Tony Blair went on to become the only Labour Prime Minister to serve two consecutive full terms in office. As Labour retained almost all of their seats won in the 1997 landslide victory, the media dubbed the 2001 election "the quiet landslide".
The Conservative Party, officially the Conservative and Unionist Party and colloquially known as the Tories, is one of the two main political parties in the United Kingdom, along with the Labour Party. It is the current governing party, having won the 2019 general election, and has been the primary governing party in the United Kingdom since 2010. The party sits on the to centre-right to right-wing of the political spectrum. It encompasses various ideological factions including one-nation conservatives, Thatcherites, and traditionalist conservatives. The party holds the annual Conservative Party Conference, at which senior Conservative figures promote party policy.
The 1997 United Kingdom general election was held on Thursday, 1 May 1997. The governing Conservative Party led by Prime Minister John Major was defeated in a landslide by the Labour Party led by Tony Blair, achieving a 179-seat majority.
The 1992 United Kingdom general election was held on Thursday 9 April 1992, to elect 651 members to the House of Commons. The election resulted in the fourth consecutive victory for the Conservative Party since 1979, with a majority of 21 and would be the last time that the Conservatives would win an overall majority at a general election until 2015. It was also the last general election to be held on a day which did not coincide with any local elections until 2017. This election result took many by surprise, as opinion polling leading up to the election day had shown a narrow but consistent lead for the Labour Party under leader Neil Kinnock.
Sir John Alan Redwood is a British politician and academic who has been the Member of Parliament (MP) for Wokingham in Berkshire since 1987. A member of the Conservative Party, he was Secretary of State for Wales in the Major government and was twice an unsuccessful candidate for the leadership of the Conservative Party in the 1990s. Redwood subsequently served in the Shadow Cabinets of William Hague and Michael Howard; he has remained a backbencher since then.
The 2010 United Kingdom general election was held on Thursday 6 May 2010, with 45,597,461 registered voters entitled to vote to elect members to the House of Commons. The election took place in 650 constituencies across the United Kingdom under the first-past-the-post system.
"Shy Tory factor" is a name given by British opinion polling companies to a phenomenon first observed by psephologists in the early 1990s. They observed that the share of the electoral vote won by the Conservative Party was significantly higher than the equivalent share in opinion polls. The accepted explanation was that so-called "shy Tories" were voting Conservative after telling pollsters they would not. The general elections held in 1992 and 2015 are examples where it has allegedly affected the overall results, but has also been discussed in other elections where the Conservatives did unexpectedly well. It has also been applied to the success of the Republican Party in the United States or the continued electoral victories of the People's Action Party in Singapore.
The 1994 Labour Party leadership election was held on 21 July 1994 following the death of the incumbent leader, John Smith, on 12 May. Tony Blair won the leadership and became Prime Minister after winning the 1997 general election.
The Labour Party is a political party in the United Kingdom that has been described as an alliance of social democrats, democratic socialists, and trade unionists. The Labour Party sits on the centre-left of the political spectrum. In all general elections since 1922, Labour has been either the governing party or the Official Opposition. There have been six Labour prime ministers and thirteen Labour ministries. Since the 2010 general election, it has been the second-largest UK political party by the number of votes cast, behind the Conservative Party and ahead of the Liberal Democrats. The party holds the annual Labour Party Conference.
The Shadow Secretary of State for Transport is a political post in the United Kingdom. It has been consistently held by a member of the Official Opposition Shadow Cabinet since May 1979. The Shadow Secretary helps hold the Transport Secretary and junior ministers to account and is the lead spokesperson on transport matters for their party. Should the relevant party take office, the Shadow Secretary would be a likely candidate to become Transport Secretary.
The shadow cabinet minister for international development is the lead spokesperson for the United Kingdom's Official Opposition on issues related to international aid, most notably to the Third World. The shadow cabinet minister holds the Minister of State for Development and Africa to account in Parliament. The role previously had no counterpart in the Government between 2020 and 2022 after the Department for International Development (DFID) and the role of international development secretary was abolished by the second Johnson government in 2020. The position was renamed from Shadow Secretary of State for International Development in November 2021 and placed under the Shadow Foreign Secretary.
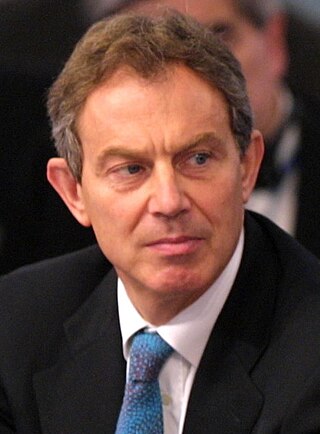
Tony Blair was Leader of the Labour Party and Leader of the Opposition from his election as Leader on 21 July 1994 until he became Prime Minister on 2 May 1997. Blair became leader upon the death of John Smith. Under Blair, the Labour Party was rebranded as New Labour to distance itself from previous Labour politics and the traditional idea of socialism. Despite opposition from Labour's left-wing, he abolished Clause IV, the party's formal commitment to the nationalisation of the economy, weakened trade union influence in the party, and committed to the free market and the European Union.
Electoral Calculus is a political forecasting web site that attempts to predict future United Kingdom general election results. It considers national factors and local demographics.
"One more heave" was a slogan used by British Liberal Party leader Jeremy Thorpe during the October 1974 general election and a phrase used to describe the political strategy of John Smith, leader of the Labour Party from July 1992 until his death in May 1994.
The 2014 European Parliament election was the United Kingdom's component of the 2014 European Parliament election, held on Thursday 22 May 2014, coinciding with the 2014 local elections in England and Northern Ireland. In total, 73 Members of the European Parliament were elected from the United Kingdom using proportional representation. England, Scotland and Wales use a closed-list party list system of PR, while Northern Ireland used the single transferable vote (STV).
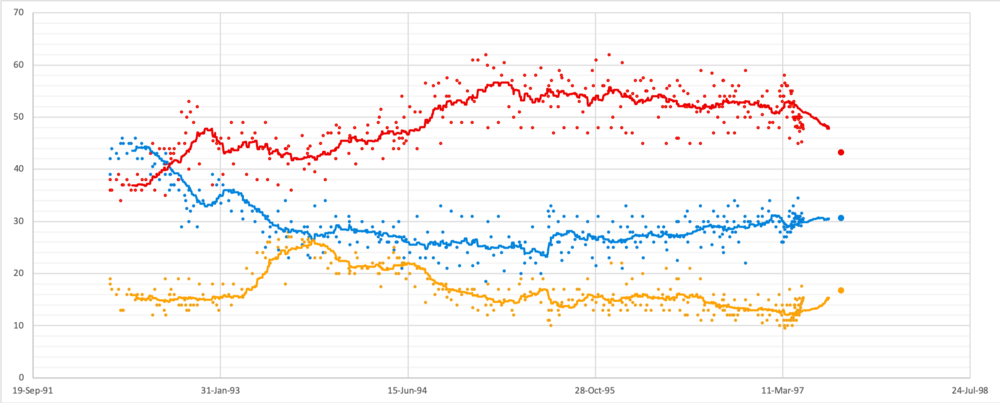
In the run up to the general election of 2001, several polling organisations carried out opinion polling in regards to voting intention in Great Britain. Results of such polls are displayed below.
The 2015 United Kingdom general election was held on Thursday 7 May 2015 to elect 650 Members of Parliament to the House of Commons. It was the only general election held under the rules of the Fixed-term Parliaments Act 2011 and was the last general election to be held before the United Kingdom would vote to end its membership of the European Union (EU). Local elections took place in most areas of England on the same day.
Prior to the 2019 United Kingdom general election, various organisations carried out opinion polling to gauge voting intentions. Results of such polls are displayed in this list. Most of the pollsters listed are members of the British Polling Council (BPC) and abide by its disclosure rules. Opinion polling about attitudes to the leaders of various political parties can be found in a separate article.
In the run up to the 1992 general election, various organisations carried out opinion polling to gauge voting intention in the United Kingdom. Results of such polls are displayed in this article. The date range for these opinion polls are from the election to 8 April.
Opinion polling for the next United Kingdom general election is being carried out continually by various organisations to gauge voting intention. Most of the polling companies listed are members of the British Polling Council (BPC) and abide by its disclosure rules. The dates for these opinion polls range from the 2019 general election on 12 December to the present day.