Water supply and sanitation in sub-Saharan Africa

Last updated
In many countries in Africa, jerry cans which are used to transport and store water are a good option for safe storage Africa water challege.jpg
In many countries in Africa, jerry cans which are used to transport and store water are a good option for safe storage

Although access to water supply and sanitation in sub-Saharan Africa has been steadily improving over the last two decades, the region still lags behind all other developing regions. Access to improved water supply had increased from 49% in 1990 to 68% in 2015, [1] while access to improved sanitation had only risen from 28% to 31% in that same period. Sub-Saharan Africa did not meet the Millennium Development Goals (MDGs, 1990–2015) of halving the share of the population without access to safe drinking water and sanitation between 1990 and 2015. [2] There still exists large disparities among sub-Saharan African countries, and between the urban and rural areas.

Contents

Usually, water is provided by utilities in urban areas and municipalities or community groups in rural areas. Sewerage networks are not common and wastewater treatment is even less common. Sanitation is often in the form of individual pit latrines or shared toilets. 70% of investments in water supply and sanitation in sub-Saharan Africa is financed internally and only 30% is financed externally (2001–2005 average). Most of the internal financing is household self-finance ($2.1bn), which is primarily for on-site sanitation such as latrines. Public sector financing ($1.2bn) is almost as high as external financing (US$1.4bn). The contribution of private commercial financing has been negligible at $10 million only.

Water resources

A map of sub-saharan Africa. Sub-Saharan Africa definition UN.png
A map of sub-saharan Africa.

Groundwater

Communal tap (standpost) for drinking water in Soweto, Johannesburg, South Africa. May 2005 Communal tap (standpost) for drinking water in Soweto, Johannesburg, South Africa (2941729790).jpg
Communal tap (standpost) for drinking water in Soweto, Johannesburg, South Africa. May 2005

Groundwater plays a key role in sustaining water supplies and livelihoods in sub-Saharan Africa especially due to its widespread availability, generally high quality, and intrinsic ability to buffer episodes of drought and increasing climate variability.

Yet there is limited sources available to provide clean drinkable water in Africa, one of the research conducted in 2007 has shown that over 40% of Africans use groundwater as their main source of drinking water, particularly in North and Southern African countries. [3] [4] [5]

Piped water is still the most important source of drinking water (39%) in urban areas, yet boreholes are becoming more important (24%). [3] The WHO (2006) stated that, in 2004, only 16% of people in sub-Saharan Africa had access to drinking water through a household connection (an indoor tap or a tap in the yard). Even when there is available water in these places, there is poor access to readily accessible drinking water as there are risks of contamination due to several factors. Factors such as poor maintenance due to limited financial resources, pollution and poor sanitation sometimes due to limited financial resources. When wells are built and water sanitation facilities are developed, sometimes water quality testing is not performed as often as is necessary, and lack of education among the people utilizing the water source. [6]

Surface water

Congo Basin is the world's second largest river basin covering over 12% of the African continent Congobasinmap.png
Congo Basin is the world's second largest river basin covering over 12% of the African continent

World Health Organisation (WHO) in 2015 reported that about 159 million people fetched untreated surface water from lakes, ponds, rivers and streams globally. Surface water sources in Africa are sometimes highly polluted. Factors such as sewage discharges, oil pollution, industrial factors etc. For example, Niger Delta which is home to much of Nigeria's oil industry of which about 2 million barrels of oil are extracted from the area daily, has contaminated water due to spills. [7]

Impacts of climate change

The effects of climate change on the water cycle will have repercussions on the availability of water resources for human uses in Africa. For example, there will be changes to precipitation patterns, i.e. how much rain falls when and where.

Climate change is expected to amplify existing stress on water availability in Africa, however this impact is likely to modest compared to drivers such as population growth, urbanization, agricultural growth and land-use change. [8] While multiple factors will impact water availability in Africa, climate change will contribute to water shortages in North Africa and Southern Africa. In North Africa, climate change may account for 22% of total water shortage in the region. [9] Climate change as well as socio-economic drivers are also expected to intensify water scarcity in Southern Africa as increasing temperatures and variable rainfall lead to reduced streamflows in rivers across the region. [10] Climate change is also likely to result in increased hydrological extremes, such as droughts which are expected to last longer and happen more often in Southern Africa, placing considerable stress on water supply. [8]

In East Africa changes in water resources are uncertain, as climate models in the region predict either increases or decreases in total rainfall over the region. Increasing temperature may increase evaporation and lead to shrinking glaciers and ice cover, which may place strain on water resource. [11] However future projects indicate an increase in the intensity of rainfall which is likely to result in increased streamflows in regions such as the Lake Victoria Basin. [12]

Observed surface temperatures have generally increased over Africa since the late 19th century to the early 21st century by about 1 °C, but locally as much as 3 °C for minimum temperature in the Sahel at the end of the dry season. [13] Observed precipitation trends indicate spatial and temporal discrepancies as expected. [14] [15] The observed changes in temperature and precipitation vary regionally. [16] [14]

Current climate models (as summarised in the IPCC Sixth Assessment Report) predict increases in frequency and intensity of drought and heavy rainfall events. [17] They also predict decreases in mean precipitation almost everywhere in Africa, with medium to high confidence. However, local rainfall trends and socio-climatic interactions are likely to manifest in mixed patterns. Therefore, the converging impacts of climate change will vary across the continent. In rural areas, rainfall patterns influence water usage. [17]

A study in 2019 predicted increased dry spell length during wet seasons and increased extreme rainfall rates in Africa. [18] In other words: "both ends of Africa's weather extremes will get more severe". [19] The research found that most climate models will not be able to capture the extent of these changes because they are not convection-permitting at their coarse grid scales. [18]

Access

Access to improved water supply and sanitation, in 7 Sub-Saharan countries, from 1990 until 2008. Source: WHO/UNICEF Joint Monitoring Program (2010) Access to Improved Water Sources and Sanitation in Sub-Saharan Africa.png
Access to improved water supply and sanitation, in 7 Sub-Saharan countries, from 1990 until 2008. Source: WHO/UNICEF Joint Monitoring Program (2010)

In sub-Saharan Africa access to water supply and sanitation has improved, but the region lags behind all other developing regions: access to safe drinking water had increased from 49% in 1990 to 60% in 2008, while in the same time span access to improved sanitation had only risen from 28% to 31%. Sub-Saharan Africa did not meet the Millennium Development Goals of halving the share of the population without access to safe drinking water and sanitation between 1990 and 2015. [2]

These trends in water supply and sanitation are directly reflected in health: the under-five child mortality had significantly decreased worldwide, but Sub-Saharan Africa showed the slowest pace of progress. [20]

The targets set under the Sustainable Development Goals in 2015 have, unlike the Millennium Development Goals, drinking water and sanitation reported separately – i.e., targets for access to safe and affordable drinking water (target 6.1) and adequate and equitable sanitation and hygiene (target 6.2). [21] Particularly, Sustainable Development Goal SDG6 focuses on ensuring availability and sustainable management of water and sanitation for all. [21] The SDGs have also included reporting on hygiene, that was missing within the MDGs. Access to hygiene facilities in particular is a major barrier to achieving combined SDG access, reducing coverage in SSA from 19.7% to 4.4% (data from 2017). [21]

In 2020, 65% of the global population were using piped water (83% urban and 42% rural). [22] Piped water counts as an improved water source. [23] :12 Overall, sub-Saharan Africa is lagging, with 35% of the population using piped water (56% urban and 20% rural). Within these statistics, access to safely managed drinking water varies within and between large cities, medium- and small-towns. [22]

With regards to WASH (water, sanitation and hygiene) in schools, data from 2019 showed that "Africa reports basic provision of WASH services in schools at 44 per cent for drinking water, 47 per cent for sanitation and 26 per cent for hygiene". [24] :9 In general, children who go to schools in rural schools have less access to good WASH services than urban children. [24] :9

National differences

There are large disparities amongst countries in the Sub-Saharan region. Access to safe drinking water varies from 38% in Ethiopia to 91% in South Africa, while the access to improved sanitation fluctuates from 11% in Burkina Faso to 77% in South Africa. The situation in Ivory Coast is significantly better, with the access to improved drinking water source at 82% [25]

The urban-rural disparities

Urban and rural piped water coverage in Africa and Asia in 2015: Access to piped water in rural areas of Africa is consistently lower than in urban areas of Africa. Urban and rural piped water coverage in Africa and Asia in 2015.jpg
Urban and rural piped water coverage in Africa and Asia in 2015: Access to piped water in rural areas of Africa is consistently lower than in urban areas of Africa.

In the entire sub-Saharan region, water supply and sanitation coverage in urban areas is almost double the coverage in rural areas, both for water (83% in urban areas, 47% in rural areas) as for sanitation (44% vs. 24%). Yet, the rural areas improve at fast pace, whereas in urban areas the extension of water supply and sanitation infrastructure can barely keep up with the fast urban demographic growth. [2]

Different interpretations of access

Remark that the concepts 'access' and 'improved' are not unequivocal. The definitions used by the WHO/UNICEF Joint Monitoring Program for Water Supply and Sanitation do not necessarily coincide with those of other surveys or national policies. The government of Burkina Faso, for instance, takes into account aspects such as waiting time and water quality. In fact, almost half of the Sub-Saharan households that according to WHO/UNICEF 'have access to improved water supply', spend more than half an hour a day collecting the water. [2] Although this loss of time is mentioned in the WHO/UNICEF report, it does not affect their 'improved' vs. 'non-improved' distinction.

National stakeholders in water supply and sanitation

Since the 1990s almost all African countries have been decentralising their political powers from the centre towards local authorities: in Mali it started in 1993, in Ethiopia in 1995, in Rwanda in 2002, in Burkina Faso in 2004, ... Along with the decentralisation process, a reform of the water supply and sanitation sector has been put through. The institutional structures for water supply and sanitation that came out of it differ throughout the continent. Two general distinctions can be made.

A first distinction should be made between water supply and sanitation responsibilities in (i) urban areas and (ii) rural areas. Most governments have created corporatised utilities for water supply and sanitation in the urban areas. In rural areas the responsibilities usually rest in the hands of the municipality, community-based groups, or local private companies. The task of the central government is generally limited to setting the national goals and regulations for water supply and sanitation.

A second distinction, with respect to the urban areas, exists between those countries (mostly francophone) that have retained one national utility active in all urban areas of the country, and other countries (mostly anglophone) that have further decentralised the utilities to local jurisdictions [27]

Urban areas

Involvement of the private sector in the Sub-Saharan water utilities. AICD Background Paper 12 Legal status and ownership of the Sub-Saharan water utilities.png
Involvement of the private sector in the Sub-Saharan water utilities. AICD Background Paper 12

In the last two decades, the management of urban water supply and sanitation has been increasingly put in hands of newly created utilities. In some cases these water supply and sanitation utilities also supply electricity. The majority of these utilities are corporatized, meaning that they emulate a private company in terms of productivity and financial independence. Nevertheless, they widely differ in legal status and ownership structure.

There were hopes that, by creating independent utilities, their business could become commercially sustainable and attract private capital. Almost half of the sub-Saharan countries have experimented with some form of private sector participation in the utility sector since the early 1990s, which was largely supported by the World Bank. The experience with these private sector contracts has been mixed. While they did not succeed in attracting much private capital, some of them improved performance. However, almost one third have been ended before their intended termination, such as in Dar es-Salaam in Tanzania. Others were not renewed. [27] [28]

Today nearly half of the utilities are public enterprises and majority-owned by the central government. [27] Senegal is an example where private involvement was successful: the affermage (leasing) of the network to a private operator has considerably increased efficiency and contributed to increase access. Senegal also received external funding for its water treatment and distribution network, namely a €64.5 million loan from the European Investment Bank combined with a €5.55 million European Union grant to the Republic of Senegal in 2023. The funding aims to provide drinking water to Saint-Louis inhabitants, reservoir units, and the enlargement of its distribution network, which is crucial to avoid the relocation of inhabitants due to lack of water. [29] [30] [31] The €5.55 million European Union fund, mobilized as part of Team Europe by the European Investment Bank, will assist Senegal's water utility in accelerating its 35000 subsidised drinking water connections for 350 000 consumers across the nation. [32] [33] [34] Besides Senegal, private operators still have a role in South Africa (four utilities), Cameroon, Cape Verde, Ivory Coast, Gabon, Ghana, Mozambique, Niger and Uganda (in small towns). [28] In Uganda and Burkina Faso public national utilities were strengthened through short-term public-private partnerships in the form of performance-based service contracts.

The utilities never reach all households in their territory. The share of unconnected urban households fluctuates from over 80% in poor countries like Uganda, Mozambique, Rwanda, Nigeria, and Madagascar, to 21% in Namibia and 12% in South Africa.

Some African utilities are in charge of water supply only, while others are in charge of sanitation as well. Some national water utilities, especially in Francophone Africa, also provide electricity. This is the case in Gabon, Mauritania and Rwanda, among others.

Since fast demographic growth reveals itself in expanding peri-urban areas and slum areas - rarely served by water networks or sewers – the share of the urban households connected to piped water has been steadily decreasing from 50% in 1990 to 39% in 2005. [27] The unconnected households need to rely on alternatives –formal or informal– such as: shared standpipes or boreholes, water tankers and household resellers. Usually, standpipes are the main source of water for unconnected urban households.

Rural areas

The responsibility for water supply and sanitation in rural areas has in most countries been decentralised to the municipalities: they determine the water and sanitation needs and plan the infrastructure, in line with the national water laws. Various central governments have created a national social fund (supported by donors) from which the municipalities can draw money to finance rural water supply and sanitation infrastructure. Although the municipalities usually own the infrastructure, they rarely provide the service. This it is rather delegated to community-led organisations or local private companies. Studies by the World Bank and others suggest the need for more attention to private sector operation of all types of rural water supplies. [35]

In Kenya, Tanzania and South Africa, utilities provide services to rural dwellers as well, although this does not preclude the coexistence of different arrangements for the rural space in those countries. [27] In Rwanda local private operators are common in rural areas. Most countries in the region take on an active role in building infrastructure (mostly boreholes). Other countries are trying different approaches, such as self-supply of water and sanitation, where most of the investment costs for simple systems are born by the users. [36] Self-supply is currently part of National Policies in Ethiopia and has been implemented at scale in Zimbabwe in the past. [37]

Local revenue generation underpins delivery of drinking water services in rural Africa yet is threatened by seasonal rainfall and water usage patterns. [38] There is evidence that intra-seasonal rainfall analysis can enhance rural piped water revenue planning by offering localised insight into water demand dynamics and revealing where climate variability may increase dependence on reliable services. There is a seasonal threat to rural piped water revenue in for example Ghana, Rwanda, and Uganda. It appears to decrease with frequency of dry intervals during the wet season, which is a metric of rainfall variability. [38]

Private water service providers

Small private water service providers (WSPs) are common in many developing countries, also in Sub-Saharan Africa. [39] They often operate in informal ways and fill the gaps left by formal government provision of water supply. Examples for cities where small private WSPs are common include for example Nairobi (Kenya) and Dar es Salam (Tanzania). [39]

There are three categories of private water service providers: [39]

Potential problems with these informal water service providers is the amount of profit they might make and if this is "fair". Predatory pricing can be another potential problem. Also, there could be microbial contamination of the drinking water they are selling due to contaminated water containers used in the process. [39]

On the other hand, as of 2017, the JMP does recognise packaged or delivered water as a water source that falls into the grouping of improved water source. [39]

Quality of service

Example for drinking water quality issues in Kenya and Ethiopia: Stacked bar chart of the number of publications reporting data for each water quality parameter, with publications grouped as reporting no water points exceeding guideline threshold or reporting at least one water point exceeding threshold. The chosen thresholds are from the country's standards or WHO health guideline or East Africa Standard (EAS) for natural potable water. 1-s2.0-S0048969723055547-gr5 lrg.jpg
Example for drinking water quality issues in Kenya and Ethiopia: Stacked bar chart of the number of publications reporting data for each water quality parameter, with publications grouped as reporting no water points exceeding guideline threshold or reporting at least one water point exceeding threshold. The chosen thresholds are from the country's standards or WHO health guideline or East Africa Standard (EAS) for natural potable water.

A first indicator of the quality of water supply services is the continuity of service. The urban utilities deliver continuous services in Burkina Faso, Senegal and South Africa, but are highly intermittent in Ethiopia and Zambia. In rural areas, continuity is expressed by the ratio of water points out of order, or by the average time per year or per month that a water point is unusable. In low income Sub-Saharan countries, indicatively, over one third of the rural water supply infrastructure is in disuse.[ citation needed ]

A second indicator of quality is the compliance with microbiological water norms. WHO/UNESCO has recently developed a Rapid Assessment of Drinking-Water Quality (RADWQ) survey method. On average, in developing countries, compliance with the who norms is close to 90% for piped water, and between 40% and 70% for other improved sources. [2] No national or regional data have been published yet.

Financial aspects

Tariffs and cost recovery

Formal and informal water tariffs in 6 Sub-Saharan Cities. World Bank WSS survey database Water tariffs in 7 Sub-Saharan Cities.png
Formal and informal water tariffs in 6 Sub-Saharan Cities. World Bank WSS survey database

There is an overall underpricing of formal water and sanitation services in sub-Saharan Africa. [28] [41] A first consequence is an insufficient cost recovery, leading to dependency on foreign aid and governmental support, and to insufficient investments. Second, underpricing is socially unfair. Since the poorest social groups are less connected to water networks and sewerage, they need to turn to alternatives, and they pay in some cases a multiple of the formal tariff. Hence, the poorest are hit twice: they have less access to improved water supply and sanitation, and they need to pay more.

South Africa stands out for having introduced free basic utility services for all, including 6m3 of water per month for free.

Tariffs of about $0.40 per m3 are considered sufficient to cover operating costs in most developing-country contexts, while $1.00 would cover both operation, maintenance and infrastructure. Assuming that a tariff is affordable as long as the bill does not exceed 5% of the household's budget, the World Bank calculates that even in the low-income sub-Saharan countries up to 40% of the households should be able to pay the full-cost tariff of $1 per m3 [42]

Efficiency

The number of employees per 1000 connections is an indicator of the technical efficiency of utilities. In sub-Saharan Africa, the average is 6. [43] The highest efficiency is observed in South Africa, where the four utilities need 2.1–4.0 employees per 1000 connections. Rwanda peaks with 38.6 employees per 1000 connections. [43]

Another indicator is the share of non-revenue water (water that is lost or not metered). In an efficiently managed system, this amount is below 25%. In 2005 it was estimated to be 20% in Senegal, 18% in Burkina Faso, 16% for the Water Utility Corporation in Botswana, 14% in Windhoek in Namibia and 12% in Drakenstein, South Africa. These utilities have achieved levels of non-revenue water similar to levels in OECD countries. However, in other African countries the level of non-revenue water is extremely high: For example, it exceeds 45% in Zambia, is more than 60% in Maputo (Water supply and sanitation in Mozambique|Mozambique), 75% in Lindi (Water supply and sanitation in Tanzania|Tanzania) and 80% in Kaduna (Nigeria). [44] Few data are available for efficiency in the rural space.

Expenditures

In sub-Saharan Africa, current spending on water supply and sanitation (investments, operation and maintenance) totals to $7.6 billion per year, or 1.19% of the regional GDP. This includes $4.7 billion per year for investments (2001-2005 average). According to the World Bank, total expenditures are less than half of what would be required to achieve the Millennium Development Goals in sub-Saharan Africa; that would need more than $16.5 billion per year or 2.6% of the regional GDP. [28] The African Development Bank estimates that $12 billion is required annually to cover Africa's needs in improved water supply and sanitation. [45]

Expenditures are often not well targeted. According to a World Bank study, there is a large gap in expenditures between rural and urban areas, in particular capital cities. Public expenditures go to where they are most easily spent rather than where they are most urgently needed. Sanitation receives only a small part of public expenditures: Low household demand for sanitation results in politicians not seeing sanitation as a vote winner, and therefore allocating scarce resources to sectors with higher perceived political rewards. [46]

Financing

Out of the $4.7 billion of investments in water supply and sanitation in sub-Saharan Africa, 70% is financed internally and only 30% is financed externally (2001-2005 average). Most of the internal financing is household self-finance ($2.1bn), which is primarily for on-site sanitation such as pit latrines. Public sector financing ($1.2bn) is almost as high as external financing (US$1.4bn). The contribution of private commercial financing has been negligible at $10 million only. [47]

The share of external financing varies greatly. In the 2001-2005 period official development assistance financed 71% of investments in Benin, 68% in Tanzania, 63% in Kenya, 43% in the DR of Congo, 34% in South Africa, 13% in Nigeria and less than 1% in Côte d'Ivoire or Botswana. [48] According to another World Bank study of 5 countries, in the 2002-2008 period official development assistance financed on average 62% of public expenditures on water and sanitation. The share varied from 83% in Sierra Leone to 23% in the Republic of Congo. [49]

External cooperation

In 2008, $1.6 billion of foreign aid flowed into the water supply and sanitation sector in sub-Saharan Africa, which is 4% of all development aid disbursed to sub-Saharan Africa. This foreign aid covered 21% of all expenditures in water supply and sanitation in sub-Saharan Africa, and was principally directed to investments in infrastructure. Operation and maintenance is financed by the national governments and consumer revenues. [28]

The largest donors to water supply and sanitation in sub-Saharan Africa are the World Bank, the EU institutions, the African Development Fund, and bilateral assistance from Germany and the Netherlands. The United States, although they are the largest donor in Sub-Saharan Africa in absolute numbers, play a marginal role in the water supply and sanitation sector.

Total aid to SSA, in M$ and % of totalAid to SSA in WSS, in M$ and % of total
World Bank (IDA)4 856 (12.3%)378 (24.1%)
EU institutions5 056 (12.8%)266 (16.6%)
African Development Fund1 780 (4.5%)193 (12.0%)
Germany2 906 (7.4%)171 (10.7%)
The Netherlands1 446 (3.7%)137 (8.5%)
United States6 875 (17.4%)13 (0.8%)
Total received by SSA39 451 (100%)1 603 (100%)

Especially in the poorer countries the presence of many different donors and Western NGOs puts a strain on the coherence of national strategies, such as in Burkina Faso and Ethiopia. Foreign aid comes in at all levels: the central government, the national social funds, the utilities, the local authorities, local NGOs,... Although most foreign actors try to inscribe their aid in the existing national structures, their implementation approaches and technical solutions often differ.

Strategies for improvement

The final report on Africa's Infrastructure, [28] has the following recommendations for the water supply and sanitation sector:

See also

Related Research Articles

<span class="mw-page-title-main">Water supply</span> Provision of water by public utilities, commercial organisations or others

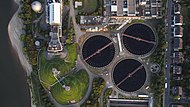
Water supply is the provision of water by public utilities, commercial organisations, community endeavors or by individuals, usually via a system of pumps and pipes. Public water supply systems are crucial to properly functioning societies. These systems are what supply drinking water to populations around the globe. Aspects of service quality include continuity of supply, water quality and water pressure. The institutional responsibility for water supply is arranged differently in different countries and regions. It usually includes issues surrounding policy and regulation, service provision and standardization.

<span class="mw-page-title-main">Water supply and sanitation in Latin America</span>

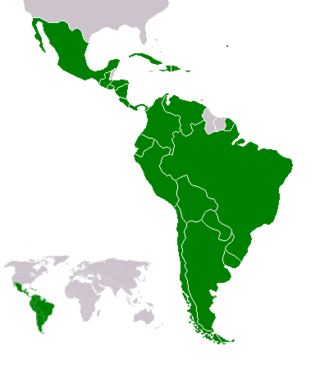
Water supply and sanitation in Latin America is characterized by insufficient access and in many cases by poor service quality, with detrimental impacts on public health. Water and sanitation services are provided by a vast array of mostly local service providers under an often fragmented policy and regulatory framework. Financing of water and sanitation remains a serious challenge.

Drinking water and sanitation in Nicaragua are provided by a national public utility in urban areas and water committees in rural areas. Despite relatively high levels of investment, access to drinking water in urban areas has barely kept up with population growth, access to urban sanitation has actually declined and service quality remains poor. However, a substantial increase in access to water supply and sanitation has been reached in rural areas.

Water supply and sanitation in Indonesia is characterized by poor levels of access and service quality. More than 16 million people lack access to an at least basic water source and almost 33 million of the country's 275 million population has no access to at least basic sanitation. Only about 2% of people have access to sewerage in urban areas; this is one of the lowest in the world among middle-income countries. Water pollution is widespread on Bali and Java. Women in Jakarta report spending US$11 per month on boiling water, implying a significant burden for the poor.

In 2020, 97.7% of Indians had access to the basic water and sanitation facilities. India faces challenges ranging from sourcing water for its megacities to its distribution network which is intermittent in rural areas with continuous distribution networks just beginning to emerge. Non-revenue water is a challenge.

<span class="mw-page-title-main">Water supply and sanitation in Ethiopia</span> Overview drinking water supply and sanitation in Ethiopia

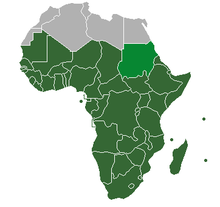
Access to water supply and sanitation in Ethiopia is amongst the lowest in Sub-Saharan Africa and the entire world. While access has increased substantially with funding from foreign aid, much still remains to be done. Some factors inhibiting the achievement of these goals are the limited capacity of water bureaus in the country's nine regions, two city administrations and water desks in the 770 districts of Ethiopia (woredas); insufficient cost recovery for proper operation and maintenance; and different policies and procedures used by various donors, notwithstanding the Paris Declaration on Aid Effectiveness.

Water supply and sanitation in China is undergoing a massive transition while facing numerous challenges such as rapid urbanization, increasing economic inequality, and the supply of water to rural areas. Water scarcity and pollution also impact access to water.

Water supply and sanitation in Yemen is characterized by many challenges as well as some achievements. A key challenge is severe water scarcity, especially in the Highlands, prompting The Times of London to write "Yemen could become the first nation to run out of water". A second key challenge is a high level of poverty, making it very difficult to recover the costs of service provision. Access to water supply sanitation in Yemen is as low or even lower than that in many sub-Saharan African countries. Yemen is both the poorest country and the most water-scarce country in the Arab world. Third, the capacity of sector institutions to plan, build, operate and maintain infrastructure remains limited. Last but not least the security situation makes it even more difficult to improve or even maintain existing levels of service.

<span class="mw-page-title-main">Water supply and sanitation in Rwanda</span> Water supply and sanitation in Rwanda

Water supply and sanitation in Rwanda is characterized by a clear government policy and significant donor support. In response to poor sustainability of rural water systems and poor service quality, in 2002 local government in the Northern Byumba Province contracted out service provision to the local private sector in a form of public–private partnership. Support for public-private partnerships became a government policy in 2004 and locally initiated public-private partnerships spread rapidly, covering 25% of rural water systems as of 2007.

The Philippines' water supply system dates back to 1946, after the country declared independence. Government agencies, local institutions, non-government organizations, and other corporations are primarily in charge of the operation and administration of water supply and sanitation in the country.

<span class="mw-page-title-main">Water supply and sanitation in Bangladesh</span>

Bangladesh is faced with multiple water quality and quantity problems along with regular natural disasters, such as cyclones and floods. Available options for providing safe drinking water include tubewells, traditionally dug wells, treatment of surface water, desalination of groundwater with high salinity levels and rainwater harvesting.

<span class="mw-page-title-main">Water supply and sanitation in Zambia</span>

Water supply and sanitation in Zambia is characterized by achievements and challenges. Among the achievements are the creation of regional commercial utilities for urban areas to replace fragmented service provision by local governments; the establishment of a regulatory agency that has substantially improved the availability of information on service provision in urban areas; the establishment of a devolution trust fund to focus donor support on poor peri-urban areas; and an increase in the access to water supply in rural areas.

<span class="mw-page-title-main">Water supply and sanitation in Senegal</span>

Water supply and sanitation in Senegal is characterized by a relatively high level of access compared to most of Sub-Saharan Africa. One of its interesting features is a public-private partnership (PPP) that has operatedin Senegal since 1996, with Senegalaise des Eaux (SDE), a subsidiary of Saur International, as the private partner. It does not own the water system but manages it on a 10-year lease contract with the Senegalese government. Between 1996 and 2014, water sales doubled to 131 million cubic meters per year and the number of household connections increased by 165% to more than 638,000. According to the World Bank, "the Senegal case is regarded as a model of public-private partnership in sub-Saharan Africa". Another interesting feature is the existence of a national sanitation company in charge of sewerage, wastewater treatment and stormwater drainage, which has been modeled on the example of the national sanitation company of Tunisia and is unique in Sub-Saharan Africa.

<span class="mw-page-title-main">Water supply and sanitation in Morocco</span>

Water supply and sanitation in Morocco is provided by a wide array of utilities. They range from private companies in the largest city, Casablanca, the capital, Rabat, Tangier, and Tetouan, to public municipal utilities in 13 other cities, as well as a national electricity and water company (ONEE). The latter is in charge of bulk water supply to the aforementioned utilities, water distribution in about 500 small towns, as well as sewerage and wastewater treatment in 60 of these towns.

<span class="mw-page-title-main">Water supply and sanitation in Tanzania</span>

Water supply and sanitation in Tanzania is characterised by: decreasing access to at least basic water sources in the 2000s, steady access to some form of sanitation, intermittent water supply and generally low quality of service. Many utilities are barely able to cover their operation and maintenance costs through revenues due to low tariffs and poor efficiency. There are significant regional differences and the best performing utilities are Arusha and Tanga.

<span class="mw-page-title-main">Water supply and sanitation in Burkina Faso</span>

Water supply and sanitation in Burkina Faso are characterized by high access to water supply in urban areas, while access to an at least basic water sources in rural areas – where three quarters of the population live – remains relatively low. An estimated one third of water facilities in rural areas are out of service because of a lack of maintenance. Access to at least basic sanitation lags significantly behind access to water supply.

Water supply and sanitation in Japan is characterized by numerous achievements and some challenges. The country has achieved universal access to water supply and sanitation; has one of the lowest levels of water distribution losses in the world; regularly exceeds its own strict standards for the quality of drinking water and treated waste water; uses an effective national system of performance benchmarking for water and sanitation utilities; makes extensive use of both advanced and appropriate technologies such as the jōkasō on-site sanitation system; and has pioneered the payment for ecosystem services before the term was even coined internationally. Some of the challenges are a decreasing population, declining investment, fiscal constraints, ageing facilities, an ageing workforce, a fragmentation of service provision among thousands of municipal utilities, and the vulnerability of parts of the country to droughts that are expected to become more frequent due to climate change.

<span class="mw-page-title-main">Water supply in Afghanistan</span>

Water supply in Afghanistan is managed by the National Water Affairs Regulation Authority (NWARA), which is based in Kabul, Afghanistan. The nation's water supply is characterized by a number of achievements and challenges. Among the achievements are:

<span class="mw-page-title-main">Water supply in Sierra Leone</span> Water supply and sanitation in Sierra leone

Water supply in Sierra Leone is characterized by limited access to safe drinking water. Despite efforts by the government and numerous non-governmental organizations, access has not much improved since the end of the Sierra Leone Civil War in 2002, stagnating at about 50% and even declining in rural areas. In the capital Freetown, taps often run dry. It is hoped that a new dam in Orugu, for which China committed financing in 2009, will alleviate water scarcity.

Water supply and sanitation in Zimbabwe is defined by many small scale successful programs but also by a general lack of improved water and sanitation systems for the majority of Zimbabwe. According to the World Health Organization in 2012, 80% of Zimbabweans had access to improved, i.e. clean, drinking-water sources, and only 40% of Zimbabweans had access to improved sanitation facilities. Access to improved water supply and sanitation is distinctly less in rural areas. There are many factors which continue to determine the nature, for the foreseeable future, of water supply and sanitation in Zimbabwe. Three major factors are the severely depressed state of the Zimbabwean economy, the willingness of foreign aid organizations to build and finance infrastructure projects, and the political stability of the Zimbabwean state.

References

  1. "The Millennium Development Goals Report 2015" (PDF). United Nations. United Nations.
  2. 1 2 3 4 5 WHO/UNESCO (2010). Progress on Sanitation and Drinking-water: 2010 Update. Geneva: WHO press.JMP 2010 Update
  3. 1 2 "Water in Africa". African Studies Centre Leiden. 2012-03-19. Retrieved 2020-11-26.
  4. Xu, Yongxin; Seward, Paul; Gaye, Cheikh; Lin, Lixiang; Olago, Daniel O. (2019-05-01). "Preface: Groundwater in Sub-Saharan Africa". Hydrogeology Journal. 27 (3): 815–822. Bibcode:2019HydJ...27..815X. doi: 10.1007/s10040-019-01977-2 . ISSN   1435-0157. S2CID   149570011.
  5. MacDonald, A M; Bonsor, H C; Dochartaigh, B É Ó; Taylor, R G (2012-06-01). "Quantitative maps of groundwater resources in Africa". Environmental Research Letters. 7 (2): 024009. Bibcode:2012ERL.....7b4009M. doi: 10.1088/1748-9326/7/2/024009 . ISSN   1748-9326.
  6. "Water In Crisis - Spotlight Africa: Rural and Urban Issues". The Water Project. Retrieved 2020-11-26.
  7. Walsh, Bryan (2013-11-04). "See the world's 10 most polluted places (and learn how they got that way...)". Time. ISSN   0040-781X . Retrieved 2020-11-26.
  8. 1 2 "AR5 Climate Change 2014: Impacts, Adaptation, and Vulnerability — IPCC" . Retrieved 2020-11-25.
  9. Droogers, P.; Immerzeel, W. W.; Terink, W.; Hoogeveen, J.; Bierkens, M. F. P.; van Beek, L. P. H.; Debele, B. (2012-09-03). "Water resources trends in Middle East and North Africa towards 2050". Hydrology and Earth System Sciences. 16 (9): 3101–3114. Bibcode:2012HESS...16.3101D. doi: 10.5194/hess-16-3101-2012 . hdl: 10986/23175 . ISSN   1027-5606.
  10. Kusangaya, Samuel; Warburton, Michele L.; Archer van Garderen, Emma; Jewitt, Graham P. W. (2014-01-01). "Impacts of climate change on water resources in southern Africa: A review". Physics and Chemistry of the Earth, Parts A/B/C. 67–69: 47–54. Bibcode:2014PCE....67...47K. doi:10.1016/j.pce.2013.09.014. ISSN   1474-7065.
  11. "A Review of Climate Change Impacts on Water Resources in East Africa". Transactions of the ASABE. 58 (6): 1493–1507. 2015-12-30. doi:10.13031/trans.58.10907.
  12. "Understanding future river flows in Lake Victoria Basin". Future Climate For Africa. Retrieved 2020-11-25.
  13. Rural societies in the face of climatic and environmental changes in West Africa. Marseille: IRD éditions. 2017. ISBN   978-2-7099-2424-5. OCLC   1034784045. Impr. Jouve.
  14. 1 2 Collins, Jennifer M. (18 March 2011). "Temperature Variability over Africa". Journal of Climate. 24 (14): 3649–3666. Bibcode:2011JCli...24.3649C. doi: 10.1175/2011JCLI3753.1 . ISSN   0894-8755. S2CID   129446962.
  15. Niang, I.; O. C. Ruppel; M. A. Abdrabo; A. Essel; C. Lennard; J. Padgham, and P. Urquhart, 2014: Africa. In: Climate Change 2014: Impacts, Adaptation, and Vulnerability. Part B: Regional Aspects. Contribution of Working Group II to the Fifth Assessment Report of the Intergovernmental Panel on Climate Change [Barros, V. R.; C. B. Field; D. J. Dokken et al. (eds.)]. Cambridge University Press, Cambridge, United Kingdom and New York, NY, USA, pp. 1199–1265. https://www.ipcc.ch/site/assets/uploads/2018/02/WGIIAR5-Chap22_FINAL.pdf
  16. Conway, Declan; Persechino, Aurelie; Ardoin-Bardin, Sandra; Hamandawana, Hamisai; Dieulin, Claudine; Mahé, Gil (1 February 2009). "Rainfall and Water Resources Variability in Sub-Saharan Africa during the Twentieth Century". Journal of Hydrometeorology. 10 (1): 41–59. Bibcode:2009JHyMe..10...41C. doi: 10.1175/2008JHM1004.1 . ISSN   1525-755X.
  17. 1 2 Armstrong, Andrew; Dyer, Ellen; Koehler, Johanna; Hope, Rob (2022). "Intra-seasonal rainfall and piped water revenue variability in rural Africa". Global Environmental Change. 76: 102592. doi: 10.1016/j.gloenvcha.2022.102592 . CC-BY icon.svg Text was copied from this source, which is available under a Creative Commons Attribution 4.0 International License
  18. 1 2 Kendon, Elizabeth J.; Stratton, Rachel A.; Tucker, Simon; Marsham, John H.; Berthou, Ségolène; Rowell, David P.; Senior, Catherine A. (2019). "Enhanced future changes in wet and dry extremes over Africa at convection-permitting scale". Nature Communications. 10 (1): 1794. Bibcode:2019NatCo..10.1794K. doi:10.1038/s41467-019-09776-9. ISSN   2041-1723. PMC   6478940 . PMID   31015416.
  19. "More Extreme Weather in Africa's Future, Study Says | The Weather Channel – Articles from The Weather Channel | weather.com". The Weather Channel. Retrieved 2022-07-01.
  20. UN-WATER (2009) The United Nations World Water Development Report 3: Water in a Changing World. Paris: UNESCO Publishing.WWR 2009
  21. 1 2 3 Roche, Rachel; Bain, Robert; Cumming, Oliver (9 February 2017). "A long way to go – Estimates of combined water, sanitation and hygiene coverage for 25 sub-Saharan African countries". PLOS ONE. 12 (2): e0171783. Bibcode:2017PLoSO..1271783R. doi: 10.1371/journal.pone.0171783 . ISSN   1932-6203. PMC   5300760 . PMID   28182796. CC-BY icon.svg Text was copied from this source, which is available under a Creative Commons Attribution 4.0 International License.
  22. 1 2 Grasham, Catherine Fallon; Hoque, Sonia Ferdous; Korzenevica, Marina; Fuente, David; Goyol, Kitka; Verstraete, Lavuun; Mueze, Kibrom; Tsadik, Mache; Zeleke, Gete; Charles, Katrina Jane (2022). "Equitable urban water security: beyond connections on premises". Environmental Research: Infrastructure and Sustainability. 2 (4): 045011. doi: 10.1088/2634-4505/ac9c8d . ISSN   2634-4505. CC-BY icon.svg Text was copied from this source, which is available under a Creative Commons Attribution 4.0 International License
  23. Progress on household drinking water, sanitation and hygiene 2000–2022: special focus on gender. New York: United Nations Children’s Fund (UNICEF) and World Health Organization (WHO), 2023
  24. 1 2 Hope, R., Katuva, J., Nyaga, C., Koehler, J., Charles, K., Nowicki, S., Dyer, E., Olago, D., Tanui, F., Trevett, A., Thomas, M., and Gladstone, N. (2021). Delivering safely-managed water to schools in Kenya. REACH Working Paper 8, University of Oxford, UK. ISBN 978-1-874370-82-6
  25. "Improved water source (% of population with access)". data.worldbank.org. Retrieved 20 May 2016.
  26. Hope, Rob; Thomson, Patrick; Koehler, Johanna; Foster, Tim (2020). "Rethinking the economics of rural water in Africa". Oxford Review of Economic Policy. 36 (1): 171–190. doi: 10.1093/oxrep/grz036 . hdl: 10453/142771 . ISSN   0266-903X. CC-BY icon.svg Text was copied from this source, which is available under a Creative Commons Attribution 4.0 International License
  27. 1 2 3 4 5 Africa Infrastructure Country Diagnostic (AICD) (2008). Ebbing Water, Surging Deficits: Urban Water Supply in Sub-Saharan Africa. AICD Background Paper 12. Washington: World Bank. AICD Background Paper 12
  28. 1 2 3 4 5 6 Africa Infrastructure Country Diagnostic (AICD) (2010). Africa’s Infrastructure: a Time for Transformation. Washington: World Bank. Flagship report
  29. "Water infrastructure bring the 'comfort of a running tap' to 1 mln in Senegal". European Investment Bank. Retrieved 2023-02-28.
  30. Magoum, Inès (2022-03-29). "SENEGAL: EU and EIB pledge €70m to improve access to drinking water". Afrik 21. Retrieved 2023-02-28.
  31. "Senegal - Green Economy | Team Europe Initiative and Joint Programming tracker". europa.eu. Retrieved 2023-02-28.
  32. "Water infrastructure bring the 'comfort of a running tap' to 1 mln in Senegal". European Investment Bank. Retrieved 2023-02-28.
  33. Magoum, Inès (2022-03-29). "SENEGAL: EU and EIB pledge €70m to improve access to drinking water". Afrik 21. Retrieved 2023-02-28.
  34. "Senegal - Green Economy | Team Europe Initiative and Joint Programming tracker". europa.eu. Retrieved 2023-02-28.
  35. The World Bank, November 2010 "Private Operators and Rural Water Supplies : A Desk Review of Experience" . Retrieved 2011-10-24.
  36. Rural Water Supply Network. "Rural Water Supply Network Self-supply site". www.rural-water-supply.net/en/self-supply. Retrieved 2017-03-19.
  37. Olschewski, Andre (2016), Supported Self-supply – learning from 15 years of experiences (PDF), 7th RWSN Forum “Water for Everyone”, 7ème Forum RWSN « L’eau pour tous », 29 Nov - 02 Dec 2016, Abidjan, Côte d’Ivoire
  38. 1 2 Armstrong, Andrew; Dyer, Ellen; Koehler, Johanna; Hope, Rob (2022). "Intra-seasonal rainfall and piped water revenue variability in rural Africa". Global Environmental Change. 76: 102592. doi: 10.1016/j.gloenvcha.2022.102592 . CC-BY icon.svg Text was copied from this source, which is available under a Creative Commons Attribution 4.0 International License
  39. 1 2 3 4 5 Ferdous Hoque, Sonia (2021). "Socio-spatial and seasonal dynamics of small, private water service providers in Khulna district, Bangladesh". International Journal of Water Resources Development. 39 (1): 89–112. doi: 10.1080/07900627.2021.1951179 . ISSN   0790-0627.
  40. Nowicki, Saskia; Birhanu, Behailu; Tanui, Florence; Sule, May N.; Charles, Katrina; Olago, Daniel; Kebede, Seifu (2023). "Water chemistry poses health risks as reliance on groundwater increases: A systematic review of hydrogeochemistry research from Ethiopia and Kenya". Science of the Total Environment. 904: 166929. Bibcode:2023ScTEn.904p6929N. doi: 10.1016/j.scitotenv.2023.166929 . PMID   37689199. CC-BY icon.svg Text was copied from this source, which is available under a Creative Commons Attribution 4.0 International License
  41. Africa Infrastructure Country Diagnostic (AICD) (2009). Provision of water to the poor in Africa. Experience with water standposts and the informal water sector. Working Paper 13. Washington: World Bank. AICD Working Paper 13
  42. Africa Infrastructure Country Diagnostic (AICD) (2008). Cost Recovery, Equity, and Efficiency in Water Tariffs: Evidence from African Utilities. AICD Working Paper 7. Washington: World Bank. AICD Working Paper 7
  43. 1 2 World Bank WSS survey database.
  44. Sudeshnha Ghosh Banerjee and Elvira Morella:Africa's Water and Sanitation Infrastructure. Access, Affordability, and Alternatives, World Bank, 2011, Appendix 3, Table A3.2 Distribution Infrastructure, p. 332-334
  45. African Development Bank (2010). Financing Water & Sanitation Infrastructure for Economic Growth and Development. Technical Summary: Proceedings and Outcomes of the Sessions During the 2nd African Water Week, 9–11 November 2009, Johannesburg, South Africa. Tunis: African Development Bank. Technical summary
  46. Meike van Ginneken; Ulrik Netterstrom; Anthony Bennett (December 2011). "More, Better, or Different Spending? Trends in Public Expenditure Reviews for Water and Sanitation in Sub-Sahara Africa". World Bank. pp. xi–xii. Retrieved 30 March 2012.
  47. Sudeshnha Ghosh Banerjee and Elvira Morella:Africa's Water and Sanitation Infrastructure. Access, Affordability, and Alternatives, World Bank, 2011, p. 217-219
  48. Sudeshnha Ghosh Banerjee and Elvira Morella:Africa's Water and Sanitation Infrastructure. Access, Affordability, and Alternatives, World Bank, 2011, Appendix 6, calculated from Table A6.3 Existing Financial Flows to Water and Sanitation Sectors, p. 376-377
  49. Meike van Ginneken; Ulrik Netterstrom; Anthony Bennett (December 2011). "More, Better, or Different Spending? Trends in Public Expenditure Reviews for Water and Sanitation in Sub-Sahara Africa". World Bank. p. 14. Retrieved 30 March 2012.
  50. "2050 Paris, potentially the Largest Clean Water Project owner. - 2050 Paris |". 2023-12-17. Retrieved 2024-01-05.