1936 North American cold wave

Last updated

The 1936 North American cold wave ranks among the most intense cold waves in the recorded history of North America. The Midwestern United States and the Canadian Prairies were hit the hardest. Only the Southwestern United States and California largely escaped its effects. The cold wave was related to a highly negative North Atlantic Oscillation event during that winter driving cold Arctic air into most of North America. [1]

Contents

February 1936 was the coldest February on record in the contiguous U.S., narrowly eclipsing February 1899. [2] It also was the coldest month ever in Nebraska, North Dakota, and South Dakota.

The meteorological winter (December through February) of 1935/36 was the coldest on record for Iowa, [3] Minnesota, [4] North Dakota, [5] and South Dakota. [6]

This winter was much colder than the immediately preceding winters. 1930 through 1934 had each seen exceptionally mild winters in substantial parts of the United States: 1930/31 in the northern Great Plains; 1931/32 in the mid- and south-Atlantic states, the eastern north central states, and the eastern south central states; 1932/33 in New England, and 1933/34 in the Mountain and Pacific states. [7] In the northern plains, the Februaries of 1925, 1926, 1927, 1930, 1931, and 1935 are among the 25 warmest Februaries between 1895 and 2017, although 1929 had the third-coldest February of all-time. [8]

Despite a mild March over most areas east of the Rocky Mountains, the six months from October 1935 to March 1936 were the fifth-coldest on record over the contiguous U.S. [9]

November and December 1935

Winter 1935 (December 1935 - February 1936) Precipitation, in inches. Record wettest and driest is based on a 112 yr period of records, 1895-2006. Winter 1936 US Precipitation.gif
Winter 1935 (December 1935 – February 1936) Precipitation, in inches. Record wettest and driest is based on a 112 yr period of records, 1895–2006.

The 1935/36 cold wave began in the plains states in November, when temperatures were well below normal in many areas west of the Mississippi River. November 1935 was one of the coldest Novembers on record for Idaho (fourth coldest), [10] Oregon (sixth coldest), [11] Washington (seventh coldest), [12] and North Dakota (seventh coldest). [13]

During December, cold weather spread to the eastern half of the U.S., where most places were much below average. Florida, Georgia, and South Carolina had their second-coldest Decembers of all-time, with Florida averaging 50.8 °F (10.4 °C), [14] Georgia 39.3 °F (4.1 °C), [15] and South Carolina 37.5 °F (3.1 °C). [16] British Columbia [17] and Montana [18] were however significantly warmer than average.

January 1936

The month began with a mild spell in the eastern states, but by the nineteenth a large blizzard-like storm covered the eastern half of the country, and would cause two deaths in New Jersey [19] and two in the Catskill Mountains. [20] The storm produced heavy snow and blocked most roads in the Appalachian Mountains. [21] Snow was a contributing factor to several highway accidents that killed up to 100 people. [21]

The cold continued during the following weeks. The sea froze partially as far south as Chesapeake Bay. [22] From January 25 to 28, the Mid-Atlantic had its coldest January temperatures in eighteen years, with Washington, D. C. averaging 14 °F or −10 °C [23] High winds in some locations caused wind chills below −85 °F or −65 °C. In Ohio and the Centralia district of Illinois, [24] the cold destroyed the peach crop, whilst defective heaters caused numerous dangerous fires in Minnesota. [23]

North Dakota had its fifth-coldest January of all-time with an average temperature of −6.9 °F (−21.6 °C). [25]

February 1936

February 1936 US Temperature, in degrees Fahrenheit. Record warmest and coldest is based on a 112 yr period of records, 1895-2006. February 1936 US Temperature.gif
February 1936 US Temperature, in degrees Fahrenheit. Record warmest and coldest is based on a 112 yr period of records, 1895–2006.

February was by far the coldest month of this severe winter. Nebraska, North Dakota, and South Dakota experienced their coldest month on record. Two states recorded their coldest temperatures on record: McIntosh, South Dakota sank to −58 °F or −50 °C, and Parshall, North Dakota hit −60 °F or −51.1 °C. [26] [27] At Devil's Lake, North Dakota, the average temperature for five weeks ending in February was −21 °F (−29.4 °C). [28]

Skis had to be used in rescue operations as a succession of snowstorms hit the Pacific Northwest states and much of the nation east of the Continental Divide. [29] By the middle of the month, all schools in the Midwest, Great Plains, and Pacific Northwest were closed by deep snowdrifts. Health care was affected by a shortage of serum. Many remote South Dakota towns did not have outside contact for several weeks, [30] At the peak of the cold wave, only two days of supplies were in inventory at many stores in the plains states. [31] As far south as Richmond, Virginia, rivers were completely ice-bound. [24] Subsequent thaws accompanied by heavy rain over the southern states led to flooding. [29]

In Canada away from the Atlantic Ocean, temperatures averaged as much as 30 °F (17 °C) below normal. [32] At the Saskatoon airport, the temperature did not rise above 0 °F (−17.8 °C) from February 2 through February 20. [33] A temperature of −63 °F (−52.8 °C) was reached in Sceptre, Saskatchewan. [31]

March 1936

In the final week of February, a thaw finally came to the nation. Temperatures rose above freezing for the first time in many weeks. Fargo, North Dakota reached 32 °F or 0 °C on March 1 for the first time since December 14, 1935. The warming led, however, to avalanches in the Pacific Northwest, where three people were killed on Snoqualmie Pass on February 24. [34]

Above average to near average temperatures were recorded throughout the U.S. in March, except for the Pacific Northwest. The melting of the heavy winter snowfalls and thawing of the ground, along with the wettest March on record in the northeastern states [35] led to record floods in most of the region's rivers, especially on smaller tributary streams. [36]

See also

Related Research Articles

<span class="mw-page-title-main">Belle Fourche, South Dakota</span> City in South Dakota, United States

Belle Fourche is a city in and the county seat of Butte County, South Dakota, United States. Its population was 5,617 at the 2020 census. It is near the geographic center of the United States, which moved some 550 miles northwest from the geographic center of the contiguous United States in Lebanon, Kansas with the admission of Alaska and Hawaii in the mid-20th century.

<span class="mw-page-title-main">Embarrass, Minnesota</span> Unincorporated community in Minnesota, United States

Embarrass is an unincorporated community in Embarrass Township, Saint Louis County, Minnesota, United States.

<span class="mw-page-title-main">Great Blizzard of 1899</span> 1899 blizzard in the United States

The Great Blizzard of 1899, also known as the Great Arctic Outbreak of 1899 and the St. Valentine's Day Blizzard, was an exceptionally severe winter weather event that affected most of the United States, particularly east of the Rocky Mountains. On February 11, Swift Current in present-day Saskatchewan reported a record-high barometric pressure of 31.42 inches of mercury (1,064 mb). While there was heavy snow during this event, the 1899 storm was most noted for the record cold it brought to several areas of the USA, including the first below 0 °F (−17.8 °C) temperature ever recorded in Florida, when the state capital Tallahassee in the extreme northern Panhandle recorded −2 °F or −18.9 °C.

<span class="mw-page-title-main">Climate of Minneapolis–Saint Paul</span>

The climate of Minneapolis–Saint Paul is the long term weather trends and historical events of the Minneapolis–Saint Paul metropolitan area in east central Minnesota. Minneapolis and St. Paul, together known as the Twin Cities, are the core of the 15th largest metropolitan area in the United States. With a population of 3.6 million people, the region contains approximately 60% of the population of Minnesota. Due to its location in the northern and central portion of the U.S., the Twin Cities has the coldest average temperature of any major metropolitan area in the nation. Winters are very cold, summer is warm and humid, snowfall is common in the winter and thunderstorms with heavy rainfall occur during the spring, summer and autumn. Though winter can be cold, the area receives more sunlight hours in mid-winter than many other warmer parts of the country, including all of the Great Lakes states, the Pacific Northwest, parts of the South, and almost all of the Northeast. Unless otherwise indicated, all normals data presented below are based on data at Minneapolis/St. Paul International Airport, the official Twin Cities climatology station, from the 1981−2010 normals period.

A cold wave is a weather phenomenon that is distinguished by a cooling of the air. Specifically, as used by the U.S. National Weather Service, a cold wave is a rapid fall in temperature within a 24-hour period requiring substantially increased protection to agriculture, industry, commerce, and social activities. The precise criteria for a cold wave are the rate at which the temperature falls, and the minimum to which it falls. This minimum temperature is dependent on the geographical region and time of year.

The cold wave of 1978 was a weather event that occurred in the Eastern United States. Beginning in December 1977 and lasting until March, it produced one of the coldest winters on record in all states east of the Rocky Mountains, except Maine.

<span class="mw-page-title-main">Climate of Minnesota</span> Climatic conditions of Minnesota, US

Minnesota has a humid continental climate, with hot summers and cold winters. Minnesota's location in the Upper Midwest allows it to experience some of the widest variety of weather in the United States, with each of the four seasons having its own distinct characteristics. The area near Lake Superior in the Minnesota Arrowhead region experiences weather unique from the rest of the state. The moderating effect of Lake Superior keeps the surrounding area relatively cooler in the summer and warmer in the winter, giving that region a smaller yearly temperature variation. On the Köppen climate classification, much of the southern third of Minnesota—roughly from the Twin Cities region southward—falls in the hot summer zone (Dfa), and the northern two-thirds of Minnesota falls in the warm summer zone (Dfb).

Delhi features a dry winter humid subtropical climate bordering a hot semi-arid climate, with high variation between summer and winter temperatures and precipitation. Delhi's version of a humid subtropical climate is markedly different from many other humid subtropical cities such as São Paulo, Houston, and Brisbane in that the city features dust storms and wildfire haze due to its semi-arid climate.

The 1912 United States cold wave was one of the coldest periods since 1870 in the Northern United States, according to the U.S. National Weather Service. The cold wave started in November 1911 and finally ended in March 1912, with periodic interruptions by milder temperatures.

<span class="mw-page-title-main">Climate of North Dakota</span>

North Dakota's climate is typical of a continental climate with cold winters and warm-hot summers. The state's location in the Upper Midwest allows it to experience some of the widest variety of weather in the United States, and each of the four seasons has its own distinct characteristics. The eastern half of the state has a humid continental climate with warm to hot, somewhat humid summers and cold, windy winters, while the western half has a semi-arid climate with less precipitation and less humidity but similar temperature profiles. The areas east of the Missouri River get slightly colder winters, while those west of the stream get higher summer daytime temperatures. In general, the diurnal temperature difference is prone to be more significant in the west due to higher elevation and less humidity.

<span class="mw-page-title-main">1994 North American cold wave</span> Weather event

The 1994 North American cold wave occurred over the midwestern and eastern regions of the United States and southern Canada in January 1994. The cold wave caused over 100 deaths in the United States. Two notable cold air events took place from January 18–19 and January 21–22. There were 67 minimum temperature records set on January 19. During this time, much of the United States experienced its coldest temperatures since a major storm on February 20, 1934.

<span class="mw-page-title-main">January–March 2014 North American cold wave</span> Extreme weather event affecting parts of Canada and the United States

The January–March 2014 North American cold wave was an extreme weather event that extended through the late winter months of the 2013–2014 winter season, and was also part of an unusually cold winter affecting parts of Canada and parts of the north-central and northeastern United States. The event occurred in early 2014 and was caused by a southward shift of the North Polar Vortex. Record-low temperatures also extended well into March.

<span class="mw-page-title-main">2013–14 North American winter</span>

The 2013–14 North American winter was one of the most significant for the United States, due in part to the breakdown of the polar vortex in November 2013, which allowed very cold air to travel down into the United States, leading to an extended period of very cold temperatures. The pattern continued mostly uninterrupted throughout the winter and numerous significant winter storms affected the Eastern United States, with the most notable one being a powerful winter storm that dumped ice and snow in the Southeastern United States and the Northeastern United States in mid-February. Most of the cold weather abated by the end of March, though a few winter storms did affect the Western United States towards the end of the winter.

<span class="mw-page-title-main">November 2014 North American cold wave</span>

The November 2014 North American cold wave was an extreme weather event that occurred across most of Canada and the contiguous United States, including parts of the Western United States up to western California. One of the first events of the winter, the cold wave was caused by the northward movement of an extremely powerful bomb cyclone associated with Typhoon Nuri's remnant, which shifted the jet stream far northward, creating an omega block pattern. This allowed a piece of the polar vortex to advance southward into the Central and Eastern United States, bringing record-cold temperatures to much of the region. In contrast, Alaska experienced above-average temperatures.

<span class="mw-page-title-main">2014–15 North American winter</span> Winter season in North America

The 2014–15 North American winter was frigid and prolifically wintry, especially across the eastern half of North America in the months of January–March. The season began early, with many places in North America experiencing their first wintry weather during mid-November. A period of below-average temperatures affected much of the contiguous United States, and several records were broken. An early trace of snowfall was recorded in Arkansas. There were greater accumulations of snow across parts of Oklahoma as well. A quasi-permanent phenomenon referred to as the polar vortex may have been partly responsible for the cold weather. Temperatures in much of the United States dropped 15 to 35 °F below average by November 19, following a southward "dip" of the polar vortex into the eastern two-thirds of the country. The effects of this dip were widespread, bringing about temperatures as low as 28 °F (−2 °C) in Pensacola, Florida. Following a significant snowstorm there, Buffalo, New York received several feet of snow from November 17–21. In addition, significant winter weather occurred throughout the season, including a major blizzard that struck the Northeastern United States at the end of January, another blizzard that affected much of the Northern United States days later in early February, and several significant snow events paired with very frigid temperatures for much of February.

<span class="mw-page-title-main">2017–18 North American winter</span> Weather summary

The 2017–18 North American winter saw weather patterns across North America that were very active, erratic, and protracted, especially near the end of the season, resulting in widespread snow and cold across the continent during the winter. Significant events included rare snowfall in the South, an outbreak of frigid temperatures that affected the United States during the final week of 2017 and early weeks of January, and a series of strong nor'easters that affected the Northeastern United States during the month of March. In addition, flooding also took place during the month of February in the Central United States. Finally the winter came to a conclusion with a powerful storm system that caused a tornado outbreak and blizzard in mid-April. The most intense event, however, was an extremely powerful cyclonic blizzard that impacted the Northeastern United States in the first week of 2018. Similar to the previous winter, a La Niña was expected to influence the winter weather across North America.

<span class="mw-page-title-main">December 2017–January 2018 North American cold wave</span>

The December 2017–January 2018 North American cold wave was an extreme weather event in North America in which record low temperatures gripped much of the Central, Eastern United States, and parts of Central and Eastern Canada. Starting in late December as a result of the southward shift of the polar vortex, extremely cold conditions froze the eastern United States in the last few days of 2017 as well as into the new year. Following a brief respite in mid-January, cold temperatures swung back into the eastern U.S. shortly afterwards. The cold wave finally dissolved by around January 19, as near-average temperatures returned.

<span class="mw-page-title-main">February 2021 North American cold wave</span> Cold wave in 2021

The February 2021 North American cold wave was an extreme weather event that brought record low temperatures to a significant portion of Canada, the United States and parts of northern Mexico during the first two-thirds of February 2021. The cold was caused by a southern migration of the polar vortex, likely caused by a sudden stratospheric warming event that occurred the prior month. Temperatures fell as much as 25–50 °F below average as far south as the Gulf Coast. Severe winter storms also were associated with the bitter cold, which allowed for heavy snowfall and ice accumulations to places as far south as Houston, Texas, and contributing to one of the snowiest winters ever in some areas in the Deep South.

<span class="mw-page-title-main">2021–22 North American winter</span> Winter season in North America

The 2021–22 North American winter was not as significant and record-breaking as the previous winter season. Despite this, several notable and significant events still occurred, including two separate record-breaking tornado outbreaks in mid-December, a significant winter storm in the South in mid-January, a powerful blizzard that impacted the Northeast coast at the end of January and a wide-ranging, significant winter storm that affected most of the eastern half of the country in early February. Additional significant events included a late-season winter storm in March that affected the Appalachian Mountains, and a major blizzard that affected North and South Dakota in mid-April. Additionally, a very late out-of-season snowstorm struck the Rocky Mountains in late May. During the season, four storms have been ranked on the Regional Snowfall Index (RSI), although none attained the “Major” category. Similar to the previous winter, a developing La Niña was expected to influence weather patterns across the continent.

<span class="mw-page-title-main">2022–23 North American winter</span> Winter season in North America

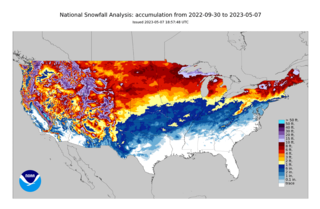
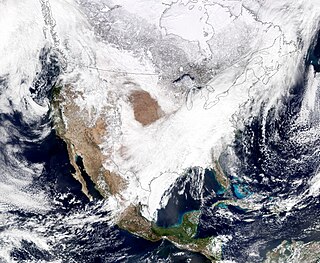
The 2022–23 North American winter was an unusually warm winter for the east and an unusually cold winter for the west in North America, as it occurred across the continent from late 2022 to early 2023. The winter season in North America began at the winter solstice, which occurred on December 21, 2022, and it ended at the March equinox, which occurred on March 20, 2023. The first day of meteorological winter began on December 1 and unofficially ended on February 28; winter storms may still occur outside of these limits.

References

  1. See Ballesteros-Cánovas, Juan Antonio; Stoffel, Markus; Benito, Gerardo; Rohrer, Mario; Barriopedro, David; García-Herrera, Ricardo; Beniston, Martin; Brönnimann, Stefan (July 2, 2018). "On the extraordinary winter flood episode over the North Atlantic Basin in 1936". Annals of the New York Academy of Sciences.
  2. "Contiguous U.S., Average Temperature, February". National Centers for Environmental Information. Retrieved January 27, 2018.
  3. "Iowa Average Temperature Rankings, February 1936". National Centers for Environmental Information. Retrieved May 2, 2021.
  4. "Minnesota Average Temperature Rankings, February 1936". National Centers for Environmental Information. Retrieved May 2, 2021.
  5. "North Dakota Average Temperature Rankings, February 1936". National Centers for Environmental Information. Retrieved May 2, 2021.
  6. "South Dakota Average Temperature Rankings, February 1936". National Centers for Environmental Information. Archived from the original on April 9, 2021. Retrieved January 27, 2018.
  7. Henry F. Diaz; Robert G. Quayle (October 1978). "The 1976–77 Winter in the Contiguous United States in Comparison with Past Records". Monthly Weather Review . 106 (10): 1402–6. Bibcode:1978MWRv..106.1393D. doi: 10.1175/1520-0493(1978)106<1393:TWITCU>2.0.CO;2 .
  8. "February, Average temperature, Central NWS Region". National Centers for Environmental Information. Retrieved January 26, 2018.
  9. "October–March, Average Temperature, Contiguous U.S., All 48 States". National Centers for Environmental Information. Retrieved January 26, 2018.
  10. "Climatological Rankings, November 1935, Average Temperature, Idaho". National Centers for Environmental Information. Retrieved May 2, 2021.
  11. "Climatological Rankings, November 1935, Average Temperature, Oregon". National Centers for Environmental Information. Retrieved May 2, 2021.
  12. "Climatological Rankings, November 1935, Average Temperature, Washington". National Centers for Environmental Information. Retrieved May 2, 2021.
  13. "Climatological Rankings, November 1935, Average Temperature, North Dakota". National Centers for Environmental Information. Retrieved May 2, 2021.
  14. "Climatological Rankings, December 1935, Average Temperature, Florida". National Centers for Environmental Information. Retrieved May 2, 2021.
  15. "Climatological Rankings, December 1935, Average Temperature, Georgia". National Centers for Environmental Information. Retrieved May 2, 2021.
  16. "Climatological Rankings, December 1935, Average Temperature, South Carolina". National Centers for Environmental Information. Retrieved May 2, 2021.
  17. "December Set New Weather Mark for City: Was Warmest in History — Rain More Plentiful during 1935". The Province . January 2, 1936. p. 1.
  18. "Climatological Rankings, December 1935, Average Temperature, Montana". National Centers for Environmental Information. Retrieved May 2, 2021.
  19. "Blizzard-like Storm Causes Two Deaths". The Morning Call . January 20, 1936. pp. 1, 16.
  20. "Storm wreaks Havoc in State". Poughkeespie Eagle-News. January 20, 1936. pp. 1, 2.
  21. 1 2 John P. Gallagher (January 19, 1936). "Frigid Grip of Winter Holds Most of Nation". Los Angeles Times . pp. 1, 5.
  22. "Ocean Ships Marooned by 10-Inch Ice: Chesapeake Bay Frozen from Shore to Shore; Baltimore Cut Off — Below Zero for North Carolina: Midwest Miners Give Up Holiday and Dig Coal To Avert Famine". The Miami Herald . Associated Press. February 2, 1936. p. 1.
  23. 1 2 "14˚ Average for 4 Days is Unequalled since 1917–18 Winter: 15 Deaths Brings U.S. Total to 250 – Devils' Lake with −27˚ Has Coldest Temperature". The Washington Post . January 28, 1936. p. 1.
  24. 1 2 "Potomac Ice-Bound for First Time in 18 Years; Warmer Forecast". The Washington Post . February 1, 1936. p. 1.
  25. "Climatological Rankings, January 1936, Average Temperature, North Dakota". National Centers for Environmental Information. Retrieved May 2, 2021.
  26. "State Climate Extremes Committee: Records, Minimum Temperature, All States". National Centers for Environmental Information. Retrieved January 26, 2018.
  27. "1936: Coldest winter ever". Minot Daily News . Minot, North Dakota. February 15, 2016. Retrieved January 27, 2018.
  28. J. B. Kincer (February 21, 1936). "Weather Cycle Changing? Present Hard Winter May Be a Foretaste of a Series of Colder and Wetter Years". The New York Times . p. E10. Retrieved January 27, 2018.
  29. 1 2 "Weather Fair as Cold Eases Grip on Capital". The Washington Post . February 6, 1936. pp. 1, 3.
  30. "Expeditions Rush Aid to Snowbound: Many Midwest Towns Cut Off – Meningitis Adds to Danger; Planes to Fly Supplies to Stricken Sections". Los Angeles Times . February 14, 1936. pp. 1, 3.
  31. 1 2 "Record Cold Continues in West: 63 Below at Sceptre, Sask". The Montreal Gazette . February 17, 1936. p. 1.
  32. "February's Cold Breaks Records: Average Temperature Was 16.5 Degrees Below Zero". Edmonton Journal . March 2, 1936. p. 9.
  33. "Daily Data Report for February 1936: Saskatoon Diefenbaker Int'l A Saskatchewan". Government of Canada. 2011-10-31. Retrieved January 27, 2018.
  34. "At Least 3 Perish in Avalanche: Workers, Menaced by 'Slides, Continue to Dig through Snow – Cars Uncovered: All Vehicles Unoccupied: snow-slip Occurs at Snoqualmie Pass". Saskatoon Star-Phoenix . February 24, 1936. p. 2.
  35. "Northeast Precipitation, March". National Oceanic and Atmospheric Administration .
  36. Talman, C. F. (March 15, 1936). "Hard Winter Brings New Burst of Floods: Rush of Water Over Frozen Ground Causes in the East a Costly Disaster Yet Unlike Overflows of Spring". The New York Times. p. E12. Retrieved July 31, 2019.