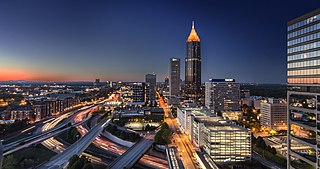
Atlanta is the capital and largest city in the state of Georgia. Atlanta ranks as the 38th-largest in the United States, and the eighth-largest city in the southeastern region. 2020 census results varied dramatically with previous Census Bureau estimates, counting 498,715 residents. Atlanta is the core city of the eighth most populous United States metropolitan area at 6,104,803 (est. 2020), with a combined statistical area of 6,930,423.[1][2] For the first time since the 1960 Census, the 2020 Census revealed Atlanta is no longer majority African American. Atlanta has strongly increased in diversity in recent decades and is projected to continue.[3][4]
Atlanta's population grew steadily during the first 100 years of the city's existence, and peaked in 1970 at around 496,000. However, from 1970 to 2000, the city lost over 100,000 residents, a decrease of around 16 percent. During the same time, the metro area gained over three million people, cutting the city's share of the metro population in half, from over 25 percent in 1970 to around 12 percent in 2000.[5] However, the city's population bottomed out in 1990 at around 394,000, and it has been increasing every year since then, reaching 420,003 residents in 2010. The population count increased more in the 2020 census to 498,715, surpassing the 1970 population.[6]
*Estimates[9][10] Region: Combined Statistical Area (CSA)
Race and ethnicity
Atlanta city, Georgia – Racial and ethnic composition Note: the US Census treats Hispanic/Latino as an ethnic category. This table excludes Latinos from the racial categories and assigns them to a separate category. Hispanics/Latinos may be of any race.
Once the nation's 4th largest black-majority city, Atlanta fell below 50% non-Hispanic African American in the 2020 census. The non-Hispanic African-American population has the largest percentage decline in the city since the 2000 census. [14] The strongest growth of African Americans in the Atlanta area is now in the surrounding suburbs.[15]
The non-Hispanic white alone population of the city of Atlanta has grown significantly since 2000. Between 2000 and 2020, Atlanta's non-Hispanic white population had increased by 61,296 people while the Black population declined by 21,044. The non-Hispanic white percentage increased from 31.3% in 2000, to 36.3% in 2010, to 38.5% in 2020. Since 2000, Atlanta demographics have drastically changed due to an influx of whites into gentrifying intown neighborhoods, such as East Atlanta and the Old Fourth Ward, coupled with a stronger movement of Blacks into surrounding suburbs, especially in Clayton County and DeKalb County,[16][17][18] an influx of Asians and Hispanics moving into the city, combined with increased identification as mixed race and more children born in interracial marriages.
The city of Atlanta is becoming more diverse in the 21st century. The city long consisted overwhelmingly of non-Hispanic Blacks and non-Hispanic Whites; those groups made up 92.1% of the city in 1990, but by 2020 their proportion had shrunk to 85.3%. Atlanta's Hispanic population increased 11,268 from 2000 to 2020, and in 2020 the city was 6.0% Hispanic. The Asian American population increased by 14,259 and in 2020 Asian Americans made up 4.5% of the city.
Income
In 2022, the median income for a household in Atlanta was $77,655. Also in 2022, 17.7% of the population lived below the poverty line which is down from 21.8% in 2010.[19] Since 2000, poverty in most of Atlanta's suburbs is growing faster than in the city.[20]
Race and ethnicity by neighborhood
This article needs to be updated. Please help update this article to reflect recent events or newly available information.(May 2024)
In NPU W (East Atlanta, Grant Park, Ormewood Park, Benteen Park), the black population went from 57.6% to 38.0%, and the white proportion rose from 36.5% to 54.8%
In NPU O (Edgewood, Kirkwood, East Lake area), the black population went from 86.2% to 58.7%, and the white proportion rose from 11.3% to 36.9%.
In NPU L (English Avenue, Vine City), the black proportion of the population went down from 97.5% to 89.1%, while the white proportion rose from 1.3% to 6.1%. Note that there many infill residential units were added in the King Plow Arts Center area, which falls under English Avenue but which in character is an extension of the Marietta Street Artery and West Midtown.
In NPU D, stretching from West Midtown along the border of Buckhead and northwestern Atlanta, westward towards the river, the white proportion rose from 49.3% to 59.2% with the black proportion dropping from 36.5% to 23.9%
Increasing black population:
In NPU X (Metropolitan Parkway corridor), the black proportion of the population rose from 59.5% to 83.2%, while the White, Asian and Hispanic proportion dropped about three percentage points each.
NPU B (central Buckhead) became more diverse, with the white proportion dropping from 82.8% to 75.5%, the black proportion rising from 5.9% to 12.3%, and the Asian proportion from 3.1% to 5.3%
Sexual orientation and marital status
The city of Atlanta has one of the highest LGBT populations per capita in the nation. It ranked third of all major cities, behind San Francisco and slightly behind Seattle, with 12.8% of the city's total population recognizing themselves as gay, lesbian, or bisexual.[47][48] Also, Atlanta is home to two highly attended and notable LGBT events, Atlanta Pride and Atlanta Black Pride.[49]
According to a 2024 Chamber of Commerce report, Atlanta is fourth in the nation for single-person households (44.5%). Within the past 10 years, the number of people living alone has increased by almost 5 million. Nearly half of those single-person households manifested during the pandemic. Compared to pre-pandemic (2019) rates, 2.4 million more people are living alone in 2024. Atlanta ranked 3rd in the nation for the most women living alone (29%) and 10th for men (24%).[50]
Born out-of-state and foreign-born
In the city of Atlanta, Ga. 53% of residents were born in Georgia, 19.1% elsewhere in the South, 18.6% outside the South and 8.0% in a foreign country. Although the foreign-born population in the city itself is low among large US cities and even compared to Atlanta's own metro area, it is high compared to other nearby Southern cities. For example, in Macon, Georgia, 7.1% were US-born outside the South and 3.0% foreign-born, and in Birmingham, Alabama only 7.7% were US-born outside the South and 3.2% foreign-born.[51]
Daytime population
According to a 2000 daytime population estimate by the Census Bureau,[52] over 250,000 more people commuted to Atlanta on any given workday, boosting the city's estimated daytime population to 676,431. This is an increase of 62.4% over Atlanta's resident population, making it the largest gain in daytime population in the country among cities with fewer than 500,000 residents.
Timeline
1850 - 2,572
City limits a circle with radius of 1 mile (3.14mi2)
1860 - 9,554
1866 city limits enlarged to a radius of 1.5 miles (7mi2) [53]
1870 - 21,789
1880 - 37,409
had eclipsed Savannah to become Georgia's largest city
1889 city limits enlarged to a radius of 1.75 miles, Inman Park also annexed.[54] (9.6mi2)
1890 - 65,533
1894 annexation of West End (adding 1.0mi2 for a total of 11mi2)[55]
1900 - 89,872, including 2500 persons of foreign birth and 35,900 of African descent.
Atlanta's changing demographics have had effects on its political system. In the 2009 mayoral race, Mary Norwood lost by just 714 votes (out of over 84,000 cast) to Kasim Reed. Norwood, who is white, would have become the city's first non-black mayor since 1974. This comes amid the fact that in recent years, an influx of whites, Asians and Hispanics into Atlanta has shifted the demographics in what was once a city guaranteed to elect a black mayor. In fact, the percentage of blacks dropped to 54 percent in 2010 from 61 percent in 2000. This demographic change and its possible historic effect on Atlanta's city government was a factor that, among others, helped draw supporters of both candidates to the polls.[60]
Projections
Atlanta is projected to have a population of around 590,000 people by 2030. However, this projection assumes Atlanta garners only seven percent of the metro's growth during that period. If the city were to capture ten percent of metro Atlanta's growth, it would reach a population of 660,000 people by 2030.[5] Also Atlanta is expected to become much more diverse. For many decades Atlanta was largely made up of Blacks and Whites. However, Hispanics and Asians are expected to make up a more notable percentage of the total population by 2050.[61]
The Metro Atlanta as a whole is also growing more diverse in which non-Hispanic blacks and non-Hispanic whites make up only 76.9% of the population.[64] The metro area's Hispanic population more than doubled from 268,851 in 2000 to 730,470 in 2020, and now makes up 12.0% of the region's population while Blacks have declined to 33.2%.[64] These immigrant communities have altered the economic, cultural, and religious landscape of metro Atlanta.[65] The Asian American population in the metro makes up 6.5% of the region's population per the 2020 census.[64]Gwinnett County has become one of the most diverse counties in the nation.[66]
A Atlanta MSA in 2000 did not include Butts, Dawson, Haralson, Heard, Jasper, Lamar, Meriwether, and Pike counties, whose population totalled in 2000: 135,783; in 2010: 156,368 (2.96% of total new 28-county metro)[67] B Compares the larger 28-county Atlanta-Sandy Springs-Marietta MSA 2010 with a smaller 20-county Atlanta MSA 2000; however the 8 new counties represent less than 3% of the larger 28-county metro. Source: for race and Hispanic population, U.S. Census Bureau 2010 and 2000 census; for foreign-born population: US Census Bureau 2010 and 2000 American Community Surveys; Immigrants in 2010 Metropolitan America, Brookings Institution
Race and ethnicity
The 2010 census counted 5,268,860 people in the 28-county metropolitan area. This was an increase of 1,020,879 since 2000, the second largest growth of any U.S. metropolitan area behind that of Houston. This represented a proportional increase of 24.0%, again second-highest (after Houston) among the ten largest metropolitan areas of the United States.
White Americans made up 55.4% of metro Atlanta's population, a relative decrease from 63.0% ten years earlier, but still an absolute increase of over 330,000 people. Non-Hispanic whites dropped from 59.5% to 50.7% of the metro's population, increasing by about 224,000 people.
Black Americans are the largest racial minority with 32.4% of the population, up from 28.9% in 2000. The city of Atlanta has long been regarded as a "black mecca" for its role as a center of black education, political power, wealth, and culture. From 2000 to 2010, the geographic disbursement of blacks in Metro Atlanta changed radically. Long concentrated in the city of Atlanta and DeKalb County, the black population there dropped while over half a million African Americans settled across other parts of the metro area, including approximately 112,000 in Gwinnett County, 71,000 in Fulton outside Atlanta, 58,000 in Cobb, 50,000 in Clayton, 34,000 in Douglas, and 27,000 each in Newton and Rockdale Counties.[68]
Year
Black pop. in City of Atlanta
Black pop. in DeKalb County
Total black pop. Atlanta + DeKalb
Total black pop. Metro Atlanta
Proportion of black pop. in Atlanta + DeKalb
2000
255,689
361,111
616,800
1,189,179
51.9%
2010
226,894
375,697
602,591
1,707,913
35.2%
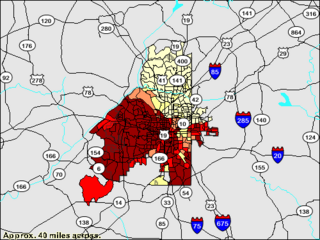
Hispanic Americans are the fastest growing ethnic group. At 10.4% of the metro's population in 2010, versus only 6.5% in 2000, the metro's Hispanic population increased an astounding 103.6%, or 278,459 people, in ten years. Major Hispanic groups include 314,351 Mexicans, 43,337 Puerto Ricans and 17,648 Cubans. All of those groups' populations increased by over 90% in the ten-year period. Of the metro's 279,000-person increase in the Hispanic population from 2000 to 2010, 98,000 came in Gwinnett County, 37,000 in Cobb, 25,000 in Fulton (all but 3,000 outside the city of Atlanta), 20,000 in Hall, and 15,000 in DeKalb County.[69] The Hispanic population is heavily concentrated in the northeastern section of the Atlanta metropolitan Area.[citation needed]
The Asian American population also increased rapidly from 2000 to 2010. There were 256,956 Asian Americans in the metro area in 2010, making up 4.9% of the population. This represented an 87% increase over 2000. The largest Asian groups are 78,980 Indians, 43,870 Koreans, 37,660 Chinese and 36,554 Vietnamese.
The most common reported ancestries in Atlanta were English, American, German, Irish, Italian, Scottish, African, French, Polish, Russian and Dutch.[71]
Metro Atlanta is increasingly international, with its 716,434 foreign-born residents in 2010, a 69% increase versus 2000. This was the fourth largest rate of growth among the nation's top 100 metros, after Baltimore, Orlando and Las Vegas. The foreign-born proportion of the population went up from 10.3% to 13.6%, and Atlanta moved up from 14th to 12th in ranking of US metro areas with the largest immigrant population by sheer numbers. Still, its 13.6% proportion of immigrants is only the 29th highest of the nation's top 100 metros.[85]
Metro Atlanta's immigrants are more suburban than most other cities'. Out of the top 100 US metros, Atlanta has the 11th highest ratio of the foreign-born living in the suburbs and not in the core city.[85] Atlanta does not have single centers of ethnic groups such as a Koreatown, but rather areas such as the Buford Highway Corridor in DeKalb County and parts of Gwinnett County are commercial centers for multiple ethnic communities.[citation needed]
In 1990 Greater Atlanta had the largest Japanese population in the Southeast United States. The Consulate General of Japan in Atlanta estimated that, during that year, 3,500 to 4,000 Japanese lived in Greater Atlanta. Of the metropolitan areas in the Southeast United States, in 1990 Greater Atlanta had the most extensive education network for Japanese nationals.[86]
8% of the foreign born population in Atlanta is black. Cobb County has the largest Haitian population. Nigerians are concentrated in DeKalb County.
3.2 percent of immigrants in Atlanta were born in Jamaica and are Jamaican.[87]
In the Atlanta-Sandy Springs- Marietta, GA area the African foreign born population came from Nigeria, Ethiopia, Ghana, Kenya, Liberia, South Africa, Somalia, Cameroon Sierra Leone and Togo.[88]
Religion in Atlanta, while historically centered around Protestant Christianity, now involves many faiths as a result of the city and metro area's increasingly international population. While Protestant Christianity still maintains a strong presence in the city (63%),[90][91] in recent decades Catholicism has gained a strong foothold due to migration patterns. Metro Atlanta also has a considerable number of ethnic Christian congregations, including Korean and Indian churches. Large non-Christian faiths are present in the form of Islam, Judaism, and Hinduism. Overall, there are over 1,000 places of worship within Atlanta.[92]
Language
Signs in English, Spanish and Chinese along Buford Highway in Metro Atlanta
In 2008, approximately 83.3% of the population five years and older spoke only English at home, which is roughly 4,125,000 people. Over 436,000 people (8.8%) spoke Spanish at home, making Metro Atlanta the 15th highest number of Spanish speakers among American metropolitan areas (MSAs). Over 193,000 people (3.9%) spoke other Indo-European languages at home. People who speak an Asian language at home numbered over 137,000 and made up 2.8% of the population.[93][94]
Related Research Articles
The United States had an official estimated resident population of 334,914,895 on July 1, 2023, according to the U.S. Census Bureau. This figure includes the 50 states and the Washington, D.C. but excludes the population of five unincorporated U.S. territories as well as several minor island possessions. The United States is the third most populous country in the world, and the most populous in the Americas and the Western Hemisphere. The Census Bureau showed a population increase of 0.4% for the twelve-month period ending in July 2022, below the world average annual rate of 0.9%. The total fertility rate in the United States estimated for 2022 is 1.665 children per woman, which is below the replacement fertility rate of approximately 2.1. By several metrics, including racial and ethnic background, religious affiliation, and percentage of rural and urban divide, Illinois is the most representative of the larger demography of the United States.
Tildenville is a census-designated place (CDP) and an unincorporated area in Orange County, Florida, United States. The population was 511 at the 2010 census, most of them African American. It is part of the Orlando–Kissimmee Metropolitan Statistical Area. Generally speaking, Tildenville is a narrow area alongside Orange County Road 545, south of Florida State Road 50 and north of the Stoneybrook West planned unit development. Residents utilize Winter Garden, Florida for mail delivery. The CDP takes its name from Luther F. Tilden, a prominent pioneer and citrus magnate who greatly contributed to the community. Historically, Tildenville referred to an area larger than the modern CDP. Landmarks such as Tildenville Elementary School, Tildenville Marketplace, and Meadow Marsh are now located within the city limits of Winter Garden.
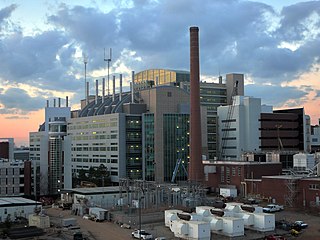
Druid Hills is a community which includes both a census-designated place (CDP) in unincorporated DeKalb County, Georgia, United States, as well as a neighborhood of the city of Atlanta. The CDP's population was 14,568 at the 2010 census. The CDP formerly contained the main campus of Emory University and the Centers for Disease Control and Prevention (CDC); however, they were annexed by Atlanta in 2018. The Atlanta-city section of Druid Hills is one of Atlanta's most affluent neighborhoods with a mean household income in excess of $238,500.
New York City is a large and ethnically diverse metropolis. It is the largest city in the United States with a long history of international immigration. The New York region continues to be by far the leading metropolitan gateway for legal immigrants admitted into the United States. The city is the geographical and demographic center of both the Northeast megalopolis and the New York metropolitan area, the largest metropolitan area in the U.S. by both population and urban area. With over 20.1 million people in its metropolitan statistical area and 23.5 million in its combined statistical area as of 2020, New York City is one of the world's most populous megacities.
The demographics of Chicago show that it is a large, and ethnically and culturally diverse metropolis. It is the third largest city and metropolitan area in the United States by population. Chicago was home to over 2.7 million people in 2020, accounting for over 25% of the population in the Chicago metropolitan area, home to approximately 9.6 million.
Johns Creek is a city in Fulton County, Georgia, United States. According to the 2020 census, the population was 82,453. The city is a northeastern suburb of Atlanta.
New York County, coterminous with the New York City borough of Manhattan, is the most densely populated U.S. county, with a density of 70,825.6/mi2 (27,267.4/km2) as of 2013. In 1910, it reached a peak of 101,548/mi2 (39,222.9/km2). The county is one of the original counties of New York State.
According to the U.S. Census Bureau, as of 2023, Texas was the second largest state in population after California, with a population of 30,503,301, an increase of more than 1.3 million people, or 4.7%, since the 29,145,505 of the 2020 census. Its apportioned population in 2020 was 29,183,290. Since the beginning of the 21st century, the state of Texas has experienced strong population growth. Texas has many major cities and metropolitan areas, along with many towns and rural areas. Much of the population is concentrated in the major cities of Dallas–Fort Worth, Austin, San Antonio, Houston, McAllen, and El Paso and their corresponding metropolitan areas. The first four aforementioned main urban centers are also referred to as the Texas Triangle megaregion.
Historic Brookhaven is a historic neighborhood, part of which lies in Atlanta's Buckhead Community, part of which lies in Sandy Springs, Georgia, and part of which lies in city of Brookhaven, Georgia, to which it lends its name. Capital City Club country club is at the center of the neighborhood, and it is surrounded by valuable homes, many of which were designed by a number of well-known Atlanta architects of the pre-war period. The neighborhood boundaries are well defined, and it stretches from Peachtree Dunwoody Road to the west, Windsor Parkway to the north, Mabry Drive to the east, and Peachtree Road to the south.
The District of Columbia is a federal district with an ethnically diverse population. In 2020, the District had a population of 689,545 people, with a resident density of 11,515 people per square mile.
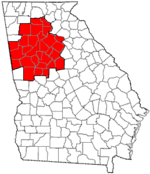
Metro Atlanta, designated by the United States Office of Management and Budget as the Atlanta–Sandy Springs–Roswell metropolitan statistical area, is the most populous metropolitan statistical area in the U.S. state of Georgia and the sixth-largest in the United States, based on the July 1, 2023 metropolitan area population estimates from the U.S. Census Bureau. Its economic, cultural, and demographic center is Atlanta, and its total population was 6,307,261 in the 2023 estimate from the U.S. Census Bureau.
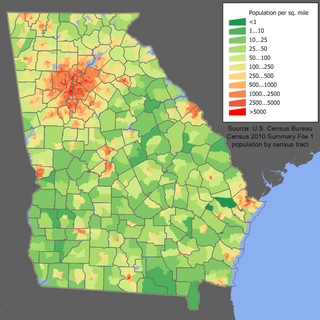
Georgia is a South Atlantic U.S. state with a population of 10,711,908 according to the 2020 United States census, or just over 3% of the U.S. population. The majority of the state's population is concentrated within Metro Atlanta, although other highly populated regions include: West Central and East Central Georgia; West, Central, and East Georgia; and Coastal Georgia; and their Athens, Columbus, Macon and Warner Robins, Augusta, Savannah, Hinesville, and Brunswick metropolitan statistical areas.
Atlanta, the largest urban center in the southeastern U.S., has undergone profound social, cultural and demographic change since the 1980s. Prior to that time, the region contained two main ethnic groups: European Americans and African Americans. However, from 1980 to 1995, the Hispanic population of Georgia grew 130%. By 1996 there were 462,973 Hispanics in Georgia. From 1990 to 2000, Georgia became the third largest state for migrating Hispanics and Latinos.
Black Atlantans form a major population group in the Atlanta metropolitan area, encompassing both those of African-American ancestry as well as those of recent Caribbean or African origin. Atlanta has long been known as a center of black entrepreneurship, higher education, political power and culture; a cradle of the Civil Rights Movement.
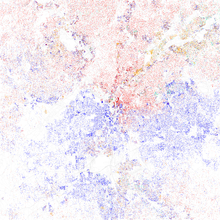
Racial segregation in Atlanta has known many phases after the freeing of the slaves in 1865: a period of relative integration of businesses and residences; Jim Crow laws and official residential and de facto business segregation after the Atlanta Race Riot of 1906; blockbusting and black residential expansion starting in the 1950s; and gradual integration from the late 1960s onwards. A 2015 study conducted by Nate Silver of fivethirtyeight.com, found that Atlanta was the second most segregated city in the U.S. and the most segregated in the South.
Midwest Cascade, also known as West Cascade, is an affluent predominantly African-American neighborhood in southwest Atlanta at the city's far west edge. Together with the tiny neighborhood of Regency Trace, it forms NPU-Q, the city's fastest growing Neighborhood Planning Unit (NPU) from 2000 to 2010.
A black mecca, in the United States, is a city to which African Americans, particularly singles, professionals, and middle-class families, are drawn to live, due to some or all of the following factors:
The racial and ethnic demographics of the United States have changed dramatically throughout its history.
Wichita is the largest city in the US state of Kansas and the principal city of the Wichita Metropolitan Area. As of the 2010 United States Census, the population of the city was 382,368.
Dallas–Fort Worth is the most populous metropolitan area of Texas, and the Southern United States. Having 7,637,387 residents at the 2020 U.S. census, the metropolitan statistical area has experienced positive growth trends since the former Dallas and Fort Worth metropolitan areas conurbated into the Metroplex. By the 2022 census estimates, its population grew to 7,943,685.
"That stockpile of black brain power has made Atlanta the nation's mecca for blacks, especially buppies looking for Afro-American affluence and political clout." in "Bond vs. Lewis - it's Atlanta's loss that only one of the two can win ", Atlanta Journal-Constitution, August 16, 1986
↑ 2010 Census Brochure[permanent dead link]] Note: racial and ethnic groups are listed in the order established by the national census, not by their ranking within Atlanta
This page is based on this Wikipedia article Text is available under the CC BY-SA 4.0 license; additional terms may apply. Images, videos and audio are available under their respective licenses.