Demographics of Arizona

Last updated

Contents

Historical population
CensusPop.Note
1860 6,482
1870 9,65849.0%
1880 40,440318.7%
1890 88,243118.2%
1900 122,93139.3%
1910 204,35466.2%
1920 334,16263.5%
1930 435,57330.3%
1940 499,26114.6%
1950 749,58750.1%
1960 1,302,16173.7%
1970 1,745,90034.1%
1980 2,718,21555.7%
1990 3,665,22834.8%
2000 5,130,63240.0%
2010 6,392,01724.6%
2020 7,151,50211.9%
Sources: 1910–2020 [1]
Note that early censuses
may not include
Native Americans in Arizona

As of the 2020 United States census, Arizona had a population of 7,151,502. [2]

A past census found that the population had seen a natural increase since the last census of 297,928 people (that is 564,062 births minus 266,134 deaths) and an increase due to net migration of 745,944 people into the state. Immigration from outside the United States resulted in a net increase of 204,661 people, and migration within the country produced a net increase of 541,283 people. New population figures for the year ending July 1, 2006, indicate that Arizona is the fastest growing state in the United States, with 3.6% population growth since 2005, exceeding the growth of the previous leader, Nevada. The most recent population estimates released by the US Census put the population at 7,278,717 in 2019. [3]

The population density of the state is 45.2 people per square mile. [4] In 2010, there were an estimated 460,000 undocumented immigrants in the state. [5] These constituted an estimated 7.9% of the population. [6]

Arizona's population density. Arizona population map.png
Arizona's population density.

The center of population of Arizona is located in Maricopa County, [7] which contains over 61% of Arizona's population.

Ancestry

2020 census

According to the 2020 census, the racial make up of Arizona was 53.4% Non-Hispanic White, 4.7% African American, 4.5% Native American, 3.6% Asian, .2% Pacific Islander. The State was 30.7% Hispanic or Latino. [8]

Demographics of Arizona (csv)
By race WhiteBlackAIAN*AsianNHPI*
2000 (total population)89.29%3.74%5.81%2.36%0.28%
2000 (Hispanic only)24.13%0.41%0.73%0.19%0.07%
2005 (total population)88.74%4.20%5.63%2.75%0.31%
2005 (Hispanic only)27.20%0.58%0.72%0.23%0.08%
Growth 2000–05 (total population)15.05%30.11%12.25%35.27%25.02%
Growth 2000–05 (non-Hispanic only)9.32%25.75%11.85%34.75%22.33%
Growth 2000–05 (Hispanic only)30.51%65.92%15.01%41.10%32.89%
* AIAN is American Indian or Alaskan Native; NHPI is Native Hawaiian or Pacific Islander

According to the 2005–2007 American Community Survey conducted by the U.S. Census Bureau, White Americans made up 76.4% of Arizona's population; of which 59.6% were Non-Hispanic Whites. Black people or African Americans made up 3.4% of Arizona's population; of which 3.3% were non-Hispanic black people. American Indians made up 4.5% of the state's population; of which 4.1% were non-Hispanic. Asian Americans made up 2.3% of the state's population. Pacific Islander Americans made up 0.1% of the state's population. Individuals from some other race made up 10.8% of the state's population; of which 0.2% were non-Hispanic. Individuals from two or more races made up 2.4% of the state's population; of which 1.4% were non-Hispanic. In addition, Hispanics and Latinos made up 29.0% of Arizona's population. [9] [10]

The state has the third-highest number (and the sixth-highest percentage) of Native Americans of any state in the Union. 286,680 were estimated to live in Arizona, representing more than 10% of the country's total Native American population of 2,752,158. Only California and Oklahoma [11] have more Native Americans. The perimeters of Phoenix, Tucson, Prescott, Scottsdale, Flagstaff and Yuma border on Native American reservations.

The largest ancestry groups in Arizona are Mexican (25.8%), German (16.5%), English (10.3%), Irish (10.9%), and Native American (4.5%). [12] The southern and central parts of the state are predominantly Mexican American, especially in Santa Cruz County and Yuma County near the Mexican border. The north-central and northwestern counties are largely inhabited by non-Hispanic White Americans. The northeastern part of Arizona has many American Indians. Asian Americans also made major contributions to the development of Arizona, such as the many Chinese who arrived in the state's mines and railroads, and the fact that over 20,000 Japanese Americans, mostly residing in the Grand Avenue section of Phoenix and farming areas of southern Arizona and the Colorado River valley, were interned during World War II. As of the 2010 US Census, Arizonans who claim Filipino ancestry exceed 53,000. [13] Filipino Americans are also the largest Asian American subgroup in the state.

Arizona is projected to become a minority-majority state by the year 2027, [14] if current population growth trends continue. In 2003, for the first time, there were slightly more births to Hispanics in the state than births to non-Hispanic whites. Since then, the gap has widened. In 2007, Hispanics accounted for 45% of all newborns, whereas non-Hispanic whites accounted for 41% of all births. All the other races accounted for 14% of births.

Birth data

Note: Births in the table don't add up, because Hispanics are counted both by their ethnicity and by their race, giving a higher overall number.

Live Births by Single Race/Ethnicity of Mother
Race 2013 [15] 2014 [16] 2015 [17] 2016 [18] 2017 [19] 2018 [20] 2019 [21] 2020 [22] 2021 [23] 2022 [24]
White:71,470 (83.5%)72,687 (83.6%)71,422 (83.7%).....................
> Non-Hispanic White 38,360 (44.8%)38,608 (44.4%)36,976 (43.3%)35,244 (41.7%)33,694 (41.2%)32,805 (40.6%)31,940 (40.2%)30,854 (40.1%)31,488 (40.4%)30,499 (38.8%)
Black 4,870 (5.7%)5,208 (6.0%)5,095 (6.0%)4,075 (4.8%)4,241 (5.2%)4,305 (5.3%)4,542 (5.7%)4,389 (5.7%)4,403 (5.6%)4,425 (5.6%)
American Indian 5,746 (6.7%)5,473 (6.3%)5,316 (6.2%)4,516 (5.3%)4,256 (5.2%)4,155 (5.1%)3,911 (4.9%)3,551 (4.6%)3,362 (4.3%)3,436 (4.4%)
Asian 3,514 (4.1%)3,519 (4.1%)3,518 (4.1%)2,954 (3.5%)2,987 (3.6%)2,908 (3.6%)2,827 (3.6%)2,624 (3.4%)2,592 (3.3%)2,748 (3.5%)
Pacific Islander .........215 (0.2%)217 (0.3%)248 (0.3%)222 (0.3%)203 (0.3%)231 (0.3%)205 (0.3%)
Hispanic (of any race)33,885 (39.6%)35,034 (40.3%)35,247 (41.3%)34,950 (41.3%)34,377 (42.0%)34,084 (42.2%)33,639 (42.4%)32,999 (42.9%)33,475 (43.0%)34,839 (44.4%)
Total Arizona85,600 (100%)86,887 (100%)85,351 (100%)84,520 (100%)81,872 (100%)80,723 (100%)79,375 (100%)76,947 (100%)77,916 (100%)78,547 (100%)

Languages

Top 10 non-English languages spoken in Arizona
LanguagePercentage of population
(as of 2010) [25]
Spanish 20.8%
Navajo 1.5%
German 0.4%
Chinese (including Mandarin)0.4%
Tagalog 0.3%
Vietnamese 0.3%
Other North American indigenous languages (especially indigenous languages of Arizona)0.3%
French 0.3%
Arabic 0.2%
Apache 0.2%
Korean 0.2%

As of 2010, 72.9% (4,215,749) of Arizona residents age 5 and older spoke English at home as a primary language, while 20.8% (1,202,638) spoke Spanish, 1.5% (85,602) Navajo, 0.4% (22,592) German, 0.4% (22,426) Chinese (which includes Mandarin), 0.3% (19,015) Tagalog, 0.3% (17,603) Vietnamese, 0.3% (15,707) other North American indigenous languages (especially indigenous languages of Arizona), and French was spoken as a main language by 0.3% (15,062) of the population over the age of five. In total, 27.1% (1,567,548) of Arizona's population age 5 and older spoke a mother language other than English. [25]

Arizona is home to the largest number of speakers of Native American languages in the 48 contiguous states. Arizona's Apache County has the highest concentration of speakers of Native American Indian languages in the United States. [26]

See also the list of native peoples. See also the list of Indigenous languages of Arizona.

Religion

Religion in Arizona (2014) [27]

   Protestantism (39%)
   Mormonism (5%)
   Eastern Orthodoxy (0.5%)
  Other Christian (0.5%)
   No religion (27%)
   Judaism (2%)
   Islam (1%)
   Buddhism (1%)
   Hinduism (1%)
  Other religion (1%)

According to the Association of Religion Data Archives, the fifteen largest denominations by number of adherents in 2010 and 2000 were: [28] [29]

Religion2000 Population2010 Population
Catholic Church 974,884930,001
The Church of Jesus Christ of Latter-day Saints 251,974392,918
Southern Baptist Convention 138,516126,830
Assemblies of God 82,802123,713
United Methodist Church 53,23254,977
Christian Churches and Churches of Christ 33,16248,386
Evangelical Lutheran Church in America 69,39342,944
Lutheran Church–Missouri Synod 24,97726,322
Presbyterian Church (U.S.A.) 33,55426,078
Episcopal Church (United States) 24,85331,104
Seventh-day Adventist Church 11,51320,924
Church of the Nazarene 18,14316,991
Lutheran Congregations in Mission for Christ 014,350
Churches of Christ 14,47114,151
Non-denominational Christian281,10563,885 [nb 1]

Regarding non-Christian denominations, Hinduism became the largest non-Christian religion (when combining all denominations) in 2010, with over 32,000 adherents in several denominations, followed by Judaism with over 20,000 in three denominations, and Buddhism with over 19,000 adherents in several denominations. [28] [30] [31]

Notes

  1. In 2000, this designation was broken into two groups: Independent, Non-Charismatic Churches (34,130 adherents) and Independent, Charismatic Churches (29,755 adherents)

Related Research Articles

<span class="mw-page-title-main">Demographics of the United States</span>

The United States had an official estimated resident population of 334,914,895 on July 1, 2023, according to the U.S. Census Bureau. This figure includes the 50 states and the District of Columbia but excludes the population of five unincorporated U.S. territories as well as several minor island possessions. The United States is the third most populous country in the world. The Census Bureau showed a population increase of 0.4% for the twelve-month period ending in July 2022, below the world average annual rate of 0.9%. The total fertility rate in the United States estimated for 2022 is 1.665 children per woman, which is below the replacement fertility rate of approximately 2.1.

<span class="mw-page-title-main">Green Lake County, Wisconsin</span> County in Wisconsin, United States

Green Lake County is a county located in the U.S. state of Wisconsin. As of the 2020 census, the population was 19,018. Its county seat is Green Lake. In 2020, the center of population of Wisconsin was located in Green Lake County, near the city of Markesan.

The 2010 census estimated Alabama's population at 4,802,740, an increase of 332,636 or 7.5% since 2000. This includes a natural increase of 87,818 and a net migration of 73,178 people into the state. Immigration from outside the United States resulted in a net increase of 30,537 and migration within the country produced a net increase of 42,641.

<span class="mw-page-title-main">Demographics of California</span>

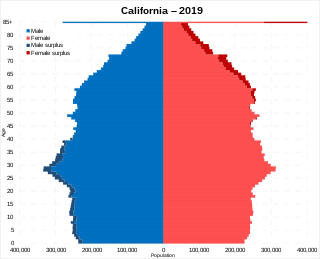
California is the most populated U.S. state, with an estimated population of 38.9 million as of 2023. It has people from a wide variety of ethnic, racial, national, and religious backgrounds.

According to the U.S. Census Bureau, as of 2023, Texas was the second largest state in population after California, with a population of 30,503,301, an increase of more than 1.3 million people, or 4.7%, since the 29,145,505 of the 2020 census. Its apportioned population in 2020 was 29,183,290. Since the beginning of the 21st century, the state of Texas has experienced strong population growth. Texas has many major cities and metropolitan areas, along with many towns and rural areas. Much of the population is concentrated in the major cities of Dallas–Fort Worth, Austin, San Antonio, Houston, McAllen, and El Paso and their corresponding metropolitan areas. The first four aforementioned main urban centers are also referred to as the Texas Triangle megaregion.

<span class="mw-page-title-main">Demographics of Alaska</span>

As of 2020, Alaska has a population of 733,391.

<span class="mw-page-title-main">Demographics of Oklahoma</span> Oklahoma Demographics

According to the U.S. Census Bureau, as of 2020, the state of Oklahoma had a population of 3,959,353, which is an increase of 208,002 or 5.54% since the year 2010. Oklahoma is the 28th most populous state in the United States.

<span class="mw-page-title-main">Demographics of South Dakota</span>

South Dakota is the 46th-most populous U.S. state; in 2019, the U.S. Census Bureau estimated a population of about 884,659. The majority of South Dakotans are White, and the largest religion is Christianity. In 2010, 93.46% of the population spoke English as their primary language.

The demographics of Virginia are the various elements used to describe the population of the Commonwealth of Virginia and are studied by various government and non-government organizations. Virginia is the 12th-most populous state in the United States with over 8 million residents and is the 35th largest in area.

The District of Columbia is a federal district with an ethnically diverse population. In 2020, the District had a population of 689,545 people, with a resident density of 11,515 people per square mile.

Florida is the third-most populous state in the United States. Its residents include people from a wide variety of ethnic, racial, national and religious backgrounds. The state has attracted immigrants, particularly from Latin America. Florida's majority ethnic group are European Americans, with approximately 65% of the population identifying as White. National ethnic communities in the state include Cubans, who migrated en masse following the revolution in the mid 20th century. They have been joined by other immigrants from Latin America, and Spanish is spoken by more than 20% of the state's population, with high usage especially in the Miami-Dade County area.

<span class="mw-page-title-main">Demographics of Massachusetts</span> Demographics of the U.S. state

Massachusetts has an estimated population of 6.981 million as of 2022 according to the U.S. Census Bureau. This represents a −0.7% decrease in population from the 2020 census, when the population was 7.029 million. Currently, Massachusetts is the sixteenth most populous U.S. state.

<span class="mw-page-title-main">Demographics of Louisiana</span>

Louisiana is a South Central U.S. state, with a 2020 U.S. census resident population of 4,657,757, and apportioned population of 4,661,468. Much of the state's population is concentrated in southern Louisiana in the Greater New Orleans, Florida Parishes, and Acadiana regions, with the remainder in North and Central Louisiana's major metropolitan areas. The center of population of Louisiana is located in Pointe Coupee Parish, in the city of New Roads.

<span class="mw-page-title-main">Demographics of Arkansas</span>

Arkansas is the 32nd largest U.S. state, with a population of 3,011,524 as of the 2020 United States census.

Tennessee is the fifteenth most populous state in the United States with a population of 7,051,339 as of 2022, and has the twentieth-highest population density. The 2020 United States census reported its population to be 6,916,897.

Demographics of North Carolina covers the varieties of ethnic groups who reside in North Carolina and relevant trends.

<span class="mw-page-title-main">Demographics of Georgia (U.S. state)</span>

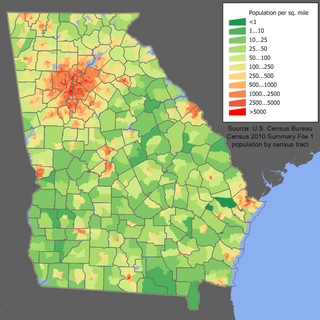
Georgia is a South Atlantic U.S. state with a population of 10,711,908 according to the 2020 United States census, or just over 3% of the U.S. population. The majority of the state's population is concentrated within Metro Atlanta, although other highly populated regions include: West Central and East Central Georgia; West, Central, and East Georgia; and Coastal Georgia; and their Athens, Columbus, Macon and Warner Robins, Augusta, Savannah, Hinesville, and Brunswick metropolitan statistical areas.

Utah is the 30th most populous state in the United States with a population of about 3.3 million, according to projections from the US Census Bureau's 2017 estimates. The state has also been characterized by a tremendous amount of growth in the last decade, with the highest percent increase in population of any state since 2010. Utah has a surface area of 84,899 square miles, though around 80% of its population is concentrated around a metropolitan area in the north-central part of the state known as the Wasatch Front.

The racial and ethnic demographics of the United States have changed dramatically throughout its history.

Hispanic and Latino Arizonans are residents of the state of Arizona who are of Hispanic or Latino ancestry. As of the 2010 U.S. Census, Hispanics and Latinos of any race were 30% of the state's population.

References

  1. "Historical Population Change Data (1910–2020)". Census.gov. United States Census Bureau. Archived from the original on April 29, 2021. Retrieved May 1, 2021.
  2. "2020 census".
  3. "QuickFacts Arizona; United States". 2019 Population Estimates. United States Census Bureau, Population Division. March 22, 2020. Archived from the original on March 7, 2019. Retrieved March 22, 2020.
  4. John W. Wright, ed. (2007). The New York Times 2008 Almanac . p.  178. ISBN   978-0-14-311233-4.
  5. Chapman, Steve (April 23, 2010). "How immigration crackdowns backfire". Washington, DC: Washington Examiner. p. 31.[ permanent dead link ]
  6. Slevin, Peter (April 30, 2010). "New Arizona law puts police in 'tenuous' spot". Washington Post. Washington, DC. p. A4.
  7. "Population and Population Centers by State – 2000". United States Census Bureau. Archived from the original on 2001-12-12. Retrieved 2008-12-04.
  8. "2020 Census".
  9. Bureau, U.S. Census. "American FactFinder – Community Facts". factfinder.census.gov. Archived from the original on 11 February 2020. Retrieved 2 August 2017.
  10. Bureau, U.S. Census. "American FactFinder – Results". factfinder.census.gov. Archived from the original on 10 February 2020. Retrieved 2 August 2017.
  11. "Arizona QuickFacts from the US Census Bureau". quickfacts.cenusus.gov. Archived from the original on 19 February 2016. Retrieved 2 August 2017.
  12. Bureau, U.S. Census. "American FactFinder – Results". factfinder.census.gov. Archived from the original on 10 February 2020. Retrieved 2 August 2017.
  13. Bureau, U.S. Census. "U.S. Census website". United States Census Bureau . Retrieved 2 August 2017.
  14. Nintzel, Jim. "Hispanics Leading Minority Growth in AZ". Tucsonweekly.com. Retrieved 2 August 2017.
  15. "Births: Final Data for 2013" (PDF). Cdc.gov. Retrieved 2017-08-02.
  16. "Births: Final Data for 2014" (PDF). Cdc.gov. Retrieved 2017-08-02.
  17. "Births: Final Data for 2015" (PDF). Cdc.gov. Retrieved 2017-08-02.
  18. https://www.cdc.gov/nchs/data/nvsr/nvsr67/nvsr67_01.pdf [ bare URL PDF ]
  19. https://www.cdc.gov/nchs/data/nvsr/nvsr67/nvsr67_08-508.pdf [ bare URL PDF ]
  20. "Data" (PDF). www.cdc.gov. Retrieved 2019-12-02.
  21. "Data" (PDF). www.cdc.gov. Retrieved 2019-12-02.
  22. "Data" (PDF). www.cdc.gov. Retrieved 2022-02-20.
  23. "Data" (PDF). www.cdc.gov. Retrieved 2022-02-02.
  24. "Data" (PDF). www.cdc.gov. Retrieved 2024-04-04.
  25. 1 2 "Arizona". Modern Language Association. Archived from the original on December 1, 2007. Retrieved October 15, 2013.
  26. Arizona has most Indian language speakers. Upi.com Accessed 2011-12-12.
  27. "Adults in Arizona". Pew Research Center.
  28. 1 2 "Arizona – Religious Traditions, 2010". Association of Religion Data Archives. Archived from the original on April 22, 2014. Retrieved August 2, 2017.
  29. "Arizona – Religious Traditions, 2010". Association of Religion Data Archives. Archived from the original on March 10, 2012. Retrieved August 2, 2017.
  30. "How Hindus Grew into Second-Largest Faith in Arizona & Delaware". NBC News. June 24, 2014. Archived from the original on June 25, 2014. Retrieved August 2, 2017.
  31. "U.S. Religion Census 2010: Summary Findings" (PDF). Association of Statisticians of American Religious Bodies. May 1, 2012. p. 16. Archived from the original (PDF) on October 18, 2012. Retrieved August 2, 2017.