Fraser Valley

Last updated
Fraser Valley
Lower Mainland of British Columbia, 2012.jpg
Landsat image of Fraser Valley. Sediment deposited by the Fraser River is clearly visible to the west.
Canada British Columbia relief location map.jpg
Red pog.svg
Fraser Valley
Coordinates: 49°06′30″N122°17′30″W / 49.10833°N 122.29167°W / 49.10833; -122.29167
Location British Columbia, Canada
Part of Fraser Lowland
Formed by Fraser River

The Fraser Valley is a geographical region in southwestern British Columbia, Canada and northwestern Washington State. It starts just west of Hope in a narrow valley encompassing the Fraser River and ends at the Pacific Ocean stretching from the North Shore Mountains, opposite the city of Vancouver BC, to just south of Bellingham, Washington.

Contents

In casual usage it typically describes the Fraser River basin downstream of the Fraser Canyon. The term is sometimes used outside British Columbia to refer to the entire Fraser River sections including the Fraser Canyon and up from there to its headwaters, but in general British Columbian usage the term refers to the stretch of Lower Mainland west of the Coquihalla River mouth at the inland town of Hope, and includes all of the Canadian portion of the Fraser Lowland as well as the valleys and upland areas flanking it. It is divided into the Upper Fraser Valley and Lower Fraser Valley by the Vedder River mouth at the eastern foothills of Sumas Mountain, although the Lower Valley section upstream of McMillan Island and the Salmon River mouth (at Fort Langley) used to be called the Central Fraser Valley up until 1995 (see Central Fraser Valley Regional District).

Administratively, the Fraser Valley comprises parts of the regional districts of Metro Vancouver and the Fraser Valley Regional District. The main population centres in the Fraser Valley are Greater Vancouver, Abbotsford and Chilliwack.

History

Evolution of the Lower Fraser Valley from Langley to Harrison Evolution of the Lower Fraser Valley From Langley to Harrison.gif
Evolution of the Lower Fraser Valley from Langley to Harrison

This section of the Fraser River is known by local indigenous peoples as "Sto:lo" in the Halqemeylem language of the area, and this term has been adopted to refer to all of the indigenous peoples of the Fraser Lowland, other than the Squamish and Musqueam. The indigenous peoples of the area have long made use of the river valley for agricultural and commercial exploits and continue to do so today.[ when? ]

The Indigenous people were not consulted in the Treaty of Oregon, which saw the United States and Great Britain define and recognize each other's claims to the area. This overstepping of jurisdiction inevitably lead to conflict as Great Britain was incapable of exercising the control they claimed over the river valley. As a wave of immigrants flooded into the Fraser River Valley because of the Fraser Canyon Gold Rush, the British were unable to maintain order without the cooperation of the local indigenous peoples, and the Fraser Canyon War broke out. The war was resolved with a series of treaties, none of which remain to this day, but which evidently included the regulation of immigration and the continuation of mining on the river by the indigenous inhabitants and the new immigrants. This war was part of a series of local conflicts surrounding the arrival of settlers ahead of American and British capacity to maintain order and refusal to cooperate with or recognize indigenous land claims and demands. These conflicts were pivotal in many aspects to the settlement of the West Coast in both Canada and the United States.

The interaction of indigenous peoples and settlers lead to the growth of Chinook Wawa, a pidgin language that was used throughout the Fraser River Valley until the early 1900s. Industrialization of the river began with the use of the traditional trade waterway by steamboats and eventually, roads and railways were built, fueled by and in turn fuelling further population growth. Today,[ when? ] the most important transportation through the region are the Canadian Pacific Railway and Canadian National Railway transcontinental main lines, the Lougheed Highway (Hwy 7), and the Trans-Canada Highway (Hwy 1).

Geography

Map showing the Fraser River and its major tributaries FraserRiverBritishColumbia Location.png
Map showing the Fraser River and its major tributaries

After descending through the rapids of the Fraser Canyon, the Fraser River emerges almost at sea level at Yale, over 100 km inland. Although the canyon in geographic terms is defined as ending at Yale, Hope is generally to be considered the southern end of the canyon, partly because of the change in the character of the highway from that point, and perhaps also because it is at Hope that the first floodplains typifying the course of the Lower Fraser are found. Downstream from Hope, the river and adjoining floodplains widen considerably in the area of Rosedale, Chilliwack and Agassiz, which is considered the head of the Fraser Delta. From there the river passes through some of the most fertile agricultural land in British Columbia—as well as the heart of the Metro Vancouver region—on its way through the valley to its mouth at Georgia Strait.

During the last ice age, the area that would become the Fraser Valley was covered by a sheet of ice, walled in by the surrounding mountains. As the ice receded, land that had been covered by glaciers became covered by water instead, then slowly rose above the water, forming the basin that exists today. The valley is the largest landform of the Lower Mainland ecoregion, with its delta considered to begin in the area of Agassiz and Chilliwack, although stretches of floodplain flank the mountainsides between there and Hope.

Several of the Fraser's lower tributaries have floodplains of their own, shared in common with the Fraser freshet. Of varying size these include the Harrison River, Chilliwack River (Vedder River), Hatzic Creek and Hatzic Lake, the Stave, Alouette, Pitt and Coquitlam Rivers. Also incorporated in the Fraser delta region are the Nicomekl and Serpentine River floodplains and the Sumas River drainage, which flow to saltwater independently of the Fraser but help drain its lowland. The Fraser is tidal as far upstream as the town of Mission and, across the river, the City of Abbotsford, which is at the Fraser's closest approach to the international boundary, about 6 miles north of Sumas, Washington. Pitt Lake, one of the Fraser's last tributaries and among its largest, is so low in elevation, despite its mountain setting, that it is one of the largest tidal freshwater lakes in the world .

Oxbow lakes and side-sloughs are a common feature of the Lower Fraser's geography. The two main oxbows are those of Hatzic Lake and the Stave River on opposite sides of Mission, although that of the Stave has been silted in and part of it drained for a man-made lake. Around Fort Langley is an oxbow formation, mostly swamped in at the time of the fort's foundation, which was drained and made part of the fort's farm and remains farmland today. The system of sloughs and side-channels of the river is complicated, but important sloughs include those around Nicomen Island, Sea Bird Island and flanking the river from Rosedale to Sumas Mountain, on the western side of Chilliwack.

Panoramic view of Fraser River and valley as seen from the grounds of Westminster Abbey, above Hatzic in Mission, British Columbia FraserRiverPanorama.jpg
Panoramic view of Fraser River and valley as seen from the grounds of Westminster Abbey, above Hatzic in Mission, British Columbia

Climate

Panoramic view of the Fraser Valley as seen from eastern Abbotsford looking northwest, showing the District of Mission, which lies across the river from this viewpoint Fraser Valley Panorama 2.jpg
Panoramic view of the Fraser Valley as seen from eastern Abbotsford looking northwest, showing the District of Mission, which lies across the river from this viewpoint

In winter, the Fraser Valley occasionally plays a significant role in the weather regime along the west coast of North America as far south as California, acting as a natural outlet for the intensely cold Arctic air mass which typically sits over Western Canada during winter. Under certain meteorological conditions strong winds pour out of the Fraser Valley and over the relatively warmer waters of the Strait of Georgia and the Strait of Juan de Fuca. This can cause ocean-effect snow, especially between Port Angeles and Sequim, where the air mass collides with the Olympic Mountains. [1] The cold air from the Fraser Valley can also flow out over the Pacific Ocean. Lanes of convective ocean-effect clouds and showers are produced as heat and moisture modify the very dry, frigid air mass. These then typically organize as a low pressure system which returns the showers to the coast south of Canada, often bringing snow to unusually low elevations.

Western Fraser Valley

Climate data for Western Fraser Valley (Maple Ridge Kanaka Creek) (1981–2010)
MonthJanFebMarAprMayJunJulAugSepOctNovDecYear
Record high °C (°F)14.5
(58.1)
20.0
(68.0)
25.5
(77.9)
29.5
(85.1)
31.0
(87.8)
34.0
(93.2)
36.5
(97.7)
34.5
(94.1)
35.5
(95.9)
27.5
(81.5)
16.0
(60.8)
13.5
(56.3)
36.5
(97.7)
Mean daily maximum °C (°F)5.0
(41.0)
7.8
(46.0)
10.9
(51.6)
14.9
(58.8)
17.9
(64.2)
20.5
(68.9)
23.8
(74.8)
24.1
(75.4)
21.1
(70.0)
14.1
(57.4)
8.1
(46.6)
4.6
(40.3)
14.4
(57.9)
Daily mean °C (°F)2.5
(36.5)
4.0
(39.2)
6.5
(43.7)
9.6
(49.3)
12.5
(54.5)
15.2
(59.4)
17.7
(63.9)
17.8
(64.0)
15.0
(59.0)
10.0
(50.0)
5.4
(41.7)
2.4
(36.3)
9.9
(49.8)
Mean daily minimum °C (°F)0.0
(32.0)
0.1
(32.2)
1.9
(35.4)
4.3
(39.7)
7.1
(44.8)
9.9
(49.8)
11.7
(53.1)
11.6
(52.9)
8.9
(48.0)
5.9
(42.6)
2.8
(37.0)
0.2
(32.4)
5.4
(41.7)
Record low °C (°F)−17
(1)
−13.5
(7.7)
−9
(16)
−2.5
(27.5)
−1
(30)
2.5
(36.5)
5.0
(41.0)
5.0
(41.0)
1.0
(33.8)
−6
(21)
−13
(9)
−17.5
(0.5)
−17.5
(0.5)
Average precipitation mm (inches)275.8
(10.86)
146.1
(5.75)
174.3
(6.86)
144.1
(5.67)
132.5
(5.22)
90.0
(3.54)
59.4
(2.34)
63.3
(2.49)
82.5
(3.25)
189.0
(7.44)
308.2
(12.13)
236.7
(9.32)
1,901.9
(74.88)
Average rainfall mm (inches)252.4
(9.94)
138.2
(5.44)
167.9
(6.61)
144.0
(5.67)
132.4
(5.21)
90.0
(3.54)
59.4
(2.34)
63.3
(2.49)
82.5
(3.25)
188.9
(7.44)
301.8
(11.88)
218.6
(8.61)
1,839.4
(72.42)
Average snowfall cm (inches)11.1
(4.4)
23.4
(9.2)
6.4
(2.5)
0.1
(0.0)
0.1
(0.0)
0.0
(0.0)
0.0
(0.0)
0.0
(0.0)
0.0
(0.0)
0.1
(0.0)
6.4
(2.5)
18.1
(7.1)
62.5
(24.6)
Average precipitation days (≥ 0.2 mm)21.015.420.017.716.013.49.08.19.116.821.320.5188.1
Average rainy days (≥ 0.2 mm)19.914.619.417.716.013.49.08.19.116.820.919.1184
Average snowy days (≥ 0.2 cm)4.12.01.60.050.050.00.00.00.00.051.33.612.75
Source: Environment Canada [2]
Climate data for Western Fraser Valley (Langley) (1971–2000)
MonthJanFebMarAprMayJunJulAugSepOctNovDecYear
Record high °C (°F)15
(59)
18.5
(65.3)
20
(68)
24.4
(75.9)
34
(93)
40.0
(104.0)
35.6
(96.1)
36.1
(97.0)
33.3
(91.9)
27.5
(81.5)
19
(66)
16.1
(61.0)
40.0
(104.0)
Mean daily maximum °C (°F)5
(41)
7.6
(45.7)
10.5
(50.9)
13.3
(55.9)
16.8
(62.2)
19.3
(66.7)
22.6
(72.7)
22.8
(73.0)
19.6
(67.3)
14.1
(57.4)
8.1
(46.6)
5.3
(41.5)
13.8
(56.7)
Daily mean °C (°F)2.2
(36.0)
4.4
(39.9)
6.3
(43.3)
8.6
(47.5)
11.8
(53.2)
14.2
(57.6)
16.7
(62.1)
17.0
(62.6)
14.2
(57.6)
9.8
(49.6)
5.1
(41.2)
2.7
(36.9)
9.4
(49.0)
Mean daily minimum °C (°F)−0.6
(30.9)
1.2
(34.2)
2.2
(36.0)
3.8
(38.8)
6.7
(44.1)
9.2
(48.6)
10.8
(51.4)
11.1
(52.0)
8.8
(47.8)
5.6
(42.1)
2.1
(35.8)
0.1
(32.2)
5.1
(41.2)
Record low °C (°F)−14
(7)
−12
(10)
−8.3
(17.1)
−2.8
(27.0)
−0.6
(30.9)
1.7
(35.1)
3.9
(39.0)
3.3
(37.9)
−1.7
(28.9)
−7
(19)
−16
(3)
−19.4
(−2.9)
−19.4
(−2.9)
Average precipitation mm (inches)176
(6.9)
172.1
(6.78)
135.2
(5.32)
102.7
(4.04)
82.8
(3.26)
72.9
(2.87)
52.7
(2.07)
56.4
(2.22)
76.4
(3.01)
141
(5.6)
207.5
(8.17)
211.3
(8.32)
1,486.9
(58.54)
Average rainfall mm (inches)153.0
(6.02)
156.4
(6.16)
131.4
(5.17)
102.1
(4.02)
82.8
(3.26)
72.9
(2.87)
52.7
(2.07)
56.4
(2.22)
76.4
(3.01)
140.7
(5.54)
200.8
(7.91)
193.4
(7.61)
1,419
(55.86)
Average snowfall cm (inches)23.0
(9.1)
15.8
(6.2)
3.8
(1.5)
0.6
(0.2)
0
(0)
0
(0)
0
(0)
0
(0)
0
(0)
0.3
(0.1)
6.7
(2.6)
17.9
(7.0)
68.1
(26.7)
Average precipitation days (≥ 0.2 mm)17.517.717.215.314.112.37.68.311.015.519.518.3174.3
Average rainy days15.516.316.915.314.112.37.68.311.015.518.816.5168.1
Average snowy days (≥ 0.2 cm)3.32.21.10.1000000.11.23.111.1
Source: Environment Canada [3] [4]
Climate data for Western Fraser Valley Abbotsford International Airport (1981–2010)
MonthJanFebMarAprMayJunJulAugSepOctNovDecYear
Record high humidex 18.820.024.831.239.549.846.243.440.131.221.018.949.8
Record high °C (°F)18.1
(64.6)
20.6
(69.1)
24.9
(76.8)
29.8
(85.6)
36.0
(96.8)
42.9
(109.2)
38.0
(100.4)
36.3
(97.3)
37.5
(99.5)
29.3
(84.7)
22.4
(72.3)
18.2
(64.8)
42.9
(109.2)
Mean daily maximum °C (°F)6.7
(44.1)
9.0
(48.2)
11.6
(52.9)
14.7
(58.5)
18.1
(64.6)
20.8
(69.4)
24.0
(75.2)
24.4
(75.9)
21.3
(70.3)
15.0
(59.0)
9.3
(48.7)
5.9
(42.6)
15.1
(59.2)
Daily mean °C (°F)3.6
(38.5)
5.0
(41.0)
7.2
(45.0)
9.8
(49.6)
13.0
(55.4)
15.7
(60.3)
18.1
(64.6)
18.2
(64.8)
15.3
(59.5)
10.5
(50.9)
6.0
(42.8)
2.9
(37.2)
10.4
(50.7)
Mean daily minimum °C (°F)0.4
(32.7)
1.1
(34.0)
2.7
(36.9)
4.8
(40.6)
7.8
(46.0)
10.5
(50.9)
12.2
(54.0)
12.0
(53.6)
9.3
(48.7)
5.9
(42.6)
2.7
(36.9)
−0.1
(31.8)
5.8
(42.4)
Record low °C (°F)−21.1
(−6.0)
−18.9
(−2.0)
−12.8
(9.0)
−4.4
(24.1)
−2.2
(28.0)
1.1
(34.0)
2.2
(36.0)
3.3
(37.9)
−1.7
(28.9)
−7.5
(18.5)
−16.7
(1.9)
−20.0
(−4.0)
−21.1
(−6.0)
Record low wind chill −26.6−29.6−19.7−7.3−40.00.00.0−5.4−13.9−27.6−33.3−33.3
Average precipitation mm (inches)211.7
(8.33)
132.3
(5.21)
149.3
(5.88)
117.8
(4.64)
99.8
(3.93)
74.8
(2.94)
43.2
(1.70)
45.9
(1.81)
75.5
(2.97)
152.7
(6.01)
248.2
(9.77)
186.6
(7.35)
1,537.8
(60.54)
Average rainfall mm (inches)193.6
(7.62)
123.4
(4.86)
144.9
(5.70)
117.1
(4.61)
99.8
(3.93)
74.8
(2.94)
43.2
(1.70)
45.9
(1.81)
75.5
(2.97)
152.7
(6.01)
241.5
(9.51)
170.9
(6.73)
1,483.3
(58.40)
Average snowfall cm (inches)18.5
(7.3)
8.6
(3.4)
4.4
(1.7)
0.5
(0.2)
0.0
(0.0)
0.0
(0.0)
0.0
(0.0)
0.0
(0.0)
0.0
(0.0)
0.0
(0.0)
6.7
(2.6)
16.5
(6.5)
55.2
(21.7)
Average precipitation days (≥ 0.2 mm)20.116.219.116.314.413.07.37.19.615.820.819.8179.5
Average rainy days (≥ 0.2 mm)18.215.418.616.314.413.07.37.19.615.820.218.2174.1
Average snowy days (≥ 0.2 cm)3.71.91.40.30.00.00.00.00.00.01.33.612.2
Average relative humidity (%) (at 3pm)73.362.959.956.056.557.154.553.256.466.174.374.562.1
Mean monthly sunshine hours 68.399.0131.5171.5208.7213.7276.7263.2201.9122.664.764.91,886.7
Percent possible sunshine 25.234.635.741.844.144.256.759.153.336.523.425.240.0
Source: Environment Canada [5] [6] [7] [8]

Central Fraser Valley

Climate data for Central Fraser Valley (Agassiz) (1981–2010)
MonthJanFebMarAprMayJunJulAugSepOctNovDecYear
Record high °C (°F)17.2
(63.0)
21.7
(71.1)
25.8
(78.4)
32.2
(90.0)
36.0
(96.8)
41.4
(106.5)
38.3
(100.9)
39.4
(102.9)
36.8
(98.2)
28.3
(82.9)
21.1
(70.0)
17.2
(63.0)
41.4
(106.5)
Mean daily maximum °C (°F)6.2
(43.2)
8.5
(47.3)
11.6
(52.9)
15.0
(59.0)
18.5
(65.3)
21.1
(70.0)
24.0
(75.2)
24.6
(76.3)
21.3
(70.3)
15.0
(59.0)
8.9
(48.0)
5.8
(42.4)
15.0
(59.0)
Daily mean °C (°F)3.4
(38.1)
5.1
(41.2)
7.5
(45.5)
10.4
(50.7)
13.6
(56.5)
16.2
(61.2)
18.5
(65.3)
18.7
(65.7)
15.9
(60.6)
11.0
(51.8)
6.1
(43.0)
3.2
(37.8)
10.8
(51.4)
Mean daily minimum °C (°F)0.5
(32.9)
1.6
(34.9)
3.4
(38.1)
5.6
(42.1)
8.8
(47.8)
11.3
(52.3)
12.8
(55.0)
12.8
(55.0)
10.3
(50.5)
6.9
(44.4)
3.2
(37.8)
0.5
(32.9)
6.5
(43.7)
Record low °C (°F)−25.0
(−13.0)
−24.4
(−11.9)
−14.4
(6.1)
−3.9
(25.0)
−1.1
(30.0)
1.7
(35.1)
3.3
(37.9)
1.7
(35.1)
−1.1
(30.0)
−8.5
(16.7)
−19.0
(−2.2)
−21.1
(−6.0)
−25.0
(−13.0)
Average precipitation mm (inches)240.8
(9.48)
142.1
(5.59)
154.7
(6.09)
125.9
(4.96)
103.0
(4.06)
92.2
(3.63)
66.6
(2.62)
58.2
(2.29)
87.6
(3.45)
191.7
(7.55)
285.0
(11.22)
206.1
(8.11)
1,754.1
(69.06)
Average rainfall mm (inches)220.8
(8.69)
131.1
(5.16)
148.8
(5.86)
125.5
(4.94)
103.0
(4.06)
92.2
(3.63)
66.6
(2.62)
58.2
(2.29)
87.6
(3.45)
191.6
(7.54)
275.8
(10.86)
187.7
(7.39)
1,688.9
(66.49)
Average snowfall cm (inches)20.3
(8.0)
12.5
(4.9)
5.8
(2.3)
0.4
(0.2)
0
(0)
0
(0)
0
(0)
0
(0)
0
(0)
0.2
(0.1)
9.2
(3.6)
19.0
(7.5)
67.4
(26.6)
Average precipitation days (≥ 0.2 mm)19.217.319.917.817.115.010.410.111.717.121.320.0196.9
Average rainy days (≥ 0.2 mm)16.815.819.617.817.115.010.410.111.717.120.718.1190.1
Average snowy days (≥ 0.2 cm)4.62.81.00.2000000.071.33.913.87
Mean monthly sunshine hours 57.885.7127.7163.9194.2195.6255.8242.2196.8122.260.253.61,755.6
Source: Environment Canada [9] [10] [11]
Climate data for Central Fraser Valley (Chilliwack Airport) (1981–2010)
MonthJanFebMarAprMayJunJulAugSepOctNovDecYear
Record high °C (°F)18.3
(64.9)
20.6
(69.1)
25.8
(78.4)
32.2
(90.0)
34.5
(94.1)
43.7
(110.7)
38.0
(100.4)
39.4
(102.9)
36.5
(97.7)
27.8
(82.0)
21.1
(70.0)
19.0
(66.2)
43.7
(110.7)
Mean daily maximum °C (°F)6.1
(43.0)
8.8
(47.8)
11.8
(53.2)
15.8
(60.4)
19.1
(66.4)
21.7
(71.1)
25.0
(77.0)
25.3
(77.5)
22.3
(72.1)
15.3
(59.5)
9.3
(48.7)
6.0
(42.8)
15.5
(59.9)
Daily mean °C (°F)3.3
(37.9)
4.9
(40.8)
7.3
(45.1)
10.5
(50.9)
13.7
(56.7)
16.4
(61.5)
18.8
(65.8)
18.7
(65.7)
15.7
(60.3)
10.8
(51.4)
6.2
(43.2)
3.3
(37.9)
10.8
(51.4)
Mean daily minimum °C (°F)0.4
(32.7)
1.0
(33.8)
2.8
(37.0)
5.2
(41.4)
8.2
(46.8)
11.0
(51.8)
12.5
(54.5)
12.1
(53.8)
9.1
(48.4)
6.4
(43.5)
3.1
(37.6)
0.5
(32.9)
6.0
(42.8)
Record low °C (°F)−26.7
(−16.1)
−16.7
(1.9)
−14.4
(6.1)
−6.1
(21.0)
−1.7
(28.9)
1.1
(34.0)
3.3
(37.9)
2.8
(37.0)
−2.8
(27.0)
−7.2
(19.0)
−14.4
(6.1)
−21.7
(−7.1)
−26.7
(−16.1)
Average precipitation mm (inches)233.5
(9.19)
125.8
(4.95)
154.7
(6.09)
116.3
(4.58)
93.1
(3.67)
91.7
(3.61)
48.1
(1.89)
56.7
(2.23)
75.2
(2.96)
178.5
(7.03)
283.8
(11.17)
210.1
(8.27)
1,667.5
(65.65)
Average rainfall mm (inches)206.9
(8.15)
114.7
(4.52)
143.7
(5.66)
115.2
(4.54)
93.1
(3.67)
91.7
(3.61)
48.1
(1.89)
56.7
(2.23)
75.2
(2.96)
178.4
(7.02)
272.7
(10.74)
185.8
(7.31)
1,582.2
(62.29)
Average snowfall cm (inches)26.6
(10.5)
11.2
(4.4)
11.0
(4.3)
1.1
(0.4)
0.0
(0.0)
0.0
(0.0)
0.0
(0.0)
0.0
(0.0)
0.0
(0.0)
0.1
(0.0)
11.2
(4.4)
24.3
(9.6)
85.3
(33.6)
Average precipitation days (≥ 0.2 mm)20.615.919.717.515.814.68.78.59.917.121.520.1189.9
Average rainy days (≥ 0.2 mm)18.614.619.217.515.814.68.78.59.917.120.918.4183.8
Average snowy days (≥ 0.2 cm)5.02.91.90.20.00.00.00.00.00.12.04.816.8
Source 1: [12]
Source 2: [13]

Eastern Fraser Valley

Climate data for Eastern Fraser Valley (Laidlaw), 1981–2010 normals
MonthJanFebMarAprMayJunJulAugSepOctNovDecYear
Record high °C (°F)14.5
(58.1)
18.5
(65.3)
25.0
(77.0)
30.5
(86.9)
37.5
(99.5)
35.0
(95.0)
38.0
(100.4)
37.5
(99.5)
36.5
(97.7)
28.5
(83.3)
17.5
(63.5)
13.5
(56.3)
38.0
(100.4)
Mean daily maximum °C (°F)4.6
(40.3)
7.5
(45.5)
11.4
(52.5)
15.2
(59.4)
18.5
(65.3)
21.2
(70.2)
24.3
(75.7)
25.0
(77.0)
21.3
(70.3)
14.3
(57.7)
7.7
(45.9)
4.2
(39.6)
14.6
(58.3)
Daily mean °C (°F)2.2
(36.0)
4.2
(39.6)
7.1
(44.8)
10.2
(50.4)
13.6
(56.5)
16.3
(61.3)
18.8
(65.8)
19.3
(66.7)
16.2
(61.2)
10.7
(51.3)
5.4
(41.7)
2.0
(35.6)
10.5
(50.9)
Mean daily minimum °C (°F)−0.3
(31.5)
0.9
(33.6)
2.8
(37.0)
5.0
(41.0)
8.5
(47.3)
11.1
(52.0)
13.1
(55.6)
13.3
(55.9)
10.8
(51.4)
6.9
(44.4)
3.0
(37.4)
−0.3
(31.5)
6.2
(43.2)
Record low °C (°F)−17.0
(1.4)
−18.0
(−0.4)
−8.5
(16.7)
−1.5
(29.3)
0.5
(32.9)
5.0
(41.0)
7.0
(44.6)
7.5
(45.5)
3.0
(37.4)
−10.0
(14.0)
−20.5
(−4.9)
−18.0
(−0.4)
−20.5
(−4.9)
Average precipitation mm (inches)287.6
(11.32)
194.3
(7.65)
201.2
(7.92)
166.6
(6.56)
131.8
(5.19)
113.8
(4.48)
84.7
(3.33)
64.2
(2.53)
104.7
(4.12)
229.6
(9.04)
352.7
(13.89)
255.8
(10.07)
2,186.8
(86.09)
Average rainfall mm (inches)262.6
(10.34)
177.7
(7.00)
193.5
(7.62)
165.8
(6.53)
131.8
(5.19)
113.8
(4.48)
84.7
(3.33)
64.2
(2.53)
104.7
(4.12)
228.9
(9.01)
344.8
(13.57)
236.2
(9.30)
2,108.5
(83.01)
Average snowfall cm (inches)24.9
(9.8)
16.6
(6.5)
7.7
(3.0)
0.8
(0.3)
0.0
(0.0)
0.0
(0.0)
0.0
(0.0)
0.0
(0.0)
0.0
(0.0)
0.6
(0.2)
7.9
(3.1)
19.6
(7.7)
78.2
(30.8)
Average precipitation days (≥ 0.2 mm)20.716.719.918.017.114.510.58.811.217.521.218.0194.2
Average rainy days (≥ 0.2 mm)18.215.219.518.017.114.510.58.811.217.420.716.0187.1
Average snowy days (≥ 0.2 cm)4.52.81.10.310.00.00.00.00.00.151.53.914.26
Source: Environment Canada [9]
Climate data for Eastern Fraser Valley (Hope Airport), 1981–2010 normals, extremes 1910–present [lower-alpha 1]
MonthJanFebMarAprMayJunJulAugSepOctNovDecYear
Record high °C (°F)15.0
(59.0)
19.4
(66.9)
25.1
(77.2)
32.2
(90.0)
38.4
(101.1)
41.4
(106.5)
40.6
(105.1)
39.1
(102.4)
38.3
(100.9)
29.0
(84.2)
18.9
(66.0)
16.1
(61.0)
41.4
(106.5)
Mean daily maximum °C (°F)4.7
(40.5)
7.0
(44.6)
12.1
(53.8)
15.1
(59.2)
18.6
(65.5)
20.9
(69.6)
23.6
(74.5)
24.8
(76.6)
21.4
(70.5)
14.5
(58.1)
7.1
(44.8)
3.5
(38.3)
14.4
(57.9)
Daily mean °C (°F)2.1
(35.8)
3.6
(38.5)
7.4
(45.3)
10.1
(50.2)
13.5
(56.3)
16.0
(60.8)
18.2
(64.8)
19.0
(66.2)
15.9
(60.6)
10.5
(50.9)
4.6
(40.3)
1.2
(34.2)
10.2
(50.4)
Mean daily minimum °C (°F)−0.4
(31.3)
0.3
(32.5)
2.6
(36.7)
5.0
(41.0)
8.4
(47.1)
11.0
(51.8)
12.8
(55.0)
13.2
(55.8)
10.3
(50.5)
6.4
(43.5)
2.1
(35.8)
−1.0
(30.2)
5.9
(42.6)
Record low °C (°F)−25.0
(−13.0)
−23.3
(−9.9)
−16.7
(1.9)
−5.6
(21.9)
−2.8
(27.0)
1.1
(34.0)
3.3
(37.9)
1.1
(34.0)
−1.1
(30.0)
−11.2
(11.8)
−21.4
(−6.5)
−24.4
(−11.9)
−25.0
(−13.0)
Average precipitation mm (inches)290.5
(11.44)
201.1
(7.92)
159.0
(6.26)
172.8
(6.80)
112.0
(4.41)
93.8
(3.69)
77.8
(3.06)
49.1
(1.93)
97.0
(3.82)
218.6
(8.61)
352.5
(13.88)
219.0
(8.62)
2,043.3
(80.44)
Average rainfall mm (inches)265.9
(10.47)
182.1
(7.17)
154.3
(6.07)
171.7
(6.76)
112.0
(4.41)
93.8
(3.69)
77.8
(3.06)
49.1
(1.93)
97.0
(3.82)
217.4
(8.56)
339.0
(13.35)
195.2
(7.69)
1,955.2
(76.98)
Average snowfall cm (inches)27.9
(11.0)
24.9
(9.8)
5.1
(2.0)
1.0
(0.4)
0
(0)
0
(0)
0
(0)
0
(0)
0
(0)
1.3
(0.5)
14.3
(5.6)
29.0
(11.4)
103.5
(40.7)
Average precipitation days (≥ 0.2 mm)18.915.917.518.216.313.910.58.110.315.721.617.7184.6
Average rainy days (≥ 0.2 mm)16.713.717.218.216.313.910.58.110.215.620.814.9176.1
Average snowy days (≥ 0.2 cm)5.64.01.40.5000000.22.96.320.9
Average relative humidity (%)77.168.057.256.557.659.458.555.055.768.880.278.064.3
Mean monthly sunshine hours 13.256.3114.7144.6185.4194.6236.2251.8188.796.919.64.41,506.4
Percent possible sunshine 4.919.831.235.239.140.148.256.449.728.97.11.730.2
Source: Environment Canada [14] [15]
  1. Extreme high and low temperatures in the table below were recorded at Hope from March 1910 to December 1937 and at Hope Airport from January 1938 to present.

Demographics

Fraser Valley Regional District

Canada 2016 Census [16] Population % of total population (2016)
Visible minority group Indian 39,920
Chinese 3,660
Black 2,495
Filipino 2,700
Latin American 2,050
Arab 505
Southeast Asian 2,285
West Asian 355
Korean 2,135
Japanese 905
Visible minority, n.i.e.405
Multiple visible minorities1,110
Total visible minority population58,535
European 202,095
Aboriginal group23,865
Total population288,765100%

According to the 2011 Census, 76.47% of the Fraser Valley regional district in BC have English as mother tongue; Punjabi is the mother tongue of 10.02% of the population, followed by German (3.49%), Dutch (1.39%), French (1.07%), Korean (0.69%), Spanish (0.66%), Tagalog (0.35%), Chinese, n.o.s. (0.33%), and Vietnamese (0.30%). [17]

Mother tonguePopulation (2011)Percentage
English 209,13076.47%
Punjabi 27,39010.02%
German 9,5403.49%
Dutch 3,7901.39%
French 2,9151.07%
Korean 1,8800.69%
Spanish 1,8100.66%
Tagalog (Filipino)9500.35%
Chinese, n.o.s. 8900.33%
Vietnamese 8200.30%

Modern land use

Today, the Fraser Valley has a mix of land uses, ranging from the urban and industrial centres of Vancouver, Surrey, and Abbotsford through golf courses and parks to dairy farms and market gardens.

Agricultural land in the valley – much of it protected by the Agricultural Land Reserve – is intensively farmed: the Fraser Valley brings in over half of British Columbia's annual agricultural revenue, although it makes up a small percentage of the province's total land area.[ citation needed ]

The Fraser Valley, specifically in Abbotsford, is the northernmost area of rice cultivation in the world. [18]

Air quality

As the valley population grows and traffic increases, air pollution becomes an increasingly important issue; various controversies have risen over the years (most recently over "Sumas 2", a defeated proposal for a power plant just south of the Canadian/USA border) as to whether or not air pollution is a problem, and if it is a problem, how this should be addressed.

Air quality monitoring has improved in recent years and it is now possible to compare BC communities on a variety of measures. Comparative data on four measures—fine particulate matter, ground-level ozone, nitrogen dioxide and sulphur dioxide—shows the Fraser Valley to have better air quality than Vancouver on several measures. For example, Fraser Valley communities had less than half the levels of nitrogen dioxide, and were lower in fine particulate matter and sulphur dioxide (on the latter measure, Abbotsford and Chilliwack were among the lowest of all BC sites). [19]

In certain weather conditions during the summer, prevailing westerly winds blow air pollution from vehicles and from ships in Vancouver harbour east up the triangular delta, trapping it between the Coast Mountains on the north and the Cascades on the southeast. Air quality suffers. This usually occurs during a temperature inversion, and lasts for a few days. Ground-level ozone tends to be from local sources in the valley and varies with prevailing winds. [20] With prevailing winds from the northeast during the late fall and winter, air quality is seldom a problem.

Air quality in the Fraser Valley at times exceeds the Canada-Wide Standard (CWS) for ozone (at Hope) and is close to exceeding the CWS for Particulate Matter. [21]

Modern usage of the name

In colloquial usage, "Fraser Valley" usually refers only to that part of the valley beyond the continuously built-up urban area around Vancouver, up to and including Chilliwack and Agassiz, about 80 km east, and abutting the border with Washington's Whatcom County; news media typically also include the built-up eastern suburban areas of Vancouver which a few decades ago were mixed farmland and forest, typical of "the Valley". The Fraser Valley region is also the namesake of the Fraser Valley Regional District, though that consists of only about half of the actual Fraser Valley, and is made up of the municipalities and incorporated areas from Abbotsford and Mission eastwards to Hope. It also includes areas not in the Fraser Valley, particularly the lower Fraser Canyon from Boston Bar to Hope.

The term "Central Fraser Valley" refers to Mission and Abbotsford and is included within the Lower Fraser Valley. The Upper Fraser Valley means from Chilliwack and Agassiz to Hope. The phrases "Fraser Valley towns" and "Fraser River municipalities" include Delta and Richmond, though the colloquial "in the Valley" means from Surrey and Coquitlam eastwards.

The "Tidal Fraser area" is usually defined as the area of the Fraser from the mouth at the Pacific Ocean to the Mission bridge. Everything in between there is influenced greatly by ocean tides, including the largest tidal lake in North America, Pitt Lake.

Sociology

The south shore of the Central and Upper Fraser Valley is also known colloquially as the "Bible Belt" of British Columbia and is home to many of Canada's largest churches, notably the Mennonite Brethren and the Dutch Reformed Church, a reflection of the heavy settlement of the Valley by post-war Dutch and German immigrants, as well as the Canadian headquarters of many Christian/Evangelical para-church organisations such as Focus on the Family and Power to Change, the Canadian branch of Cru_(Christian_organization), formerly known as Campus Crusade for Christ. Voters in south shore ridings typically elect right-wing candidates, while in ridings on the river's north side elections sway between left-wing and right-wing parties regularly.

See also

Notes

  1. Mass, Cliff (2008). The Weather of the Pacific Northwest. University of Washington Press. p. 60. ISBN   978-0-295-98847-4.
  2. Canadian Climate Normals 1981–2010 Station Data – Climate – Environment and Climate Change Canada
  3. Environment CanadaCanadian Climate Normals 1971–2000 Archived 2020-03-24 at the Wayback Machine , accessed July 10, 2009
  4. "Historical Data - Climate - Environment and Climate Change Canada". 31 October 2011.
  5. "Abbotsford A". Canadian Climate Normals 1981–2010. Environment Canada. 31 October 2011. Retrieved May 14, 2014.
  6. "ABBOTSFORD A". Environment Canada. Archived from the original on 2020-03-13. Retrieved July 15, 2015.
  7. "Daily Data Report for November 2016". Environment Canada. 31 October 2011. Retrieved November 15, 2016.
  8. "Daily Data Report for June 2021". Environment Canada. 31 October 2011. Retrieved June 28, 2021.
  9. 1 2 "Canadian Climate Normals 1981-2010 at station AGASSIZ CDA". Environment Canada. 2013-07-01. Retrieved 2014-01-02.
  10. "Historical Data - Climate - Environment and Climate Change Canada". 31 October 2011.
  11. "Historical Data - Climate - Environment and Climate Change Canada". 31 October 2011.
  12. "Canadian Climate Normals 1981-2010 Station Data". Environment Canada. 26 May 2016. Retrieved May 26, 2016.
  13. "Historical Data - Climate - Environment and Climate Change Canada". 31 October 2011.
  14. "Hope A". Environment Canada. Retrieved 1 March 2017.[ permanent dead link ]
  15. "Hope Little Mountain". Environment Canada. 31 October 2011. Retrieved 1 March 2017.
  16. Census Profile, 2016 Census: Fraser Valley, Regional district. Statistics Canada. Retrieved 27 July 2018.
  17. Census Profile Fraser Valley, RD British Columbia http://www12.statcan.gc.ca/census-recensement/2011/dp-pd/prof/details/page.cfm?Lang=E&Geo1=CD&Code1=5909&Geo2=PR&Code2=01&Data=Count&SearchText=fraser%20valley&SearchType=Begins&SearchPR=01&B1=All&Custom=&TABID=1
  18. Tourism Abbotsford (2019) https://tourismabbotsford.ca/abbotsford-rice-paddies-thriving/ Retrieved on: 2020-02-06.
  19. BC Lung Association (2010)Sixth Annual State of the Air Report Archived 2007-08-11 at the Wayback Machine . Retrieved on: 2011-01-27.
  20. Canadian Council of Ministers of the Environment (November 2006). [www.env.gov.bc.ca/epd/bcairquality/reports/pdfs/canada_pm_ozone.pdf Canada Wide Standards for PM and Ozone: Status of Jurisdictional Implementation Planning Activities – British Columbia]. Retrieved on 2011-01-27.
  21. canada.com

Related Research Articles

<span class="mw-page-title-main">Lower Mainland</span> Region in British Columbia, Canada

The Lower Mainland is a geographic and cultural region of the mainland coast of British Columbia that generally comprises the regional districts of Metro Vancouver and the Fraser Valley. Home to approximately 3.05 million people as of the 2021 Canadian census, the Lower Mainland contains sixteen of the province's 30 most populous municipalities and approximately 60% of the province's total population.

<span class="mw-page-title-main">Fraser River</span> River in British Columbia, Canada

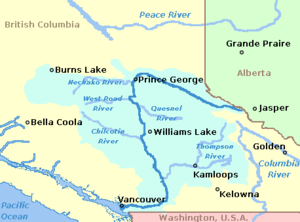
The Fraser River is the longest river within British Columbia, Canada, rising at Fraser Pass near Blackrock Mountain in the Rocky Mountains and flowing for 1,375 kilometres (854 mi), into the Strait of Georgia just south of the City of Vancouver. The river's annual discharge at its mouth is 112 cubic kilometres (27 cu mi) or 3,550 cubic metres per second (125,000 cu ft/s), and each year it discharges about 20 million tons of sediment into the ocean.

<span class="mw-page-title-main">Abbotsford, British Columbia</span> City in British Columbia, Canada

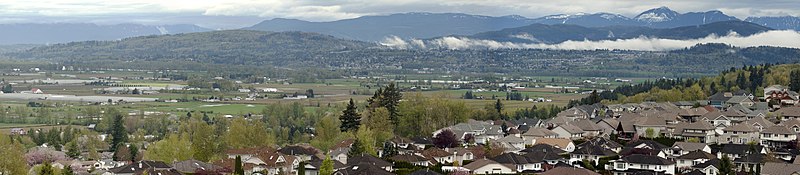
Abbotsford is a city in British Columbia next to the Canada–United States border, Greater Vancouver and the Fraser River. With a census population of 153,569 people (2021), it is the largest municipality in the province outside metropolitan Vancouver. Abbotsford–Mission has the third-highest proportion of visible minorities among census metropolitan areas in Canada, after the Greater Toronto Area and the Greater Vancouver CMA. It is home to Tradex, the University of the Fraser Valley, and Abbotsford International Airport.

<span class="mw-page-title-main">Chilliwack</span> City in British Columbia, Canada

Chilliwack is a city of about 100,000 people and 261 km2 (100 sq mi) in the Canadian province of British Columbia. It is located about 100 km (62 mi) east of the City of Vancouver in the Fraser Valley. The enumerated population is 93,203 in the city and 113,767 in the greater metropolitan area. It is the second-fastest growing metropolitan area in Canada.

<span class="mw-page-title-main">Mission, British Columbia</span> City in British Columbia, Canada

Mission is a city in the Lower Mainland of the province of British Columbia, Canada. It was originally incorporated as a district municipality in 1892, growing to include additional villages and rural areas over the years, adding the original Town of Mission City, long an independent core of the region, in 1969. It is bordered by the city of Abbotsford to the south and the city of Maple Ridge to the west. To the east are the unincorporated areas of Hatzic and Dewdney.

Highway 1 is a provincial highway in British Columbia, Canada, that carries the main route of the Trans-Canada Highway (TCH). The highway is 1,047 kilometres (651 mi) long and connects Vancouver Island, the Greater Vancouver region in the Lower Mainland, and the Interior. It is the westernmost portion of the main TCH to be numbered "Highway 1", which continues through Western Canada and extends to the Manitoba–Ontario boundary. The section of Highway 1 in the Lower Mainland is the second-busiest freeway in Canada, after Ontario Highway 401 in Toronto.

<span class="mw-page-title-main">Hope, British Columbia</span> District municipality in British Columbia, Canada

Hope is a district municipality at the confluence of the Fraser and Coquihalla rivers in the province of British Columbia, Canada. Hope is at the eastern end of both the Fraser Valley and the Lower Mainland region, and is at the southern end of the Fraser Canyon. To the east, over the Cascade Mountains, is the Interior region, beginning with the Similkameen Country on the farther side of the Allison Pass in Manning Park. Located 154 kilometres (96 mi) east of Vancouver, Hope is at the southern terminus of the Coquihalla Highway and the western terminus of the Crowsnest Highway, locally known as the Hope-Princeton, where they merge with the Trans-Canada Highway. Hope is at the eastern terminus of Highway 7. As it lies at the eastern end of the Fraser Valley in the windward Cascade foothills, the town gets very high amounts of rain and cloud cover – particularly throughout the autumn and winter.

<span class="mw-page-title-main">Fraser Valley Regional District</span> Regional district in British Columbia, Canada

The Fraser Valley Regional District (FVRD) is a regional district in British Columbia, Canada. Its headquarters are in the city of Chilliwack. The FVRD covers an area of 13,361.74 km2 (5,159 sq mi). It was created in 1995 by an amalgamation of the Fraser-Cheam Regional District and Central Fraser Valley Regional District and the portion of the Dewdney-Alouette Regional District from and including the District of Mission eastwards.

<span class="mw-page-title-main">Geography of British Columbia</span>

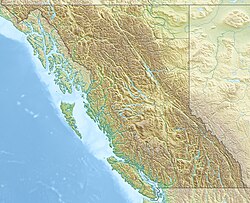
British Columbia is the westernmost province of Canada, bordered by the Pacific Ocean. With an area of 944,735 km2 (364,764 sq mi) it is Canada's third-largest province. The province is almost four times the size of the United Kingdom and larger than every United States state except Alaska. It is bounded on the northwest by the U.S. state of Alaska, directly north by Yukon and the Northwest Territories, on the east by Alberta, and on the south by the U.S. states of Washington, Idaho, and Montana. Formerly part of the British Empire, the southern border of British Columbia was established by the 1846 Oregon Treaty. The province is dominated by mountain ranges, among them the Canadian Rockies but dominantly the Coast Mountains, Cassiar Mountains, and the Columbia Mountains. Most of the population is concentrated on the Pacific coast, notably in the area of Vancouver, located on the southwestern tip of the mainland, which is known as the Lower Mainland. It is the most mountainous province of Canada.

<span class="mw-page-title-main">Chilliwack (electoral district)</span> Provincial electoral district in British Columbia, Canada

Chilliwack has been a provincial electoral district in the Canadian province of British Columbia since 1916. Incorporating slightly different boundaries, it was the successor riding to the Chilliwhack riding the name of which was based on the older spelling of the name.

<span class="mw-page-title-main">Kent, British Columbia</span> District municipality in British Columbia, Canada

The District of Kent is a district municipality located 116 kilometres (72 mi) east of Vancouver, British Columbia. Part of the Fraser Valley Regional District, Kent consists of several communities, the largest and most well-known being Agassiz—the only town in the municipality—Harrison Mills, Kilby, Mount Woodside, Kent Prairie, Sea Bird Island and Ruby Creek. Included within the municipality's boundaries are several separately-governed Indian reserves, including the Seabird Island First Nation's reserves on and around the island of the same name.

<span class="mw-page-title-main">Sumas Lake</span> Lake in British Columbia, Canada

Sumas Lake(Halq’eméyle: Semá:th Lake, Nooksack: Semáts Xácho7, ) was a shallow freshwater lake surrounded by extensive wetlands that once existed in eastern Fraser Lowland, located on the south side of the Sumas River between the foothills of Sumas Mountain and Vedder Mountain. It disappeared after being artificially drained for flood control and land reclamation from 1920 to 1924, leaving behind a low-lying flatland known as the Sumas Prairie, which is nowadays drained by the Saar Creek and the namesaked Sumas Drainage Canal.

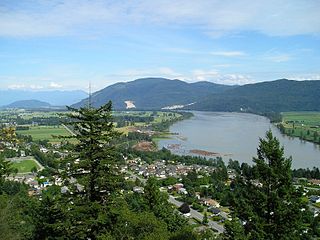
Sumas Mountain, also referred to as Canadian Sumas to distinguish it from an identically named mountain just 10 km (6.2 mi) to the south in U.S. state of Washington across the border, is a mountain in eastern Fraser Lowland, in the Lower Mainland region of the Canadian province of British Columbia. It sits on the south bank of the Fraser River, west of the smaller Chilliwack Mountain across the Vedder River mouth, and serves as a geographic landmark dividing the Fraser Valley into "Upper" and "Lower" sections. Sumas Peak is an official name for the summit located on the south shore of the Fraser River in the Fraser Valley between Abbotsford and Chilliwack, British Columbia. Elevation 910 m (2,986 ft) above sea level, prominence 875 m (2,871 ft).

Matsqui is a former district municipality in British Columbia, Canada. It was incorporated in 1892 and merged with the district municipality of Abbotsford in 1995 to create the new City of Abbotsford. Matsqui used to be the western part of what is now Abbotsford. It had commercial growth in the Clearbrook area which then spilled over to Abbotsford.

Hatzic Island is an island located in the centre of Hatzic Lake, an oxbow lake formation north of the Fraser River, on the east side of Mission, British Columbia, Canada.

<span class="mw-page-title-main">Fraser Lowland</span> Lowland region in southwestern British Columbia and northwestern Washington

The Fraser Lowland is a landform and physiographic region in the Pacific Northwest of North America, shared between the Canadian province of British Columbia and the U.S. state of Washington. The region includes much of the Lower Mainland region of British Columbia, and the coastal plains of Washington's Whatcom County. As a physiographic region, the Fraser Lowland is part of the Georgia Depression, which in turn is part of the Coastal Trough.

<span class="mw-page-title-main">Old Yale Road</span> Early road in British Columbia, Canada

The Old Yale Road is a historic early wagon road between New Westminster, British Columbia, Canada and Yale, British Columbia, and servicing the Fraser Valley of the British Columbia Lower Mainland in the late 19th century and into the early 20th. It eventually became an early highway route for automobiles through the valley and into the British Columbia interior beyond Yale. It would eventually be part of, then surpassed by, the Fraser Highway, the Trans-Canada Highway and the Highway 1.

Chilliwack is a city made up of several amalgamated villages and communities. The urban core has a decidedly north–south axis bisected by the Trans-Canada Highway. The city is bounded in north by the Fraser River, in the east by the Eastern Hillsides, in the south by the Canada-U.S. border, and in the west by the Vedder Canal.

<span class="mw-page-title-main">2021 Pacific Northwest floods</span> Natural disaster

The 2021 Pacific Northwest floods were a series of floods that affected British Columbia, Canada, and parts of neighboring Washington state in the United States. The flooding and numerous mass wasting events were caused by a Pineapple Express, a type of atmospheric river, which brought heavy rain to parts of southern British Columbia and northwestern United States. The natural disaster prompted a state of emergency for the province of British Columbia.

References