Greenhouse gas emissions by the United Kingdom

Last updated
Development of carbon dioxide emissions, 1750 to 2020 CO2 emissions UK.svg
Development of carbon dioxide emissions, 1750 to 2020
Transport emits the most greenhouse gas. Crossing the M25 by footpath - geograph.org.uk - 626651.jpg
Transport emits the most greenhouse gas.

In 2021, net greenhouse gas (GHG) emissions in the United Kingdom (UK) were 427 million tonnes (Mt) carbon dioxide equivalent (CO2e), 80% of which was carbon dioxide (CO2) itself. [1] Emissions increased by 5% in 2021 with the easing of COVID-19 restrictions, primarily due to the extra road transport. [1] The UK has over time emitted about 3% of the world total human caused CO2, with a current rate under 1%, although the population is less than 1%. [2]

Contents

Emissions decreased in the 2010s due to the closure of almost all coal-fired power stations. [3] In 2020 emissions per person were somewhat over 6 tonnes when measured by the international standard production based greenhouse gas inventory, [4] near the global average. [5] But consumption based emissions include GHG due to imports and aviation so are much larger, [6] about 10 tonnes per person per year. [7]

The UK has committed to carbon neutrality by 2050 [8] and the Energy and Climate Intelligence Unit has said it would be affordable. [9] The target for 2030 is a 68% reduction compared with 1990 levels. [10] The UK has been successful in keeping its economic growth alongside taking climate change action. Since 1990, the UK’s greenhouse gas emissions have reduced by 44% while the economy has grown by around 75% up until 2019. [11] One of the methods of reducing emissions is the UK Emissions Trading Scheme. [12]

Meeting future carbon budgets will require reducing emissions by at least 3% a year. At the 2021 United Nations Climate Change Conference the Prime Minister said the government would not be "lagging on lagging", but in 2022 the opposition said Britain was badly behind in such home insulation. [13] The Committee on Climate Change, an independent body which advises the UK and devolved government, has recommended hundreds of actions to the government, [14] including better energy efficiency, such as in housing. [15] [16]

Monitoring, verification and reporting

Although carbon dioxide is the main GHG methane (CH4), nitrous oxide (N2O), Hydro-flourocarbons (HFC), Perflurocarbons (PFC), Nitrogen trifluoride (NF3) and Sulphur hexafluoride (SF6) are included. [17] Land use, land-use change, and forestry is the most uncertain sector. [1] :42

Cumulative emissions

Cumulative CO2 emissions since 1750 are estimated to be around 80 billion tonnes, [18] about 3% of the world total. [2] As well as coal burnt during and since the Industrial Revolution, destruction of forests also contributed.

Emissions by sector

Transport

Transport is the most emitting sector, the Department for Energy Security and Net Zero estimated that it was responsible for about 26% of GHG in 2021. [1] This is mainly due to road vehicles, and particularly cars, burning petrol and diesel, and has declined since 1990 despite the number of vehicles increasing, because of improvements in fuel efficiency in both petrol and diesel cars. [4]

Transport was significantly impacted by COVID-19, as people were instructed to stay at home as much as possible. In 2020, territorial carbon dioxide emissions from the transport sector were 97.2 Mt, 19.6% (23.7 Mt) lower than in 2019, and 22.5% lower than in 1990. In 2020 transport accounted for 29.8% of all territorial carbon dioxide emissions, compared to 33.1% in 2019. The large majority of emissions from transport are from road transport. [19]

Jet zero is the strategy to get to zero aviation emissions by 2050. [20]

Energy supply

Energy in the United Kingdom emitted about a fifth of GHG in 2021, mainly by burning gas to generate electricity. [1] :18

Gas

There were 50 enterprises in the United Kingdom oil and gas extraction industry with an annual turnover of more than five million pounds as of 2021. [21] Extracting North Sea oil and gas is estimated to directly emit 3.5% of UK GHG. [22] Environmental activists say there should be no new gas fired power stations in the UK. [23]

Biomass

As of 2021 the net GhG and climate change effects of biomass fuel are still being researched and debated: one large user is Drax Power Station which aims to be carbon negative, but green groups dispute their carbon accounting and say that forests would not regrow quickly enough. [24]

Coal

UK will phase-out coal in 2024. UK's Eggborough's plant was closed in 2018. The UK had two weeks in May 2019 with all its coal plants switched off for the first time since the Industrial Revolution began. [25]

Business

Territorial carbon dioxide emissions from the business sector were estimated to be 59.4 Mt in 2020 and accounted for around 18.2% of all carbon dioxide emissions. There has been a 46.8% decrease in business sector emissions since 1990. Most of this decrease came between 2001 and 2009, with a significant drop in 2009 likely to have been driven by economic factors. [19] The Humber industrial region is the UK's most emitting region, at 12 million tonnes of CO2 per year. [26]

A 2020 study suggest half of UK's 'true carbon footprint' is created abroad, a large percentage of this can be attributed to imports entering the UK from other countries. International travel can also be included in this sector. [27]

Residential

In 2021, the residential sector emitted almost 70 Mt CO2e, accounting for 16% of all GHG emissions. The main source of emissions in these sectors is the use of natural gas for heating (and for cooking in the case of the residential sector). Therefore the amount various by year depending on the weather. [1] :21 Emissions from these sectors do not include emissions from the generation of electricity consumed, as these emissions are included in the energy supply sector. [19]

Governments have been criticised for support for home insulation being stop-start. [28] At COP26 Boris Johnson said the UK would not be lagging on lagging but the government was later criticised as doing that. [29]

Land use

Agriculture

Agriculture is responsible for a tenth of emissions. [4] [30]

  • 68% of total nitrous oxide emissions [31]
  • 47% of total methane emissions
  • 1.7% of total carbon dioxide emissions

Peat

UK peatlands such as the Great North Bog cover around 23,000 km2 or 9.5% of the UK land area and store at least 3.2 billion tonnes of carbon. A loss of only 5% of UK peatland carbon would equate to the total annual UK anthropogenic greenhouse gas emissions. Healthy peat bogs have a net long-term ‘cooling’ effect on the climate. Peatlands rely on water. When drained, peatlands waste away through oxidation, adding carbon dioxide to the atmosphere. Damaged and degraded peatlands place a substantial financial burden on society because of increased greenhouse gas emissions, poorer water quality and loss of other ecosystem services. [32] The Wildlife Trusts say that selling peat should be banned. [33]

Heath

Woody plant encroachment occurring in heathlands, can lead to the release of soil organic carbon, which is not offset by the growth in woody biomass above ground. The removal of conifers from afforested heathland is a recommended measure to reverse this trend. [34]

Seas

MPs say that bottom trawling and dredging is harmful and should be banned in marine protected areas. [35]

Mitigation

UK carbon neutral plan

Graph of CO2 and total greenhouse gas emissions in the UK, 1990-2018, data from Department for Business, Energy and Industrial Strategy. UK CO2 emissions 1990-2018 CORRECT.png
Graph of CO2 and total greenhouse gas emissions in the UK, 1990–2018, data from Department for Business, Energy and Industrial Strategy.
Graph of CO2 emissions by sector in the UK, 1990-2019. UK CO2 emissions by sector (1990-2019).png
Graph of CO2 emissions by sector in the UK, 1990–2019.

The sectoral graph excludes carbon emissions from international aviation and international shipping, which together rose by 74.2% from 22.65 to 39.45 million tonnes of carbon dioxide between 1990 and 2004. [38] Reductions in methane emissions are largely due to a decline in the country's coal industry and to improved landfilling technologies. [39]

The Climate Change Act 2008 set the country's emission reduction targets.

Before 2019 the UK was legally bound by the Climate Change Act to reduce emissions 80% by 2050, but a new law mandating a 100% cut was under discussion in 2019. According to the Committee on Climate Change, the UK can cut its carbon emissions down to near zero and so become carbon neutral, at no extra cost if done gradually from 2019 to 2050. [40] The law was adopted by the parliament in June 2019. [41]

The "legally binding" targets are a reduction of at least 100% by 2050 (against the 1990 baseline). [42]

It also mandates interim, 5-year budgets, which are: [43]

Carbon BudgetCarbon budget levelReduction below 1990 levels
1st (2008 to 2012)3,018 MtCO2e25%
2nd (2013 to 2017)2,782 MtCO2e31%
3rd (2018 to 2022)2,544 MtCO2e37% by 2020
4th (2023 to 2027)1,950 MtCO2e51% by 2025
5th (2028 to 2032)1,765 MtCO2e57% by 2030
6th (2033 to 2037)965 MtCO2e78% by 2035

Criticism of targets

Production targets have been criticised for ignoring the emissions embodied in imports, thereby attributing them to other countries, such as China. [44] Including these gives a total for consumption based GHG emissions, also called the UK carbon footprint, of about 650 Mt a year. [45]

Tax policy

Businesses and employees are given tax breaks for electric cars and a much larger proportion of business vehicle purchases are electric than those of consumers. [46] [47] But it is hoped increased supply of used fleet electric cars will eventually result in affordable second-hand electric cars for private buyers, [48] as purchase price is still a barrier for many consumers. [49] It has been suggested that value added tax (VAT) on natural gas used for heating should be raised from 5% to the usual 20% and the proceeds used to help poor people. [50]

Emissions Trading

The UK Emissions Trading Scheme (UK ETS) is the carbon emission trading scheme of the United Kingdom. [51] It is cap and trade and came into operation on 1 January 2021 following the UK's departure from the European Union. [52] The cap is reduced in line with the UK's 2050 net zero commitment. [53]

Transport

The Government is developing a plan to accelerate the decarbonisation of transport. The Transport Decarbonisation Plan (TDP) will set out in detail what government, business and society will need to do to deliver the significant emissions reduction needed across all modes of transport, putting us on a pathway to achieving carbon budgets and net zero emissions across every single mode of transport by 2050. [54] [ needs update ]

Sales of non-electric cars will end by 2030 and hybrids by 2035.

Residential

On the domestic level, the UK aims to reduce direct CO2 emissions from homes by 24% by 2030. There are several ways to achieve this goal, such as home insulation, the installation of heat pumps, and the use of renewable energy such as solar panels. [55]

As of 2022 the installation cost of a heat pump is more than a gas boiler, but with the government grant and assuming electricity/gas costs remain similar their lifetime costs would be similar. [56] However the share of heatpumps in the UK is far below the European average. [57]

More waste heat could be saved and used - for example in London. [58]

Agriculture

Since departure from the EU Common Agricultural Policy the Agriculture Bill was passed for agriculture in the United Kingdom. [59]

The most common actions to reduce GHG emissions were recycling waste materials, improving nitrogen fertiliser application and improving energy efficiency. These are actions that are relevant to most farm enterprises. Those actions more suited to livestock enterprises had a lower level of uptake. [31]


See also

Notes

  1. As of September 2020, published figures for 2019 are still provisional.

Related Research Articles

<span class="mw-page-title-main">Emission intensity</span> Emission rate of a pollutant

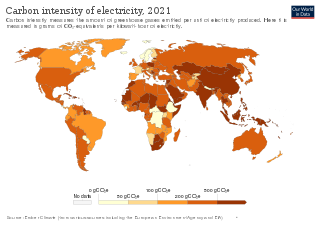
An emission intensity is the emission rate of a given pollutant relative to the intensity of a specific activity, or an industrial production process; for example grams of carbon dioxide released per megajoule of energy produced, or the ratio of greenhouse gas emissions produced to gross domestic product (GDP). Emission intensities are used to derive estimates of air pollutant or greenhouse gas emissions based on the amount of fuel combusted, the number of animals in animal husbandry, on industrial production levels, distances traveled or similar activity data. Emission intensities may also be used to compare the environmental impact of different fuels or activities. In some case the related terms emission factor and carbon intensity are used interchangeably. The jargon used can be different, for different fields/industrial sectors; normally the term "carbon" excludes other pollutants, such as particulate emissions. One commonly used figure is carbon intensity per kilowatt-hour (CIPK), which is used to compare emissions from different sources of electrical power.

<span class="mw-page-title-main">Climate change mitigation</span> Actions to reduce net greenhouse gas emissions to limit climate change

Climate change mitigation is action to limit climate change by reducing emissions of greenhouse gases or removing those gases from the atmosphere. The recent rise in global average temperature is mostly due to emissions from unabated burning of fossil fuels such as coal, oil, and natural gas. Mitigation can reduce emissions by transitioning to sustainable energy sources, conserving energy, and increasing efficiency. It is possible to remove carbon dioxide from the atmosphere by enlarging forests, restoring wetlands and using other natural and technical processes. Experts call these processes carbon sequestration. Governments and companies have pledged to reduce emissions to prevent dangerous climate change in line with international negotiations to limit warming by reducing emissions.

<span class="mw-page-title-main">The Climate Group</span> UK climate change organization

The Climate Group is a non-profit organisation that works with businesses and government leaders aiming to address climate change. The Group has programmes focusing on renewable energy and reducing Greenhouse gas emissions.

<span class="mw-page-title-main">Carbon footprint</span> Concept to quantify greenhouse gas emissions from activities or products

The carbon footprint (or greenhouse gas footprint) serves as an indicator to compare the total amount of greenhouse gases emitted from an activity, product, company or country. Carbon footprints are usually reported in tons of emissions (CO2-equivalent) per unit of comparison; such as per year, person, kg protein, km travelled and alike. For a product, its carbon footprint includes the emissions for the entire life cycle from the production along the supply chain to its final consumption and disposal. Similarly for an organization, its carbon footprint includes the direct as well as the indirect emissions caused by the organization (called Scope 1, 2 and 3 in the Greenhouse Gas Protocol that is used for carbon accounting of organizations). Several methodologies and online tools exist to calculate the carbon footprint, depending on whether the focus is on a country, organization, product or individual person. For example, the carbon footprint of a product could help consumers decide which product to buy if they want to be climate aware. In the context of climate change mitigation activities, the carbon footprint can help distinguish those economic activities with a high footprint from those with a low footprint. In other words, the carbon footprint concept allows everyone to make comparisons between the climate-relevant impacts of individuals, products, companies, countries. In doing so, it helps to devise strategies and priorities for reducing the carbon footprint.

Various energy conservation measures are taken in the United Kingdom.

<span class="mw-page-title-main">Carbon accounting</span> Processes used to measure how much carbon dioxide equivalents an organization sequesters or emits

Carbon accounting is a framework of methods to measure and track how much greenhouse gas (GHG) an organization emits. It can also be used to track projects or actions to reduce emissions in sectors such as forestry or renewable energy. Corporations, cities and other groups use these techniques to help limit climate change. Organizations will often set an emissions baseline, create targets for reducing emissions, and track progress towards them. The accounting methods enable them to do this in a more consistent and transparent manner.

<span class="mw-page-title-main">Environmental effects of aviation</span> Effect of emissions from aircraft engines

Aircraft engines produce gases, noise, and particulates from fossil fuel combustion, raising environmental concerns over their global effects and their effects on local air quality. Jet airliners contribute to climate change by emitting carbon dioxide, the best understood greenhouse gas, and, with less scientific understanding, nitrogen oxides, contrails and particulates. Their radiative forcing is estimated at 1.3–1.4 that of CO2 alone, excluding induced cirrus cloud with a very low level of scientific understanding. In 2018, global commercial operations generated 2.4% of all CO2 emissions.

<span class="mw-page-title-main">Low-carbon economy</span> Economy based on energy sources with low levels of greenhouse gas emissions

A low-carbon economy (LCE) or decarbonised economy is an economy based on energy sources that produce low levels of greenhouse gas (GHG) emissions. GHG emissions due to human activity are the dominant cause of observed climate change since the mid-20th century. Continued emission of greenhouse gases will cause long-lasting changes around the world, increasing the likelihood of severe, pervasive, and irreversible effects for people and ecosystems. Shifting to a low-carbon economy on a global scale could bring substantial benefits both for developed and developing countries. Many countries around the world are designing and implementing low-emission development strategies (LEDS). These strategies seek to achieve social, economic, and environmental development goals while reducing long-term greenhouse gas emissions and increasing resilience to the effects of climate change.

<span class="mw-page-title-main">Greenhouse gas emissions</span> Sources and amounts of greenhouse gases emitted to the atmosphere from human activities

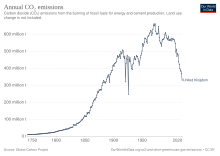
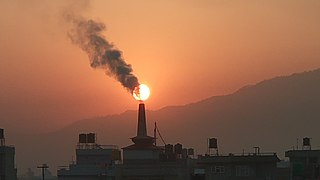
Greenhouse gas emissions from human activities strengthen the greenhouse effect, contributing to climate change. Carbon dioxide, from burning fossil fuels such as coal, oil, and natural gas, is one of the most important factors in causing climate change. The largest emitters are China followed by the US, although the United States has higher emissions per capita. The main producers fueling the emissions globally are large oil and gas companies. Human-caused emissions have increased atmospheric carbon dioxide by about 50% over pre-industrial levels. The growing levels of emissions have varied, but have been consistent among all greenhouse gases. Emissions in the 2010s averaged 56 billion tons a year, higher than any decade before. Total cumulative emissions from 1870 to 2017 were 425±20 GtC from fossil fuels and industry, and 180±60 GtC from land use change. Land-use change, such as deforestation, caused about 31% of cumulative emissions over 1870–2017, coal 32%, oil 25%, and gas 10%.

<span class="mw-page-title-main">Greenhouse gas emissions by the United States</span> Climate changing gases from the North American country

The United States produced 5.2 billion metric tons of carbon dioxide equivalent greenhouse gas (GHG) emissions in 2020, the second largest in the world after greenhouse gas emissions by China and among the countries with the highest greenhouse gas emissions per person. In 2019 China is estimated to have emitted 27% of world GHG, followed by the United States with 11%, then India with 6.6%. In total the United States has emitted a quarter of world GHG, more than any other country. Annual emissions are over 15 tons per person and, amongst the top eight emitters, is the highest country by greenhouse gas emissions per person. However, the IEA estimates that the richest decile in the US emits over 55 tonnes of CO2 per capita each year. Because coal-fired power stations are gradually shutting down, in the 2010s emissions from electricity generation fell to second place behind transportation which is now the largest single source. In 2020, 27% of the GHG emissions of the United States were from transportation, 25% from electricity, 24% from industry, 13% from commercial and residential buildings and 11% from agriculture. In 2021, the electric power sector was the second largest source of U.S. greenhouse gas emissions, accounting for 25% of the U.S. total. These greenhouse gas emissions are contributing to climate change in the United States, as well as worldwide.

<span class="mw-page-title-main">Carbon dioxide removal</span> Removal of atmospheric carbon dioxide through human activity

Carbon dioxide removal (CDR), also known as carbon removal, greenhouse gas removal (GGR) or negative emissions, is a process in which carbon dioxide gas is removed from the atmosphere by deliberate human activities and durably stored in geological, terrestrial, or ocean reservoirs, or in products. In the context of net zero greenhouse gas emissions targets, CDR is increasingly integrated into climate policy, as an element of climate change mitigation strategies. Achieving net zero emissions will require both deep cuts in emissions and the use of CDR. CDR can counterbalance emissions that are technically difficult to eliminate, such as some agricultural and industrial emissions.

<span class="mw-page-title-main">Environmental effects of transport</span>

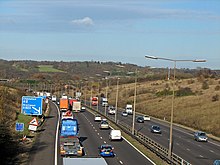
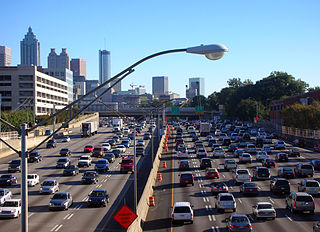
T he environmental effects of transport are significant because transport is a major user of energy, and burns most of the world's petroleum. This creates air pollution, including nitrous oxides and particulates, and is a significant contributor to global warming through emission of carbon dioxide. Within the transport sector, road transport is the largest contributor to global warming.

<span class="mw-page-title-main">Individual action on climate change</span> What people can do individually to slow down global warming

Individual action on climate change can include personal choices in many areas, such as diet, travel, household energy use, consumption of goods and services, and family size. Individuals can also engage in local and political advocacy around issues of climate change. People who wish to reduce their carbon footprint, can take "high-impact" actions, such as avoiding frequent flying and petrol fuelled cars, eating mainly a plant-based diet, having fewer children, using clothes and electrical products for longer, and electrifying homes. Avoiding meat and dairy foods has been called "the single biggest way" an individual can reduce their environmental impact. Excessive consumption is more to blame for climate change than population increase. High consumption lifestyles have a greater environmental impact, with the richest 10% of people emitting about half the total lifestyle emissions.

<span class="mw-page-title-main">Climate change in Europe</span> Emissions, impacts and responses of Europe related to climate change

Climate change in Europe has resulted in an increase in temperature of 2.3 °C (2022) in Europe compared to pre-industrial levels. Europe is the fastest warming continent in the world. Europe's climate is getting warmer due to anthropogenic activity. According to international climate experts, global temperature rise should not exceed 2 °C to prevent the most dangerous consequences of climate change; without reduction in greenhouse gas emissions, this could happen before 2050. Climate change has implications for all regions of Europe, with the extent and nature of impacts varying across the continent.

<span class="mw-page-title-main">Greenhouse gas emissions by Turkey</span> Climate-changing gases from Turkey: sources, amounts, and mitigation policies

Coal, cars and lorries vent more than a third of Turkey's five hundred million tonnes of annual greenhouse gas emissions—mostly carbon dioxide—and are part of the cause of climate change in Turkey. The nation's coal-fired power stations emit the most carbon dioxide, and other significant sources are road vehicles running on petrol or diesel. After coal and oil the third most polluting fuel is fossil gas; which is burnt in Turkey's gas-fired power stations, homes and workplaces. Much methane is belched by livestock; cows alone produce half of the greenhouse gas from agriculture in Turkey.

<span class="mw-page-title-main">Greenhouse gas emissions by Russia</span> Greenhouse gas emissions originating from Russia and efforts to reduce them

Greenhouse gas emissionsbyRussia are mostly from fossil gas, oil and coal. Russia emits 2 or 3 billion tonnes CO2eq of greenhouse gases each year; about 4% of world emissions. Annual carbon dioxide emissions alone are about 12 tons per person, more than double the world average. Cutting greenhouse gas emissions, and therefore air pollution in Russia, would have health benefits greater than the cost. The country is the world's biggest methane emitter, and 4 billion dollars worth of methane was estimated to leak in 2019/20.

<span class="mw-page-title-main">Climate change in the Netherlands</span> Emissions, impacts and responses of the Netherlands related to climate change

Climate change in the Netherlands is already affecting the country. The average temperature in the Netherlands rose by more than 2 °C from 1901 to 2020. Climate change has resulted in increased frequency of droughts and heatwaves. Because significant portions of the Netherlands have been reclaimed from the sea or otherwise are very near sea level, the Netherlands is very vulnerable to sea level rise.

<span class="mw-page-title-main">Net zero emissions</span> Rate of human-caused greenhouse gas emissions

Global net zero emissions, or simply net zero, is a state in which human-caused emissions are balanced by human-caused carbon dioxide removals over a specified time period. In some contexts, "emissions" refers to emissions of all greenhouse gases, and in other contexts it refers only to emissions of carbon dioxide.

References

  1. 1 2 3 4 5 6 "2021 UK Greenhouse Gas Emissions, Final Figures" (PDF). BEIS. 7 February 2023.
  2. 1 2 "Analysis: Which countries are historically responsible for climate change?". Carbon Brief. 5 October 2021. Retrieved 10 October 2021.
  3. Harrabin, Roger (5 February 2019). "Climate change: UK CO2 emissions fall again" . Retrieved 5 January 2020.
  4. 1 2 3 "Final UK greenhouse gas emissions national statistics: 1990 to 2019". gov.uk. Retrieved 30 March 2021.
  5. Ritchie, Hannah; Roser, Max; Rosado, Pablo (11 May 2020). "CO₂ and Greenhouse Gas Emissions". Our World in Data.
  6. "Carbon footprint for the UK and England to 2019". GOV.UK. Retrieved 24 August 2022.
  7. "UK average footprint". www.carbonindependent.org. Retrieved 24 August 2022.
  8. Harrabin, Roger (12 June 2019). "UK commits to 'net zero' emissions by 2050". BBC News. Retrieved 26 January 2020.
  9. "Net zero: economy and jobs". Energy & Climate Intelligence Unit. Retrieved 5 January 2020.
  10. "UK sets ambitious new climate target ahead of UN Summit". gov.ul. Retrieved 30 March 2021.
  11. "2019 Progress Report to Parliament". Climate Change Committee. Retrieved 23 December 2022.
  12. Ng, Gabriel (23 January 2021). "Introducing the UK Emissions Trading System". Cherwell. Retrieved 2 February 2021.
  13. "Where Britain's journey to insulation went wrong". the Guardian . 19 April 2022. Retrieved 20 April 2022.
  14. "2022 Progress Report to Parliament". Climate Change Committee. Retrieved 24 August 2022.
  15. "UK Scales Back £1 Billion Funding to Help Homes Cut Energy Use". Bloomberg.com. 29 July 2022. Retrieved 30 August 2022.
  16. "UK must insulate homes or face a worse energy crisis in 2023, say experts". the Guardian. 11 September 2022. Retrieved 12 September 2022.
  17. "Carbon footprint for the UK and England to 2020". GOV.UK. Retrieved 11 August 2023.
  18. "Cumulative CO2 emissions globally by country 2019". Statista. Retrieved 30 March 2021.
  19. 1 2 3 "2020 UK greenhouse gas emissions, provisional figures" (PDF). 21 March 2021.
  20. "Jet Zero strategy: delivering net zero aviation by 2050". GOV.UK. Retrieved 1 March 2023.
  21. "Oil & gas extraction enterprises UK 2021, by turnover". Statista. Retrieved 16 January 2022.
  22. "UK: Gov't, Oil Industry Strike North Sea Deal to Protect Jobs in Green Energy Transition". Offshore Engineer Magazine. 24 March 2021. Retrieved 30 March 2021.
  23. "UK's gas power plans risk derailing climate targets, thinktank says". the Guardian. 25 February 2021. Retrieved 30 March 2021.
  24. "Green groups dispute power station claim that biomass is carbon-neutral". the Guardian. 23 March 2021. Retrieved 2 April 2021.
  25. Europe's Great Coal Collapse of 2019 Sandbag UK 18 September 2019
  26. "Equinor, SSE Thermal acquire Triton Power preparing for transition to hydrogen - Green Hydrogen News". energynews.biz. 28 June 2022.
  27. "Half UK's true carbon footprint created abroad, research finds". the Guardian. 16 April 2020. Retrieved 16 January 2022.
  28. "Green energy measures saving households £1,000 a year – analysis". the Guardian. 28 January 2022. Retrieved 28 January 2022.
  29. "'Major misjudgment': how the Tories got their energy strategy so wrong". the Guardian. 6 April 2022. Retrieved 9 April 2022.
  30. "Climate change: Will competing NI bills cause political wrangle?". BBC News. 27 March 2021. Retrieved 27 March 2021.
  31. 1 2 3 "Agri-climate report 2021". gov.uk. Retrieved 16 January 2022.
  32. SUMMARY IUCN UK Commission of Inquiry on Peatlands Summary of Findings October 2011
  33. "Garden centres 'failing to stop peat sales'". BBC News. 2 April 2021. Retrieved 2 April 2021.
  34. Stafford, R., Chamberlain, B., Clavey, L., Gillingham, P. K., McKain, S., Morecroft, M. D., Morrison-Bell, C. and Watts, O. (Eds.) (2021). Nature-based Solutions for Climate Change in the UK: A Report by the British Ecological Society . London, UK. Available at: www.britishecologicalsociety.org/nature-based-solutions
  35. "The Ocean: Turning the Tide on Climate Change" (PDF).
  36. "2018 UK Greenhouse gas emissions, Provisional figures" (PDF). 28 March 2019. Retrieved 12 January 2020.
  37. "2019 UK Greenhouse gas emissions, Provisional figures". 26 March 2020. Retrieved 2 September 2020.
  38. defra Archived 26 September 2007 at the Wayback Machine , published January 2006.
  39. Environmental Change Institute (ECI) - Oxford University Archived 23 February 2010 at the Wayback Machine . Eci.ox.ac.uk (2006-10-24). Retrieved on 2010-11-04.
  40. Harrabin, Roger (2 May 2019). "UK 'can cut emissions to nearly zero'" . Retrieved 2 May 2019.
  41. Shepheard, Marcus. "UK net zero target". Institute for government. Retrieved 29 December 2020.
  42. "Carbon budgets: how we monitor emissions targets". committee on climate change. Retrieved 8 January 2020.
  43. Carbon budgets - Department of Energy and Climate Change. Decc.gov.uk. Retrieved on 2010-11-04.
  44. Black, Richard (9 March 2010). "Third of EU emissions 'imported'". BBC News.
  45. "Carbon footprint for the UK and England to 2019". GOV.UK. Retrieved 24 August 2022.
  46. "Updated: Electric car grant cut to £2,500 and eligibility changed". www.fleetnews.co.uk. Retrieved 30 March 2021.
  47. Ramey, Jay (25 March 2021). "Businesses Buy More EVs in the UK than Do Individuals". Autoweek. Retrieved 30 March 2021.
  48. "Electric vehicle RVs to dip, but 'no cliff edge' anticipated". www.fleetnews.co.uk. Retrieved 30 March 2021.
  49. "Best used electric cars 2021". CAR Magazine. Retrieved 30 March 2021.
  50. Harrabin, Roger (24 September 2020). "Low tax on heating is bad for climate, report says". BBC News. Retrieved 24 September 2020.
  51. "Policy briefing: Get ready for the UK's emissions trading scheme". www.endsreport.com. Retrieved 2 February 2021.
  52. Department of Business, Energy and Industrial Strategy, Participating in the UK Emissions Trading Scheme (UK ETS), published 17 December 2021, accessed 15 January 2021
  53. Ng, Gabriel (23 January 2021). "Introducing the UK Emissions Trading System". Cherwell. Retrieved 2 February 2021.
  54. "Decarbonising Transport Setting the Challenge" (PDF). 2020.
  55. "Reducing GHG Emissions in the UK with 57% by 2030". www.greenmatch.co.uk. Retrieved 16 January 2022.
  56. "BBC Radio 4 - Sliced Bread, Air Source Heat Pumps". BBC. Retrieved 30 April 2022.
  57. "Can heat pumps free Europe from Russian gas dependency?". Energy Monitor. 28 April 2022. Retrieved 30 April 2022.
  58. Turns, Anna (23 February 2023). "Recapturing excess heat could power most of Europe, say experts". The Guardian. ISSN   0261-3077 . Retrieved 1 March 2023.
  59. "British farmers 'planning to ramp up net-zero investments as part of Covid-19 recovery'". edie.net. Retrieved 30 March 2021.