Science of measurement and description of features which affect maritime activities
For broader coverage of this topic, see Hydrography.
A nostalgic 1985 sketch of hydrographic surveying in Alaska.A ship for updating nautical charts.Neptune, a privately owned survey ship based in Chicago, Illinois.Clintons Northern Storm in the harbour of Ystad 7 July 2021.
Hydrographic survey is the science of measurement and description of features which affect maritime navigation, marine construction, dredging, offshore wind farms, offshore oil exploration and drilling and related activities. Surveys may also be conducted to determine the route of subsea cables such as telecommunications cables, cables associated with wind farms, and HVDC power cables. Strong emphasis is placed on soundings, shorelines, tides, currents, seabed and submerged obstructions that relate to the previously mentioned activities. The term hydrography is used synonymously to describe maritime cartography, which in the final stages of the hydrographic process uses the raw data collected through hydrographic survey into information usable by the end user.
Hydrography is collected under rules which vary depending on the acceptance authority. Traditionally conducted by ships with a sounding line or echo sounding, surveys are increasingly conducted with the aid of aircraft and sophisticated electronic sensor systems in shallow waters.[citation needed]
Offshore survey is a specific discipline of hydrographic survey primarily concerned with the description of the condition of the seabed and the condition of the subsea oilfield infrastructure that interacts with it.
Hydrographic offices evolved from naval heritage and are usually found within national naval structures, for example Spain's Instituto Hidrográfico de la Marina.[1] Coordination of those organizations and product standardization is voluntarily joined with the goal of improving hydrography and safe navigation is conducted by the International Hydrographic Organization (IHO). The IHO publishes Standards and Specifications[2] followed by its Member States as well as Memoranda of Understanding and Co-operative Agreements[3] with hydrographic survey interests.
The product of such hydrography is most often seen on nautical charts published by the national agencies and required by the International Maritime Organization (IMO),[4] the Safety of Life at Sea (SOLAS)[5] and national regulations to be carried on vessels for safety purposes. Increasingly those charts are provided and used in electronic form unders IHO standards.
Non-national agencies
Governmental entities below the national level conduct or contract for hydrographic surveys for waters within their jurisdictions with both internal and contract assets. Such surveys commonly are conducted by national organizations or under their supervision or the standards they have approved, particularly when the use is for the purposes of chart making and distribution or the dredging of state-controlled waters.
In the United States, there is coordination with the National Hydrography Dataset in survey collection and publication.[6] State environmental organizations publish hydrographic data relating to their mission.[7]
Private organizations
Commercial entities also conduct large-scale hydrographic and geophysical surveying, particularly in the dredging, marine construction, oil exploration, and drilling industries. Industrial entities installing submarine communications cables[8] or power[9] require detailed surveys of cable routes prior to installation and increasingly use acoustic imagery equipment previously found only in military applications when conducting their surveys.[10] Specialized companies exist that have both the equipment and expertise to contract with both commercial and governmental entities to perform such surveys .
Companies, universities, and investment groups will often fund hydrographic surveys of public waterways prior to developing areas adjacent those waterways. Survey firms are also contracted to survey in support of design and engineering firms that are under contract for large public projects.[11] Private surveys are also conducted before dredging operations and after these operations are completed. Companies with large private slips, docks, or other waterfront installations have their facilities and the open water near their facilities surveyed regularly, as do islands in areas subject to variable erosion such as in the Maldives.
The history of hydrographic surveying dates almost as far back as that of sailing.[12] For many centuries, a hydrographic survey required the use of lead lines – ropes or lines with depth markings attached to lead weights to make one end sink to the bottom when lowered over the side of a ship or boat – and sounding poles, which were poles with depth markings which could be thrust over the side until they touched bottom. In either case, the depths measured had to be read manually and recorded, as did the position of each measurement with regard to mapped reference points as determined by three-point sextant fixes. The process was labor-intensive and time-consuming and, although each individual depth measurement could be accurate, even a thorough survey as a practical matter could include only a limited number of sounding measurements relative to the area being surveyed, inevitably leaving gaps in coverage between soundings.[12]
In 1904, wire-drag surveys were introduced into hydrography, and the United States Coast and Geodetic Survey′s Nicholas H. Heck played a prominent role in developing and perfecting the technique between 1906 and 1916.[13] In the wire-drag method, a wire attached to two ships or boats and set at a certain depth by a system of weights and buoys was dragged between two points. If the wire encountered an obstruction, it would become taut and form a "V" shape. The location of the "V" revealed the position of submerged rocks, wrecks, and other obstructions, while the depth at which the wire was set showed the depth at which the obstruction was encountered.[12] This method revolutionized hydrographic surveying, as it allowed a quicker, less laborious, and far more complete survey of an area than did the use of lead lines and sounding poles. From a navigational safety point of view, a wire-drag survey would not miss a hazard to navigation that projected above the drag wire depth.
Principle of sea surveying with two boats, Norwegian Sea Survey, 1932.
Technical details of tools used, Norwegian Sea Survey, 1930.
Prior to the advent of sidescan sonar, wire-drag surveying was the only method for searching large areas for obstructions and lost vessels and aircraft.[14] Between 1906 and 1916, Heck expanded the capability of wire-drag systems from a relatively limited area to sweeps covering channels 2 to 3 nautical miles (3.7 to 5.6km; 2.3 to 3.5mi) in width.[15] The wire-drag technique was a major contribution to hydrographic surveying during much of the rest of the 20th century. So valuable was wire-drag surveying in the United States that for decades the U.S. Coast and Geodetic Survey, and later the National Oceanic and Atmospheric Administration, fielded a pair of sister ships of identical design specifically to work together on such surveys. USC&GS Marindin and USC&GS Ogden conducted wire-drag surveys together from 1919 to 1942, USC&GS Hilgard (ASV 82) and USC&GS Wainwright (ASV 83) took over from 1942 to 1967, and USC&GS Rude (ASV 90) (later NOAAS Rude (S 590)) and USC&GS Heck (ASV 91) (later NOAAS Heck (S 591)) worked together on wire-drag operations from 1967.[12][14][16][17][18][19]
The rise of new electronic technologies – sidescan sonar and multibeam swath systems – in the 1950s, 1960s and 1970s eventually made the wire-drag system obsolete. Sidescan sonar could create images of underwater obstructions with the same fidelity as aerial photography, while multibeam systems could generate depth data for 100 percent of the bottom in a surveyed area. These technologies allowed a single vessel to do what wire-drag surveying required two vessels to do, and wire-drag surveys finally came to an end in the early 1990s.[12][15] Vessels were freed from working together on wire-drag surveys, and in the U.S. National Oceanic and Atmospheric Administration (NOAA), for example, Rude and Heck operated independently in their later years.[14][19]
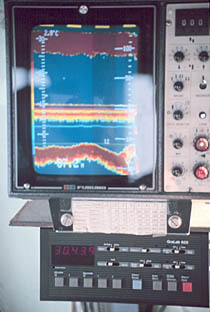
Single-beam echosounders and fathometers began to enter service in the 1930s which used sonar to measure the depth beneath a vessel. This greatly increased the speed of acquiring sounding data over that possible with lead lines and sounding poles by allowing information on depths beneath a vessel to be gathered in a series of lines spaced at a specified distance. However, it shared the weakness of earlier methods by lacking depth information for areas in between the strips of sea bottom the vessel sounded.[12]
This section duplicates the scope of other articles, specifically Multibeam echosounder. Please discuss this issue on the talk page and edit it to conform with Wikipedia's Manual of Style by replacing the section with a link and a summary of the repeated material or by spinning off the repeated text into an article in its own right.(January 2023)
A multibeam echosounder (MBES) is a type of sonar that is used to map the seabed. It emits acoustic waves in a fan shape beneath its transceiver. The time it takes for the sound waves to reflect off the seabed and return to the receiver is used to calculate the water depth. Unlike other sonars and echo sounders, MBES uses beamforming to extract directional information from the returning soundwaves, producing a swath of depth soundings from a single ping.
Explicit inclusion of phraseology like: "For all MBES surveys for LINZ, high resolution, geo-referenced backscatter intensity is to be logged and rendered as a survey deliverable."[20] in a set of contract survey requirements, is a clear indication that the wider hydrographic community is embracing the benefits that can be accrued by employing MBES technology and, in particular, are accepting as a fact that a MBES which provides acoustic backscatter data is a valuable tool of the trade.[citation needed][clarification needed]
The introduction of multispectral multibeam echosounders[21] continues the trajectory of technological innovations providing the hydrographic surveying community with better tools for more rapidly acquiring better data for multiple uses. A multispectral multibeam echosounder is the culmination of many progressive advances in hydrography from the early days of acoustic soundings when the primary concern about the strength of returning echoes from the bottom was whether, or not, they would be sufficiently large to be noted (detected). The operating frequencies of the early acoustic sounders were primarily based on the ability of magneostrictive and piezoelectric materials whose physical dimensions could be modified by means of electrical current or voltage. Eventually it became apparent, that while the operating frequency of the early single vertical beam acoustic sounders had little, or no, bearing on the measured depths when the bottom was hard (composed primarily of sand, pebbles, cobbles, boulders, or rock), there was a noticeable frequency dependency of the measured depths when the bottom was soft (composed primarily of silt, mud or flocculent suspensions).[22] It was observed that higher frequency single vertical beam echosounders could provide detectable echo amplitudes from high porosity sediments, even if those sediments appeared to be acoustically transparent at lower frequencies.
In the late 1960s, single-beam hydrographic surveys were conducted using widely spaced track lines and the shallow (peak) soundings in the bottom data were retained in preference to deeper soundings in the sounding record. During that same time period, early side scan sonar was introduced into the operational practices of shallow water hydrographic surveying. The frequencies of the early side scan sonars were a matter of engineering design expediency and the most important aspect of the side scanning echoes was not the value of their amplitudes, but rather that the amplitudes were spatially variable. In fact, important information was deduced about the shape of the bottom and manmade items on the bottom, based on the regions where there were absences of detectable echo amplitudes (shadows)[23] In 1979, in hopes of a technological solution to the problems of surveying in "floating mud", the Director of the National Ocean Survey (NOS) established a NOS study team to conduct investigations to determine the functional specifications for a replacement shallow water depth sounder.[24] The outcome of the study was a class of vertical-beam depth sounders, which is still widely used. It simultaneously pinged at two acoustic frequencies, separated by more than 2 octaves, making depth and echo-amplitude measurements that were concurrent, both spatially and temporally, albeit at a single vertical grazing angle.[clarification needed]
The first MBES generation was dedicated to mapping the seafloor in deep water. Those pioneering MBES made little, or no, explicit use of the amplitudes, as their objective was to obtain accurate measurements of the bathymetry (representing both the peaks and deeps). Furthermore, their technical characteristics did not make it easy to observe spatial variations in the echo amplitudes.[25] Subsequent to the early MBES bathymetric surveys and at the time when single frequency side scan sonar had begun to produce high quality images of the seabed that were capable of providing a degree of discrimination between different types of sediments, the potential of the echo amplitudes from a MBES was recognized.[26]
With Marty Klein's introduction of dual frequency (nominally 100kHz and 500kHz) side scan sonar, it was apparent that spatially and temporally coincident backscatter from any given seabed at those two widely separated acoustic frequencies, would likely provide two separate and unique images of that seascape. Admittedly, the along-track insonification and receiving beam patterns were different, and due to the absence of bathymetric data, the precise backscatter grazing angles were unknown. However, the overlapping sets of side scanning across-track grazing angles at the two frequencies were always the same.[clarification needed]
Following the grounding of the Queen Elizabeth 2 off Cape Cod, Massachusetts, in 1992,[27] the emphasis for shallow water surveying migrated toward full bottom coverage surveys by employing MBES with increasing operating frequencies to further improve the spatial resolution of the soundings. Given that side scan sonar, with its across-track fan-shaped swath of insonification, had successfully exploited the cross-track variation in echo amplitudes, to achieve high quality images of the seabed, it seemed a natural progression that the fan-shaped across-track pattern of insonification associated with the new monotone higher frequency shallow water MBES, might also be exploited for seabed imagery. Images acquired under the initial attempts at MBES bottom imaging were less than stellar, but fortunately improvements were forthcoming.
Side scan sonar parses the continual echo returns from a receive beam that is perfectly aligned with the insonification beam using time-after-transmit, a technique that is independent of water depth and the cross-track beam opening angle of the sonar receive transducer. The initial attempt at multibeam imagery employed multiple receive beams, which only partially overlapped the MBES fan-shaped insonification beam, to segment the continual echo returns into intervals that were dependent on water depth and receiver cross-track beam opening angle. Consequently, the segmented intervals were non-uniform in both their length of time and time-after-transmit. The backscatter from each ping in each of the beam-parsed segments was reduced to a single value and assigned to the same geographical coordinates as those assigned to that beam's measured sounding. In subsequent modifications to MBES bottom imaging, the echo sequence in each of the beam-parsed intervals was designated as a snippet.[28] On each ping, each snippet from each beam was additionally parsed according to time-after-transmit. Each of the echo amplitude measurements made within a snippet from a particular beam was assigned a geographical position based on linear interpolation between positions assigned to the soundings measured, on that ping, in the two adjacent cross-track beams. The snippet modification to MBES imagery significantly improved the quality of the imagery by increasing the number of echo amplitude measurements available to be rendered as a pixel in the image and also by having a more uniform spatial distribution of the pixels in the image which represented an actual measured echo amplitude.
The introduction of multispectral multibeam echosounders[clarification needed][29] continued the progressive advances in hydrography. In particular, multispectral multibeam echosounders not only provide "multiple look" depth measurements of a seabed, they also provide multispectral backscatter data that are spatially and temporally coincident with those depth measurements. A multispectral multibeam echosounder directly computes a position of origin for each of the backscatter amplitudes in the output data set. Those positions are based on the backscatter measurements themselves and not by interpolation from some other derived data set. Consequently, multispectral multibeam imagery is more acute compared to previous multibeam imagery. The inherent precision of the bathymetric data from a multispectral multibeam echosounder is also a benefit to those users that may be attempting to employ the acoustic backscatter angular response function to discriminate between different sediment types. Multispectral multibeam echosounders reinforces the fact that spatially and temporally coincident backscatter, from any given seabed, at widely separated acoustic frequencies provides separate and unique images of the seascape.[30]
Crowdsourcing also is entering hydrographic surveying, with projects such as OpenSeaMap,[31]TeamSurv and ARGUS. Here, volunteer vessels record position, depth, and time data using their standard navigation instruments, and then the data is post-processed to account for speed of sound, tidal, and other corrections. With this approach there is no need for a specific survey vessel, or for professionally qualified surveyors to be on board, as the expertise is in the data processing that occurs once the data is uploaded to the server after the voyage. Apart from obvious cost savings, this also gives a continuous survey of an area, but the drawbacks are time in recruiting observers and getting a high enough density and quality of data. Although sometimes accurate to 0.1 – 0.2m, this approach cannot substitute for a rigorous systematic survey, where this is required. Nevertheless, the results are often adequate for many requirements where high resolution, high accuracy surveys are not required, are unaffordable or simply have not been done yet.
The General Bathymetric Chart of the Oceans (GEBCO) is a publicly available bathymetric chart of the world's oceans. The project was conceived with the aim of preparing a global series of charts showing the general shape of the seafloor. Over the years it has become a reference map of the bathymetry of the world's oceans for scientists and others.
Modern integrated hydrographic surveying
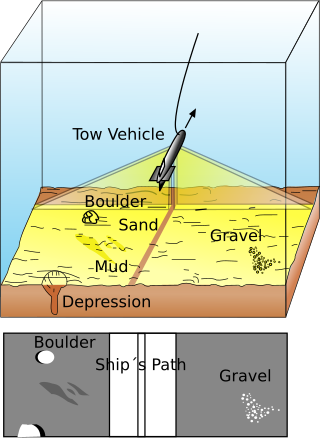
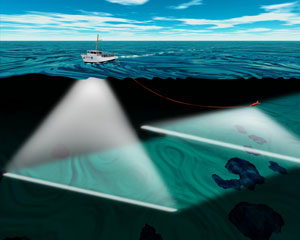
Graphic depicting NOAA hydrographic survey ship conducting multibeam and side scan sonar operations
In suitable shallow-water areas lidar (light detection and ranging) may be used.[32] Equipment can be installed on inflatable craft, such as Zodiacs, small craft, autonomous underwater vehicles (AUVs), unmanned underwater vehicles (UUVs), Remote Operated Vehicles (ROV) or large ships, and can include sidescan, single-beam and multibeam equipment.[33] At one time different data collection methods and standards were used in collecting hydrographic data for maritime safety and for scientific or engineering bathymetric charts, but increasingly, with the aid of improved collection techniques and computer processing, the data is collected under one standard and extracted for specific use.
After data is collected, it has to undergo post-processing. A massive amount of data is collected during the typical hydrographic survey, often several soundings per square foot. Depending on the final use intended for the data (for example, navigation charts, Digital Terrain Model, volume calculation for dredging, topography, or bathymetry) this data must be thinned out.[clarification needed] It must also be corrected for errors (i.e., bad soundings,) and for the effects of tides, heave, water level[34][35][36]salinity and thermoclines (water temperature differences) as the velocity of sound varies with temperature and salinity and affects accuracy. Usually the surveyor has additional data collection equipment on site to measure and record the data required for correcting the soundings. The final output of charts can be created with a combination of specialty charting software or a computer-aided design (CAD) package, usually Autocad.[citation needed]
Although the accuracy of crowd-sourced surveying can rarely reach the standards of traditional methods, the algorithms used rely on a high data density to produce final results that are more accurate than single measurements. A comparison of crowd-sourced surveys with multibeam surveys indicates an accuracy of crowd-sourced surveys of around plus or minus 0.1 to 0.2 meter (about 4 to 8 inches).[citation needed]
See also
Bathymetry– Study of underwater depth of lake or ocean floors
Bathymetric chart– Map depicting the submerged terrain of bodies of water
Echo sounding– Measuring the depth of water by transmitting sound waves into water and timing the return
The Challenger Deep is the deepest known point of the seabed of Earth, located in the western Pacific Ocean at the southern end of the Mariana Trench, in the ocean territory of the Federated States of Micronesia. According to the GEBCO Gazetteer of Undersea Feature Names the depression's depth is 10,920 ± 10 m (35,827 ± 33 ft) at 11°22.4′N142°35.5′E, although its exact geodetic location remains inconclusive and its depth has been measured at 10,902–10,929 m (35,768–35,856 ft) by deep-diving submersibles, remotely operated underwater vehicles and benthic landers, and (sometimes) slightly more by sonar bathymetry. The differences in depth estimates and their geodetic positions are scientifically explainable by the difficulty of researching such deep locations.
Sonar is a technique that uses sound propagation to navigate, measure distances (ranging), communicate with or detect objects on or under the surface of the water, such as other vessels.
Side-scan sonar is a category of sonar system that is used to efficiently create an image of large areas of the sea floor.
Hydrography is the branch of applied sciences which deals with the measurement and description of the physical features of oceans, seas, coastal areas, lakes and rivers, as well as with the prediction of their change over time, for the primary purpose of safety of navigation and in support of all other marine activities, including economic development, security and defense, scientific research, and environmental protection.
Echo sounding or depth sounding is the use of sonar for ranging, normally to determine the depth of water (bathymetry). It involves transmitting acoustic waves into water and recording the time interval between emission and return of a pulse; the resulting time of flight, along with knowledge of the speed of sound in water, allows determining the distance between sonar and target. This information is then typically used for navigation purposes or in order to obtain depths for charting purposes.
A bathymetric chart is a type of isarithmic map that depicts the submerged topography and physiographic features of ocean and sea bottoms. Their primary purpose is to provide detailed depth contours of ocean topography as well as provide the size, shape and distribution of underwater features. Topographic maps display elevation above ground and are complementary to bathymetric charts. Charts use a series of lines and points at equal intervals to showcase depth or elevation. A closed shape with increasingly smaller shapes inside of it can indicate an ocean trench or a seamount, or underwater mountain, depending on whether the depths increase or decrease going inward.
Bathymetry is the study of underwater depth of ocean floors, lake floors, or river floors. In other words, bathymetry is the underwater equivalent to hypsometry or topography. The first recorded evidence of water depth measurements are from Ancient Egypt over 3000 years ago. Bathymetric charts, are typically produced to support safety of surface or sub-surface navigation, and usually show seafloor relief or terrain as contour lines and selected depths (soundings), and typically also provide surface navigational information. Bathymetric maps may also use a Digital Terrain Model and artificial illumination techniques to illustrate the depths being portrayed. The global bathymetry is sometimes combined with topography data to yield a global relief model. Paleobathymetry is the study of past underwater depths.
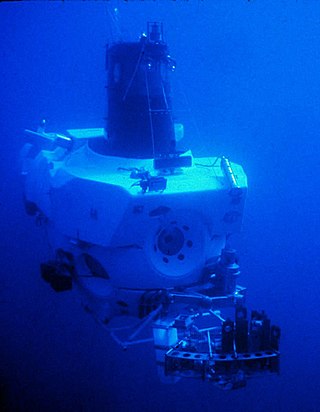
A survey vessel is any type of ship or boat that is used for underwater surveys, usually to collect data for mapping or planning underwater construction or mineral extraction. It is a type of research vessel, and may be designed for the purpose, modified for the purpose or temporarily put into the service as a vessel of opportunity, and may be crewed, remotely operated, or autonomous. The size and equipment vary to suit the task and availability.
A scientific echosounder is a device which uses sonar technology for the calibrated backscatter measurement of underwater physical and biological components—this device is also known as scientific sonar. Applications include bathymetry, substrate classification, studies of aquatic vegetation, fish, and plankton, and differentation of water masses.
A multibeam echosounder (MBES) is a type of sonar that is used to map the seabed. It emits acoustic waves in a fan shape beneath its transceiver. The time it takes for the sound waves to reflect off the seabed and return to the receiver is used to calculate the water depth. Unlike other sonars and echo sounders, MBES uses beamforming to extract directional information from the returning soundwaves, producing a swathe of depth soundings from a single ping.
NOAAS Thomas Jefferson is a National Oceanic and Atmospheric Administration (NOAA) hydrographic survey vessel in service since 2003. The ship was built for the United States Navy as USNS Littlehales (T-AGS-52) serving as one of two new coastal hydrographic survey vessels from 1992 until transfer to NOAA in 2003 when it was named after Founding Father and third U.S. president, Thomas Jefferson.
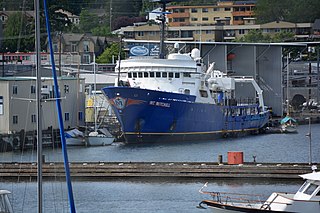
NOAAS Mount Mitchell was an American survey vessel in commission in the National Oceanic and Atmospheric Administration from 1970 to 1995. Prior to her NOAA career, she was in commission in the United States Coast and Geodetic Survey as USC&GS Mount Mitchell from 1968 to 1970. In 2003, she returned to service as the private research ship R/V Mt. Mitchell.
Acoustic seabed classification is the partitioning of a seabed acoustic image into discrete physical entities or classes. This is a particularly active area of development in the field of seabed mapping, marine geophysics, underwater acoustics and benthic habitat mapping. Seabed classification is one route to characterizing the seabed and its habitats. Seabed characterization makes the link between the classified regions and the seabed physical, geological, chemical or biological properties. Acoustic seabed classification is possible using a wide range of acoustic imaging systems including multibeam echosounders, sidescan sonar, single-beam echosounders, interferometric systems and sub-bottom profilers. Seabed classification based on acoustic properties can be divided into two main categories; surficial seabed classification and sub-surface seabed classification. Sub-surface imaging technologies use lower frequency sound to provide higher penetration, whereas surficial imaging technologies provide higher resolution imagery by utilizing higher frequencies.
Fisheries acoustics includes a range of research and practical application topics using acoustical devices as sensors in aquatic environments. Acoustical techniques can be applied to sensing aquatic animals, zooplankton, and physical and biological habitat characteristics.
Depth sounding, often simply called sounding, is measuring the depth of a body of water. Data taken from soundings are used in bathymetry to make maps of the floor of a body of water, such as the seabed topography.
NOAAS Whiting, was an American survey ship that was in commission in the National Oceanic and Atmospheric Administration (NOAA) from 1970 to 2003. Previously, she had been in commission in the United States Coast and Geodetic Survey from 1963 to 1970 as USC&GS Whiting.
Captain Nicholas Hunter Heck was a career officer of the United States Coast and Geodetic Survey Corps. A leading geophysicist of his time, Heck made important contributions in the study of seismology and oceanography. He also revolutionized hydrographic surveying by developing the wire-drag surveying technique and introduced radio acoustic ranging into Coast and Geodetic Survey hydrography.
The Dienst der Hydrografie is, as part of the Royal Netherlands Navy, the Dutch Hydrographic Service responsible for surveying and charting Dutch waters in Europe and the Caribbean.
An underwater survey is a survey performed in an underwater environment or conducted remotely on an underwater object or region. Survey can have several meanings. The word originates in Medieval Latin with meanings of looking over and detailed study of a subject. One meaning is the accurate measurement of a geographical region, usually with the intention of plotting the positions of features as a scale map of the region. This meaning is often used in scientific contexts, and also in civil engineering and mineral extraction. Another meaning, often used in a civil, structural, or marine engineering context, is the inspection of a structure or vessel to compare actual condition with the specified nominal condition, usually with the purpose of reporting on the actual condition and compliance with, or deviations from, the nominal condition, for quality control, damage assessment, valuation, insurance, maintenance, and similar purposes. In other contexts it can mean inspection of a region to establish presence and distribution of specified content, such as living organisms, either to establish a baseline, or to compare with a baseline.
Underwater exploration is the exploration of any underwater environment, either by direct observation by the explorer, or by remote observation and measurement under the direction of the investigators. Systematic, targeted exploration is the most effective method to increase understanding of the ocean and other underwater regions, so they can be effectively managed, conserved, regulated, and their resources discovered, accessed, and used. Less than 10% of the ocean has been mapped in any detail, less has been visually observed, and the total diversity of life and distribution of populations is similarly obscure.
↑ New Zealand Hydrographic Authority, (2016), Ver. 1.3 of Contract Specifications for Hydrographic Surveys, Land Information New Zealand
↑ Costa, B., (2019), Multispectral acoustic backscatter: How useful is it for marine habitat mapping and management?, Journal of Coastal Research, 35(5), pp 1062-1079
↑ Owaki, N., (1963), A note on depth when the bottom is soft mud, International Hydrographic Review, XL, No. 2, pp 41-43
↑ Fish, J. P., & Carr, H., A., (1990), Sound underwater images: A guide to the generation and interpretation of side scan sonar dat. Orleans, MA: Lower Cape Pub.
↑ Huff, L. C. (1981), A Study of Future Depth Recorder Requirements, International Hydrographic Review, LVIII (2)
↑ Lurton, X., (2010), An Introduction into Underwater Acoustics: Principles and Applications, 2nd ed, ISBN978-3540784807, Springer
↑ deMoustier, C., (1986), Beyond bathymetry: Mapping acoustic backscattering from the deep seafloor with Sea Beam, JASA Vol 79, pp 316-331
↑ Lockhart, D., Saade, E., and Wilson, J., (2001) New Developments in Multibeam Backscatter Data Collection and Processing, Marine Technology Society Journal Vol. 35, pp 46-50.
↑ Brown, C. et al., (2018), Multispectral Multibeam Echo Sounder Backscatter as a Tool for Improved Seafloor Characterization, Geosciences 8, 455
↑ Gaida, T, C., et al., (2019) Mapping the Seabed and Shallow Subsurface with Multi-Frequency Multibeam Echosounders, Remote Sens. 12, 52
↑ "Heave Compensation For Hydrographic Surveying"(PDF). Coastal Engineering Technical Note. Vicksburg, Mississippi: U.S. Army Engineer Waterways Experiment Station, Coastal Engineering Research Center. March 1985. Archived from the original(PDF) on 14 June 2007.
This page is based on this Wikipedia article Text is available under the CC BY-SA 4.0 license; additional terms may apply. Images, videos and audio are available under their respective licenses.