International Fujita scale

Last updated

The International Fujita scale (abbreviated as IF-Scale) rates the intensity of tornadoes and other wind events based on the severity of the damage they cause. [1] It is used by the European Severe Storms Laboratory (ESSL) and various other organizations including Deutscher Wetterdienst (DWD) and State Meteorological Agency (AEMET). The scale is intended to be analogous to the Fujita and Enhanced Fujita scales, while being more applicable internationally by accounting for factors such as differences in building codes.

Contents

In 2018, the first draft version of the IF-scale, version 0.10 was published. This version was based on a 12-step rating scale. Over the next few years, dozens of tornadoes would be rated on this version of the scale. Most notably, the 2021 South Moravia tornado received a rating (IF4) and full damage survey on the IF-scale conducted by ESSL, the Czech Hydrometeorological Institute and four other organizations. [2] On May 6, 2023, version 0.99.9d was published, which changed it to a 9-step rating scale. [3] In late July 2023, the first official version of the IF scale was published. [4]

2018 version

Tornado rating classifications [5]
IF0-IF0IF0+IF1-IF1IF1+IF2-IF2IF2+IF3IF4IF5
WeakStrongViolent
Significant
Intense

Parameters

The 12 categories for the International Fujita scale are listed below, in order of increasing intensity. Although the wind speeds and photographic damage examples are updated, which are more or less still accurate. However, for the actual IF-scale in practice, damage indicators (the type of structure which has been damaged) are predominantly used in determining the tornado intensity. The IF-scale steps are defined by a central value and an error. The errors have been estimated to be 30% of the central value, resulting in overlapping speed ranges. The distances between the central values of the steps have been so chosen that the upper bound exceeds the central value of the next step, ensuring a balance between the resolution of the scale and the expected errors. Since ESSL required that the steps be consistent with the original Fujita scale, they introduced steps with – and + suffixes indicating steps one third higher or lower than the central value of the original scale, e.g. F1- equals "F2 - 1⁄3F2" and F2+ equals "F2 + 1⁄3F2". Above F2, such a subdivision was not introduced and only full steps are used.

ScaleWind speed
(Estimated)
mphkm/hm/s
IF0-45 ± 1472 ± 2220 ± 6
IF056 ± 1790 ± 2725 ± 7
IF0+67 ± 20108 ± 3230 ± 9
IF1-70 ± 24128 ± 3836 ± 11
IF192 ± 28149 ± 4541 ± 12
IF1+106 ± 32170 ± 5147 ± 14
IF2-120 ± 36193 ± 5854 ± 16
IF2135 ± 40217 ± 6560 ± 18
IF2+150 ± 45241 ± 7267 ± 20
IF3182 ± 55293 ± 8881 ± 24
IF4234 ± 70376 ± 113105 ± 31
IF5290 ± 87466 ± 140130 ± 39


2023 version

On May 6, 2023, version 0.99.9d was published, which changed it to a 9-step rating scale. [3] In this version, the wind speed damage indicator was introduced, which made it the first tornado intensity and damage scale to use measured wind speeds and Doppler weather radar measured wind speeds. [3] When the first official publication of the IF scale, the 9-step rating scale was kept. It was noted that each scale's wind speed is to be taken with a 20% error margin on each side of the central value. [4] This was done to ensure the lower or upper bound of the overlapping rating came close to the central value of the other rating. [4]

Tornado rating classifications [5]
IF0IF0.5IF1IF1.5IF2IF2.5IF3IF4IF5
WeakStrongViolent
Significant
Intense
ScaleWind speed
(Estimated)
(Central value; Full range of the 20% error margin)
mphkm/hm/s
IF055; 44–6690; 72–10825; 20–30
IF0.575; 60–90120; 96–14433; 27–40
IF190; 72–108150; 130–18040; 32–48
IF1.5110; 88–132180; 144–21650; 40–60
IF2135; 108–162220; 176–26460; 48–72
IF2.5160; 128–192250; 200–30070; 56–84
IF3180; 144–216290; 232–34880; 64–96
IF4230; 184–276380; 304–456105; 84–126
IF5290; 232–348470; 376–564130; 104–156

Damage indicators, subclasses, and degrees of damage

The IF scale currently has 23 damage indicators (DI), each with a varying number of subclasses and degrees of damage (DoD). [4] [3]

DI Abbr.Damage indicator (DI)SubclassesDegrees of damage
BSBuilding - structureA, AB, B, C, D, E, F0, 1A, 1B, 2
BRBuilding - roofA, AB, B, C, D, E, F0, 1, 2
BNBuilding - non-structural elementsSW, SS, TW, TS, HW, HS0, 1, 2, 3
BMBuilding - anchoringSM, SI, DB1
VHRoad VehiclesC, E, L, T0, 1, 2, 3, 4
TRTreesW, A, S0, 1, 2, 3, 4, 5, 6, 7, 8, 9
TSTree standsWA, S0, 1, 2, 3, 4
WTWind turbinesA, S0, 1, 2, 3
GHGreenhousesW, A, S0, 1, 2, 3
TCTrain carsS, F0, 1
MHMobile homes / Static caravans0, 1, 2, 3, 4, 5
PTPoles and towersW, S, T0, 1, 2
SPSolar Panels0, 1
FCFencesW, S0, 1
FWFree-standing wallsZ, A, AB, B, C, D, E, F1, 2
SNSigns and billboardsT, M0, 1, 2
SWConnected scaffolding1
CPCarports / garages1
SSService Station Canopies0, 1, 2, 3
SCShipping ContainersA, B, C, D, E, F1, 2, 3
CRCranesG, t1, 2
OFOutdoor FurnitureL, H0, 1, 2
WM Wind Speed Measurement See section below See section below

DI: Wind Speed Measurement

A unique feature of the International Fujita scale compared to the Fujita or Enhanced Fujita scale is a new damage indicator based on measured wind speeds. For the IF scale, only wind speeds measured at or below 10 metres (11 yd) can be used to determine a rating. Doppler weather radar measurements are also able to be used to determine a rating if they are measured within damaging distance. For radar measurements, any readings below 60 metres (66 yd) can be used to determine a rating. [4] [3]

Three second measurement

For three-second wind speed measurements, it is assumed to be an average of 88.8% of the three-second measurement. [4] [3]

Degree of Damage (DoD) / Measured IF# SpeedThree Second Measurement
mphkm/hm/s
DoD 0 / IF042.55669911925
DoD 0.5 / IF0.55774.5921202632
DoD 1 / IF173.9901191463340
DoD 1.5 / IF1.5911091471764049
DoD 2 / IF21101291772085057
DoD 2.5 / IF2.5129156.52092425870
DoD 3 / IF3151183.92432966882
DoD 4 / IF418423129737383103
DoD 5 / IF5≥232≥374≥104

Two second measurement

For two-second wind speed measurements, it is assumed to be an average of 90.9% of the two-second measurement. [4] [3]

Degree of Damage (DoD) / Measured IF# SpeedTwo Second Measurement
mphkm/hm/s
DoD 0 / IF043.45870942026
DoD 0.5 / IF0.55974951202733
DoD 1 / IF175931211503440
DoD 1.5 / IF1.593111.81501804250
DoD 2 / IF2111.81321802135159
DoD 2.5 / IF2.51331542142486068
DoD 3 / IF31541882493036984
DoD 4 / IF418823730438285106
DoD 5 / IF5≥238≥383≥107

One second measurement

For one-second wind speed measurements, it is assumed to be an average of 92.5% of the one-second measurement. [4] [3]

Degree of Damage (DoD) / Measured IF# SpeedOne Second Measurement
mphkm/hm/s
DoD 0 / IF044.15871952026
DoD 0.5 / IF0.55976961232734
DoD 1 / IF177941241523542
DoD 1.5 / IF1.5951131531834351
DoD 2 / IF21141341842205260
DoD 2.5 / IF2.51351562182526170
DoD 3 / IF31571912533087185
DoD 4 / IF419224130938886107
DoD 5 / IF5≥241.5≥389≥108

Zero second measurement

For zero-second wind speed measurements, it is assumed to be an instantaneous wind speed measurement. [4] [3] This can only be used if it was 10Hz or higher sample rate. [4] [3] [6]

Degree of Damage (DoD) / Measured IF# SpeedZero Second Measurement
mphkm/hm/s
DoD 0 / IF047.864771032228
DoD 0.5 / IF0.564821041322936
DoD 1 / IF182101.91331643745
DoD 1.5 / IF1.51021231651984655
DoD 2 / IF21241451992345665
DoD 2.5 / IF2.51461692352736675
DoD 3 / IF31702072743337692
DoD 4 / IF420826033442093116
DoD 5 / IF5≥261≥421≥117

See also

Related Research Articles

<span class="mw-page-title-main">Tornado</span> Violently rotating column of air in contact with both the Earths surface and a cumulonimbus cloud

A tornado is a violently rotating column of air that is in contact with both the surface of the Earth and a cumulonimbus cloud or, in rare cases, the base of a cumulus cloud. It is often referred to as a twister, whirlwind or cyclone, although the word cyclone is used in meteorology to name a weather system with a low-pressure area in the center around which, from an observer looking down toward the surface of the Earth, winds blow counterclockwise in the Northern Hemisphere and clockwise in the Southern. Tornadoes come in many shapes and sizes, and they are often visible in the form of a condensation funnel originating from the base of a cumulonimbus cloud, with a cloud of rotating debris and dust beneath it. Most tornadoes have wind speeds less than 180 kilometers per hour, are about 80 meters across, and travel several kilometers before dissipating. The most extreme tornadoes can attain wind speeds of more than 480 kilometers per hour (300 mph), are more than 3 kilometers (2 mi) in diameter, and stay on the ground for more than 100 km (62 mi).

The Fujita scale, or Fujita–Pearson scale, is a scale for rating tornado intensity, based primarily on the damage tornadoes inflict on human-built structures and vegetation. The official Fujita scale category is determined by meteorologists and engineers after a ground or aerial damage survey, or both; and depending on the circumstances, ground-swirl patterns, weather radar data, witness testimonies, media reports and damage imagery, as well as photogrammetry or videogrammetry if motion picture recording is available. The Fujita scale was replaced with the Enhanced Fujita scale (EF-Scale) in the United States in February 2007. In April 2013, Canada adopted the EF-Scale over the Fujita scale along with 31 "Specific Damage Indicators" used by Environment Canada (EC) in their ratings.

<span class="mw-page-title-main">Tornado records</span> List of world records related to tornadoes

This article lists various tornado records. The most "extreme" tornado in recorded history was the Tri-State tornado, which spread through parts of Missouri, Illinois, and Indiana on March 18, 1925. It is considered an F5 on the Fujita Scale, holds records for longest path length at 219 miles (352 km), longest duration at about 3+12 hours, and it held the fastest forward speed for a significant tornado at 73 mph (117 km/h) anywhere on Earth until 2021. In addition, it is the deadliest single tornado in United States history with 695 fatalities. It was also the third most costly tornado in history at the time, when costs are normalized for wealth and inflation, it still ranks third today.

The TORRO tornado intensity scale is a scale measuring tornado intensity between T0 and T11. It was proposed by Terence Meaden of the Tornado and Storm Research Organisation (TORRO), a meteorological organisation in the United Kingdom, as an extension of the Beaufort scale.

<span class="mw-page-title-main">1967 St. Louis tornado outbreak</span>

An extremely rare wintertime tornado outbreak affected the Midwestern United States on January 24, 1967. Of the 30 confirmed tornadoes, 13 occurred in Iowa, nine in Missouri, seven in Illinois, and one in Wisconsin. The outbreak produced, at the time, the northernmost tornado to hit the United States in winter, in Wisconsin, until January 7, 2008. The tornadoes formed ahead of a deep storm system in which several temperature records were broken. The deadliest and most damaging tornado of the outbreak struck Greater St. Louis at F4 intensity, killing three people and injuring 216.

The Enhanced Fujita scale rates tornado intensity based on the severity of the damage they cause. It is used in some countries, including the United States, Canada, France, and Japan.

<span class="mw-page-title-main">Tornado intensity</span> Measurement of strength and severity of tornadoes

Tornado intensity is the measure of wind speeds and potential risk produced by a tornado. Intensity can be measured by in situ or remote sensing measurements, but since these are impractical for wide-scale use, intensity is usually inferred by proxies, such as damage. The Fujita scale, Enhanced Fujita scale, and the International Fujita scale rate tornadoes by the damage caused. In contrast to other major storms such as hurricanes and typhoons, such classifications are only assigned retroactively. Wind speed alone is not enough to determine the intensity of a tornado. An EF0 tornado may damage trees and peel some shingles off roofs, while an EF5 tornado can rip well-anchored homes off their foundations, leaving them bare— even deforming large skyscrapers. The similar TORRO scale ranges from a T0 for extremely weak tornadoes to T11 for the most powerful known tornadoes. Doppler radar data, photogrammetry, and ground swirl patterns may also be analyzed to determine the intensity and assign a rating.

<span class="mw-page-title-main">European Severe Storms Laboratory</span> Organization

The European Severe Storms Laboratory (ESSL) is a scientific organisation that conducts research on severe convective storms, tornadoes, intense precipitation events, and avalanches across Europe and the Mediterranean. It operates the widely consulted European Severe Weather Database (ESWD).

The European Storm Forecast Experiment, known as ESTOFEX, is an initiative of a team of European meteorologists, and students in meteorology founded in 2002. It serves as a platform for exchange of knowledge about forecasting severe convective storms in Europe and elsewhere. It is a voluntary organisation and is currently unfunded. It aims to raise awareness and provide real-time education about severe weather forecasting. ESTOFEX issues storm warnings on a daily basis. It also collects reports from the general public about severe convective weather incidents in order to validate its forecasts. Reports should be submitted to the European Severe Weather Database (ESWD).

The following is a glossary of tornado terms. It includes scientific as well as selected informal terminology.

<span class="mw-page-title-main">Tornadoes of 1973</span>

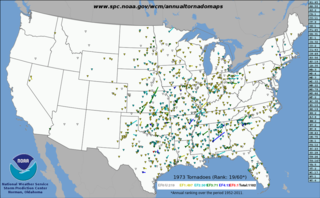
This page documents notable tornadoes and tornado outbreaks worldwide in 1973, but mostly features events in the United States. According to tornado researcher Thomas P. Grazulis, documentation of tornadoes outside the United States was historically less exhaustive, owing to the lack of monitors in many nations and, in some cases, to internal political controls on public information. Most countries only recorded tornadoes that produced severe damage or loss of life. Consequently, available documentation in 1973 mainly covered the United States. On average, most recorded tornadoes, including the vast majority of significant—F2 or stronger—tornadoes, form in the U.S., although as many as 500 may take place internationally. Some locations, like Bangladesh, are as prone to violent tornadoes as the U.S., meaning F4 or greater events on the Fujita scale.

<span class="mw-page-title-main">2021 South Moravia tornado</span> Violent IF4 tornado in the Czech Republic

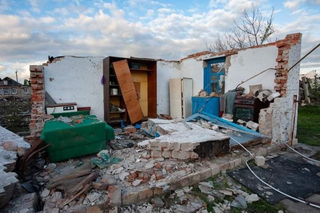
A rare, violent, and deadly long-tracked tornado struck several villages in the Hodonín and Břeclav districts of the South Moravian Region of the Czech Republic in the evening of 24 June 2021, killing six people and injuring at least 200 others. This tornado is the widest on record in Europe, at 3.5km maximum width. The tornado struck seven municipalities, with the worst damage in the villages of Hrušky, Moravská Nová Ves, Mikulčice and Lužice.

<span class="mw-page-title-main">2022 Russia–Ukraine tornado outbreak</span> 2022 Tornado outbreak in Russia and Ukraine

On 18 September 2022, a small but significant and fatal tornado outbreak began in Eastern Ukraine and moved into Russia, producing at least 8 tornadoes, including an intense F3 tornado and three possible, unconfirmed tornadoes. On September 19, a significant tornado occurred in Russia, with another possible, unconfirmed tornado and severe straight-line thunderstorm wind damage. Through the event, 3 people were killed and at least 8 others were injured.

This page documents the tornadoes and tornado outbreaks of 1948, primarily in the United States. Most tornadoes form in the U.S., although some events may take place internationally. Tornado statistics for older years like this often appear significantly lower than modern years due to fewer reports or confirmed tornadoes. Also, prior to 1950, tornadoes were not officially surveyed by the U.S. Weather Bureau, which would later become the National Weather Service, and thus had no official rating. All documented significant tornadoes were instead given unofficial ratings by tornado experts like Thomas P. Grazulis.

This page documents the tornadoes and tornado outbreaks of 1946, primarily in the United States. Most recorded tornadoes form in the U.S., although some events may take place internationally. Tornado statistics for older years like this often appear significantly lower than modern years due to fewer reports or confirmed tornadoes.

<span class="mw-page-title-main">Tornadoes of 2023</span> List of notable worldwide tornadoes occurring in 2023

This is a list of notable tornadoes and tornado outbreaks worldwide in 2023. Strong, destructive tornadoes form most frequently in the United States, Argentina, Brazil, Bangladesh and East India, but can occur almost anywhere. Tornadoes develop occasionally in southern Canada during the Northern Hemisphere's summer, and at other times of the year across Europe, Asia, Argentina, Australia and New Zealand. They are often accompanied by other forms of severe weather, including thunderstorms, strong winds, and large hail. Worldwide, 116 tornado-related deaths were confirmed – 83 in the United States, 12 in China, nine in Indonesia, eight in Myanmar, three in Turkey, and one in Saudi Arabia.

This is a timeline of scientific and technological advancements as well as notable academic or government publications in the area of atmospheric sciences and meteorology during the 21st century. Some historical weather events are included that mark time periods where advancements were made, or even that sparked policy change.

References

  1. "The International Fujita (IF) Scale Tornado and Wind Damage Assessment Guide" (PDF). ESSL.org. European Severe Storms Laboratory . Retrieved 26 June 2022.
  2. Tomás Púcik; David Rúva; Miroslav Singer; Miloslav Stanëk; Pieter Groenemeijer (23 June 2022). "Damage Survey of the Violent Tornado in Southeast Czechia on 24 June 2021" (PDF). European Severe Storms Laboratory. pp. 1–31. Retrieved 16 May 2023.
  3. 1 2 3 4 5 6 7 8 9 10 "The International Fujita (IF) Scale" (PDF). European Severe Storms Laboratory. Retrieved 8 May 2023.
  4. 1 2 3 4 5 6 7 8 9 10 Pieter Groenemeijer (ESSL); Lothar Bock (DWD); Juan de Dios Soriano (AEMet); Maciej Dutkiewicz (Bydgoszcz University of Science and Technology); Delia Gutiérrez-Rubio (AEMet); Alois M. Holzer (ESSL); Martin Hubrig; Rainer Kaltenberger; Thilo Kühne (ESSL); Mortimer Müller (Universität für Bodenkultur); Bas van der Ploeg; Tomáš Púčik (ESSL); Thomas Schreiner (ESSL); Miroslav Šinger (SHMI); Gabriel Strommer (ESSL); Andi Xhelaj (University of Genova) (30 July 2023). "The International Fujita (IF) Scale" (PDF). European Severe Storms Laboratory. Retrieved 30 July 2023.
  5. 1 2 "Severe Thunderstorm Climatology". Archived from the original on 2012-10-04. Retrieved 2022-07-17.
  6. A. C. M. Beljaars (1 December 1987). "The Influence of Sampling and Filtering on Measured Wind Gusts". Journal of Atmospheric and Oceanic Technology. 4 (4): 613–626. Bibcode:1987JAtOT...4..613B. doi: 10.1175/1520-0426(1987)004<0613:TIOSAF>2.0.CO;2 . ISSN   1520-0426.