List of countries by natural gas consumption

Last updated

This is a list of countries by annual natural gas consumption. [1] [2] For informational purposes, several non-sovereign entities are also included in this list.

Country/RegionNatural Gas- consumption
(million m³/year)
Year
  World 3,929,0002019
Flag of the United States.svg  United States 846,6002019
Flag of Europe.svg  European Union 469,6002019
Flag of Russia.svg  Russia 444,3002019
Flag of the People's Republic of China.svg  China 307,3002019
Flag of Iran.svg  Iran 223,6002019
Infobox ASEAN flag.svg  ASEAN 165,9002019
Flag of Canada (Pantone).svg  Canada 120,3002019
Flag of Saudi Arabia.svg  Saudi Arabia 113,6002019
Flag of Japan.svg  Japan 108,1002019
Flag of Mexico.svg  Mexico 90,7002019
Flag of Germany.svg  Germany 88,7002019
Flag of the United Kingdom.svg  United Kingdom 78,8002019
Flag of the United Arab Emirates.svg  United Arab Emirates 72,2002017
Flag of Italy.svg  Italy 72,1002017
Flag of Egypt.svg  Egypt 58,9002020
Flag of India.svg  India 54,2002017
Flag of Turkey.svg  Turkey 51,7002017
Flag of Thailand.svg  Thailand 50,1002017
Flag of South Korea.svg  South Korea 49,4002017
Flag of Argentina.svg  Argentina 48,5002017
Flag of Qatar.svg  Qatar 47,4002017
Flag of France.svg  France 44,7002017
Flag of Malaysia.svg  Malaysia 42,8002017
Flag of Australia (converted).svg  Australia 41,9002017
Flag of Uzbekistan.svg  Uzbekistan 41,6002017
Flag of Pakistan.svg  Pakistan 40,7002017
Flag of Indonesia.svg  Indonesia 39,2002017
Flag of Algeria.svg  Algeria 38,9002017
Flag of Brazil.svg  Brazil 38,3002017
Flag of Venezuela.svg  Venezuela 37,6002017
Flag of the Netherlands.svg  Netherlands 36,1002017
Flag of Bangladesh.svg  Bangladesh 34,4002019
Flag of Spain.svg  Spain 32,0002017
Flag of Turkmenistan.svg  Turkmenistan 31,5002019
Flag of Ukraine.svg  Ukraine 29,8002017
Flag of Oman.svg  Oman 25,0002019
Flag of Kuwait.svg  Kuwait 23,5002019
Flag of the Republic of China.svg  Taiwan 23,3002019
Flag of Poland.svg  Poland 20,4002019
Flag of Iraq.svg  Iraq 19,9002019
Flag of Belarus.svg  Belarus 19,3002019
Flag of Nigeria.svg  Nigeria 18,8202015 est.
Flag of Trinidad and Tobago.svg  Trinidad and Tobago 17,5002019
Flag of Belgium (civil).svg  Belgium 17,4002019
Flag of Kazakhstan.svg  Kazakhstan 16,3002017
Flag of Bahrain.svg  Bahrain 15,5002015 est.
Flag of Colombia.svg  Colombia 13,4002019
Flag of Singapore.svg  Singapore 12,7002019
Flag of Azerbaijan.svg  Azerbaijan 11,8002019
Flag of Romania.svg  Romania 10,9002019
Flag of Israel.svg  Israel 10,8002019
Flag of Vietnam.svg  Vietnam 9,9002019
Flag of Hungary.svg  Hungary 9,8002019
Flag of Austria.svg  Austria 8,9002019
Flag of the Czech Republic.svg  Czech Republic 8,3002019
Flag of Peru.svg  Peru 8,3002019
Flag of Chile.svg  Chile 6,5002019
Flag of Slovakia.svg  Slovakia 6,2162007 est.
Flag of Portugal.svg  Portugal 6,1002019
Flag of Greece.svg  Greece 5,1002019
Flag of New Zealand.svg  New Zealand 4,8002019
Flag of Denmark.svg  Denmark 4,5552007 est.
Flag of Norway.svg  Norway 4,5002019
Flag of Libya.svg  Libya 4,4902015 est.
Flag of Ireland.svg  Ireland 4,3542015 est.
Flag of Syria.svg  Syria 4,3002015 est.
Flag of South Africa.svg  South Africa 4,3002019
Flag of the Philippines.svg  Philippines 4,1002019
Flag of Tunisia.svg  Tunisia 3,8502006 est.
Flag of Myanmar.svg  Myanmar 3,6202006 est.
Flag of Bulgaria.svg  Bulgaria 3,5002007 est.
Flag of Brunei.svg  Brunei 3,4802015 est.
Flag of Lithuania.svg  Lithuania 3,4402007 est.
Flag of Switzerland (Pantone).svg  Switzerland 3,4002019
Flag of Croatia.svg  Croatia 3,3002007
Flag of Hong Kong.svg  Hong Kong 3,1002019
Bandera de Bolivia (Estado).svg  Bolivia 3,0002007 est.
Flag of Jordan.svg  Jordan 2,8972015 est.
Flag of Moldova.svg  Moldova 2,4402007 est.
Flag of Serbia.svg  Serbia 2,1802015 est.
Flag of Armenia.svg  Armenia 2,0502015 est.
Flag of Latvia.svg  Latvia 2,0402007 est.
Flag of Finland.svg  Finland 2,0002019
Flag of Mozambique.svg  Mozambique 1,8952015 est.
Flag of Georgia.svg  Georgia 1,4902007 est.
Flag of Luxembourg.svg  Luxembourg 1,3292007 est.
Flag of Equatorial Guinea.svg  Equatorial Guinea 1,3002006 est.
Flag of Cote d'Ivoire.svg  Côte d'Ivoire 1,3002006 est.
Flag of Cuba.svg  Cuba 1,1852016 est.
Flag of Sweden.svg  Sweden 1,0002019
Flag of Morocco.svg  Morocco 1,0002019
Flag of Kyrgyzstan.svg  Kyrgyzstan 7682007 est.
Flag of Slovenia.svg  Slovenia 7432017 est.
Flag of Puerto Rico.svg  Puerto Rico 736.22007 est.
Flag of Angola.svg  Angola 6802006 est.
Flag of Cameroon.svg  Cameroon 6802015 est.
Flag of Ecuador.svg  Ecuador 6002019
Flag of Estonia.svg  Estonia 5252016 est.
Flag of Gabon.svg  Gabon 3782015 est.
Flag of the Dominican Republic.svg  Dominican Republic 2502006 est.
Flag of Bosnia and Herzegovina.svg  Bosnia and Herzegovina 2002015 est.
Flag of the Republic of the Congo.svg  Republic of the Congo 1802006 est.
Flag of the Taliban.svg  Afghanistan 146.62015 est.
Flag of Tanzania.svg  Tanzania 1462006 est.
Flag of Papua New Guinea.svg  Papua New Guinea 1002015 est.
Flag of North Macedonia.svg  North Macedonia 602015 est.
Flag of Senegal.svg  Senegal 602015 est.
Flag of Uruguay.svg  Uruguay 402015 est.
Flag of Albania.svg  Albania 352015 est.
Flag of Tajikistan.svg  Tajikistan 202015 est.
Flag of Barbados.svg  Barbados 12.72015 est.
Flag of Macau.svg  Macau 0.42013 est.

Related Research Articles

<span class="mw-page-title-main">Economy of Gabon</span>

The economy of Gabon is characterized by strong links with France, large foreign investments, dependence on skilled foreign labor, and decline of agriculture. Gabon on paper enjoys a per capita income four times that of most nations of sub-Saharan Africa/higher than North African countries, but its reliance on resource extraction industry fail to release much of the population from extreme poverty, as much of 30% of the population lives under the poverty threshold.

<span class="mw-page-title-main">Liquefied petroleum gas</span> Fuel for heating, cooking and vehicles

Liquefied petroleum gas is a fuel gas which contains a flammable mixture of hydrocarbon gases, specifically propane, propylene, butylene, isobutane, and n-butane.

This is a list of lists of countries and territories by various criteria. A country or territory is a geographical area, either in the sense of nation or state.

<span class="mw-page-title-main">Energy in the United States</span>

Energy in the United States is obtained from a diverse portfolio of sources, although the majority came from fossil fuels in 2021, as 36% of the nation's energy originated from petroleum, 32% from natural gas, and 11% from coal. Electricity from nuclear power supplied 8% and renewable energy supplied 12%, which includes biomass, wind, hydro, solar and geothermal.

<span class="mw-page-title-main">Lists of environmental topics</span>

The natural environment, commonly referred to simply as the environment, is all living and non-living things that occur naturally on Earth or some part of it. This includes complete ecological units that function as natural systems without massive human intervention, including all vegetation, animals, microorganisms, rocks, atmosphere and natural phenomena that occur within their boundaries. And it includes universal natural resources and physical phenomena that lack clear-cut boundaries, such as air, water, and climate, as well as energy, radiation, electric charge, and magnetism, not originating from human activity.

The energy policy of India is to increase the locally produced energy in India and reduce energy poverty, with more focus on developing alternative sources of energy, particularly nuclear, solar and wind energy. Net energy import dependency was 40.9% in 2021-22.

<span class="mw-page-title-main">Energy in Iran</span> Overview of the production, consumption, import and export of energy and electricity in Iran

Iran has the fourth largest oil reserves and the 2nd largest natural gas reserves in the world. The nation is a member of OPEC, and generates approximately 50% of state revenue through oil exports.

<span class="mw-page-title-main">Energy in India</span> Overview of the production, consumption, import and export of energy and electricity in India

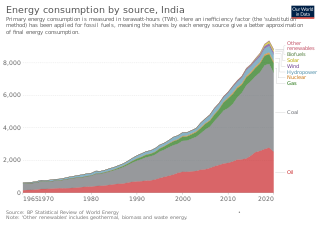
Since 2013, total primary energy consumption in India has been the third highest in the world after China and United States. India is the second-top coal consumer in the year 2017 after China. India ranks third in oil consumption with 22.1 crore tons in 2017 after United States and China. India is net energy importer to meet nearly 47% of its total primary energy in 2019.

<span class="mw-page-title-main">Natural gas by country</span>

This article includes a chart representing proven reserves, production, consumption, exports and imports of natural gas by country. Below the numbers there is specified which position a country holds by the corresponding parameter. Dependent territories, not fully recognized countries and supranational entities are not ranked. By default countries are ranked by their total proven natural gas reserves.

<span class="mw-page-title-main">Energy in Italy</span> Overview of the production, consumption, import and export of energy and electricity in Italy

Energy in Italy comes mostly from fossil fuels. Among the most used resources are petroleum, natural gas, coal and renewables. Italy has few energy resources, and most supplies are imported.

<span class="mw-page-title-main">Natural gas in China</span> Overview of natural gas use in China

Between 2009 and 2014, gas consumption, production, and imports in China have grown dramatically, with two-digit growth. According to CNPC, the installed capacity of gas-fired power plants in the country is expected to reach around 138 million-154 million kilowatts in 2025, and further grow to 261 million-308 million kilowatts by 2030.

<span class="mw-page-title-main">Energy in Spain</span> Overview of the production, consumption, import and export of energy and electricity in Spain

Primary energy consumption in Spain in 2015 was mainly composed of fossil fuels. The largest sources are petroleum (42.3%), natural gas (19.8%) and coal (11.6%). The remaining 26.3% is accounted for by nuclear energy (12%) and different renewable energy sources (14.3%). Domestic production of primary energy includes nuclear (44,8%), solar, wind and geothermal (22,4%), biomass and waste (21,1%), hydropower (7,2%) and fossil (4,5%).

<span class="mw-page-title-main">Energy in Belarus</span> Overview of the production, consumption, import and export of energy and electricity in Belarus

Energy in Belarus describes energy and electricity production, consumption and import in Belarus. Belarus is a net energy importer. According to IEA, the energy import vastly exceeded the energy production in 2015, describing Belarus as one of the world's least energy sufficient countries in the world. Belarus is very dependent on Russia.

<span class="mw-page-title-main">Yuzivska gas field</span> Ukrainian gas field

The Yuzivska gas field is an unconventional Ukrainian natural gas field that was discovered in 2010. It was expected to begin production in 2017, but development was halted because of the outbreak of the 2014 war in the Donbas region near the field, a sharp plunge in European natural gas prices, and opposition from local residents.

<span class="mw-page-title-main">Energy in the Philippines</span>

The total primary energy consumption of the Philippines in 2012 was 30.2 Mtoe, most of which came from fossil fuels. Electricity consumption in 2010 was 64.52 TWh, of which almost two-thirds came from fossil fuels, 21% from hydroelectric plants, and 13% from other renewable sources. The total generating capacity was 16.36 GW.

<span class="mw-page-title-main">World energy supply and consumption</span> Global production and usage of energy

World energy supply and consumption refers to the global primary energy production, energy conversion and trade, and final consumption of energy. Energy can be used in various different forms, as processed fuels or electricity, or for various different purposes, like for transportation or electricity generation. Energy production and consumption are an important part of the economy. This topic includes heat, but not energy from food.

References

  1. "Natural gas – consumption". www.cia.gov.
  2. "BP's Statistical Review of World Energy June, 2018" (PDF). Retrieved 3 January 2019.